Striking at the Heart of the Matter…
Headlines consistently portray South Africa’s economy as one “hobbled” by strikes. News stories describe the country as being gripped by upheaval due to violent, relentless industrial action, or blame strikes for causing spiraling currency depreciation. The Marikana incidence in 2012, for instance, further fueled further opinion that South Africa is “strike-prone,” and a “striking nation,” when compared with other countries. But, by using actual data and some simple comparative statistics, we challenge this common perception and find it significantly wanting.
Let Data Tell the Story
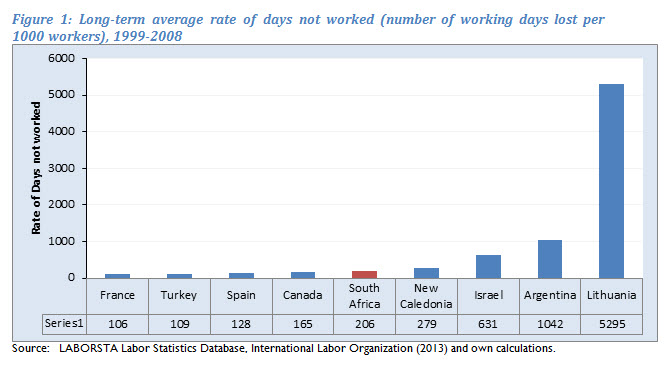
Using the available labor statistics between the periods 1999 and 2008 (published by the International Labor Organization (ILO): Laborsta database), evidence suggests that it is not true that South Africa’s long-term labor movement is one of the most excessive and strike-prone in the world. The standard measurement for the severity rate of strikes used by Laborsta, published in European Union reports and frequently used by analysts is “rates of days not worked”—calculated as the number of work days lost as a result of strikes and lockouts per 1,000 general workers per year.
[1]
By using this measure, we note that South Africa’s long-term strike rate ranks fifth in the world with 206 days lost per 1,000 workers (see Figure 1). Lithuania ranks first (5,295 days)
[2], followed by Argentina (1,042 days), Israel (631 days) and New Caledonia (279 days), who all rank well above South Africa.
However, this measure is fairly crude. It is difficult to maintain a consistent measure for the true number of workers for international comparisons, as some countries include persons aged 12 years and over, while others only include those who are 15 years and up. It is also subjective in how individual countries differentiate between formal and informal sector employments. In addition, data is limited, as many countries do not regularly update their “rates of days not worked” information. Only 36 countries (excluding the U.S.) report regularly to the ILO for international comparisons.
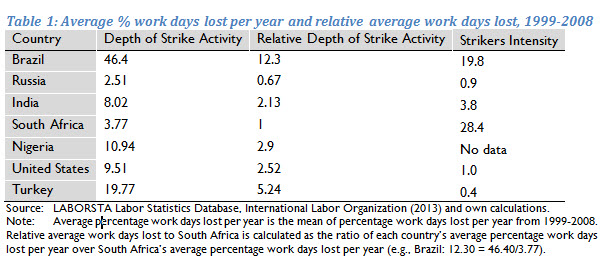
In light of this, we derived two alternative measures to analyze strike activities. The first looks at the average duration of strikers’ working days spent striking, and the second measures the proportion of the workforce involved in industrial action:
- The depth of strike is measured as working days lost per strikers’ working days per annum.
- Strikers’ intensity is the number of strikers per 1,000 employed workers.
Equipped now with 87 countries for comparison, these composite measures taken together allow for a far more nuanced assessment of the severity of strikes in South Africa.
The Depth of Strike Activities
Among a sample of the BRICS (Brazil, Russia, India, China and South Africa) economies (excluding China due to lack of data), South Africa ranks just third in terms of “depth of strike” activity. South Africa only lost an average of 3.7 percent of work days per striker during this period. Brazil ranks first with a significantly higher 46.4 percent of days lost. India is second with 8 percent and Russia is fourth with 2.5 percent (see Table 1). Put differently, the average of these countries’ experience for the 10-year period in terms of depth of strike activity is 19 percent of working days lost over strikers’ working days per year—significantly higher than South Africa’s figure. Compared to seven non-BRICS countries with similar economies, such as Nigeria and Turkey, South Africa’s average of 3.7 percent ranks only sixth (again, see Table 1). Even the U.S. has a higher average of 9.5 percent.
Strikers’ Intensity
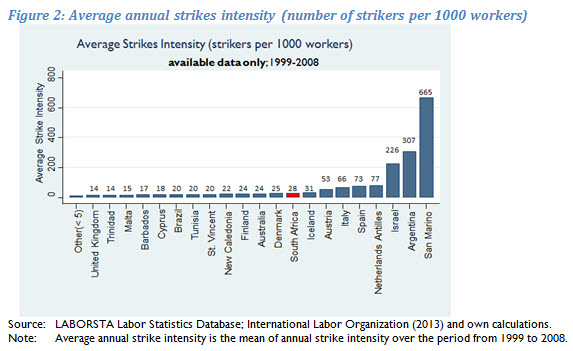
Another perception about work stoppages in South Africa, whether it be from strikes or lockouts, is that there are excessively large numbers of workers involved. Yet “strikers’ intensity” (a composite measure calculated as the number of strikers per 1,000 workers) shows that South Africa’s average for the period between 1998 and 2009 is modest compared to other countries (see Figure 2). On average, only 28 out of 1,000 workers were involved in strike action for the period reviewed. This is on a par with countries like Austria and Finland (both 24 per 1,000 workers), or Denmark (25), and far below Argentina (307 per 1,000 workers), Israel (226), Spain (73), Italy (66) and others. With the onset of the eurozone debt crisis in 2010, and the violent austerity protests that loom large in Europe still, recent data will no doubt show even higher numbers for many of these countries.
The Result?
The results of these comparisons show that strike action and the implied time costs in terms of work days lost per strikers’ working days, are common in any democratic economy with a functional industrial relations environment where workers and employers are free to engage and negotiate the terms of labor costs. Even in terms of strikers’ intensity, South Africa’s experience is no different from that taking place in both developed and developing countries in the long run. However, sectoral analysis of strikes might reveal more information about trends since strikes in South Africa tend to be concentrated in the mining sector.
The key lesson that emerges from this analysis of the strike action that has taken place in South Africa in recent years, is that real strike data suggests that in an internationally comparative context—i.e., relative to other middle- and high-income economies—the incidence, intensity and time costs of strikes as measured in number of working days lost in South Africa is drastically overstated.
Note: This blog reflects the views of the authors only and does not necessarily reflect the views of the Africa Growth Initiative.
The
Development Policy Research Unit (DPRU)
is one of the Brookings Africa Growth Initiative’s six local think tank partners based in Africa.
[1] The number of work days lost is measured in terms of the sum of the actual working days during which work would normally have been carried out by each worker involved, had there been no stoppage. In other words, if 50 workers were involved in strikes or lockouts for 10 days during the year, then the total working days lost per year would be 500 days. The 1,000 workers measure is the number of employed workers counted in thousands.
[2] In other words, if there are 30,000 work days for 1,000 workers per month, and roughly 5,000 of those days are lost in Lithuania per year; this means that an average Lithuanian worker misses work about one day a week.
The Brookings Institution is committed to quality, independence, and impact.
We are supported by a diverse array of funders. In line with our values and policies, each Brookings publication represents the sole views of its author(s).


Commentary
South Africa’s Strike Data Revisited
April 2, 2014