
Introduction
In 2020, the average U.S. city experienced a surge in its homicide rate of almost 30%—the fastest spike ever recorded in the country. Across the nation, more than 24,000 people were killed compared to around 19,000 the year before.
Homicides remained high in 2021 and 2022, but in 2023 they began to fall rapidly. Projections suggest the national homicide rate in 2024 is on track to return to levels close to those recorded in 2019, prior to the COVID-19 pandemic. Yet that spike in murders continues to deliver major costs in terms of the lives lost, the people incarcerated, and the perception of decreased safety across the country.
Some commentators have suggested the increase in homicides during 2020 was a response to the murder of George Floyd by a Minneapolis police officer in May of that year. Others hypothesized that it was caused by a police “pull back,” in which officers chose to do less work in reaction to the protests that followed Floyd’s death.
As more information has become available, these theories appear to be less supported by evidence than some initially thought.1 The evidence indicates that the national homicide rate was already on track to reach a peak far above the previous year even before Floyd was killed. (See Figure 1.)
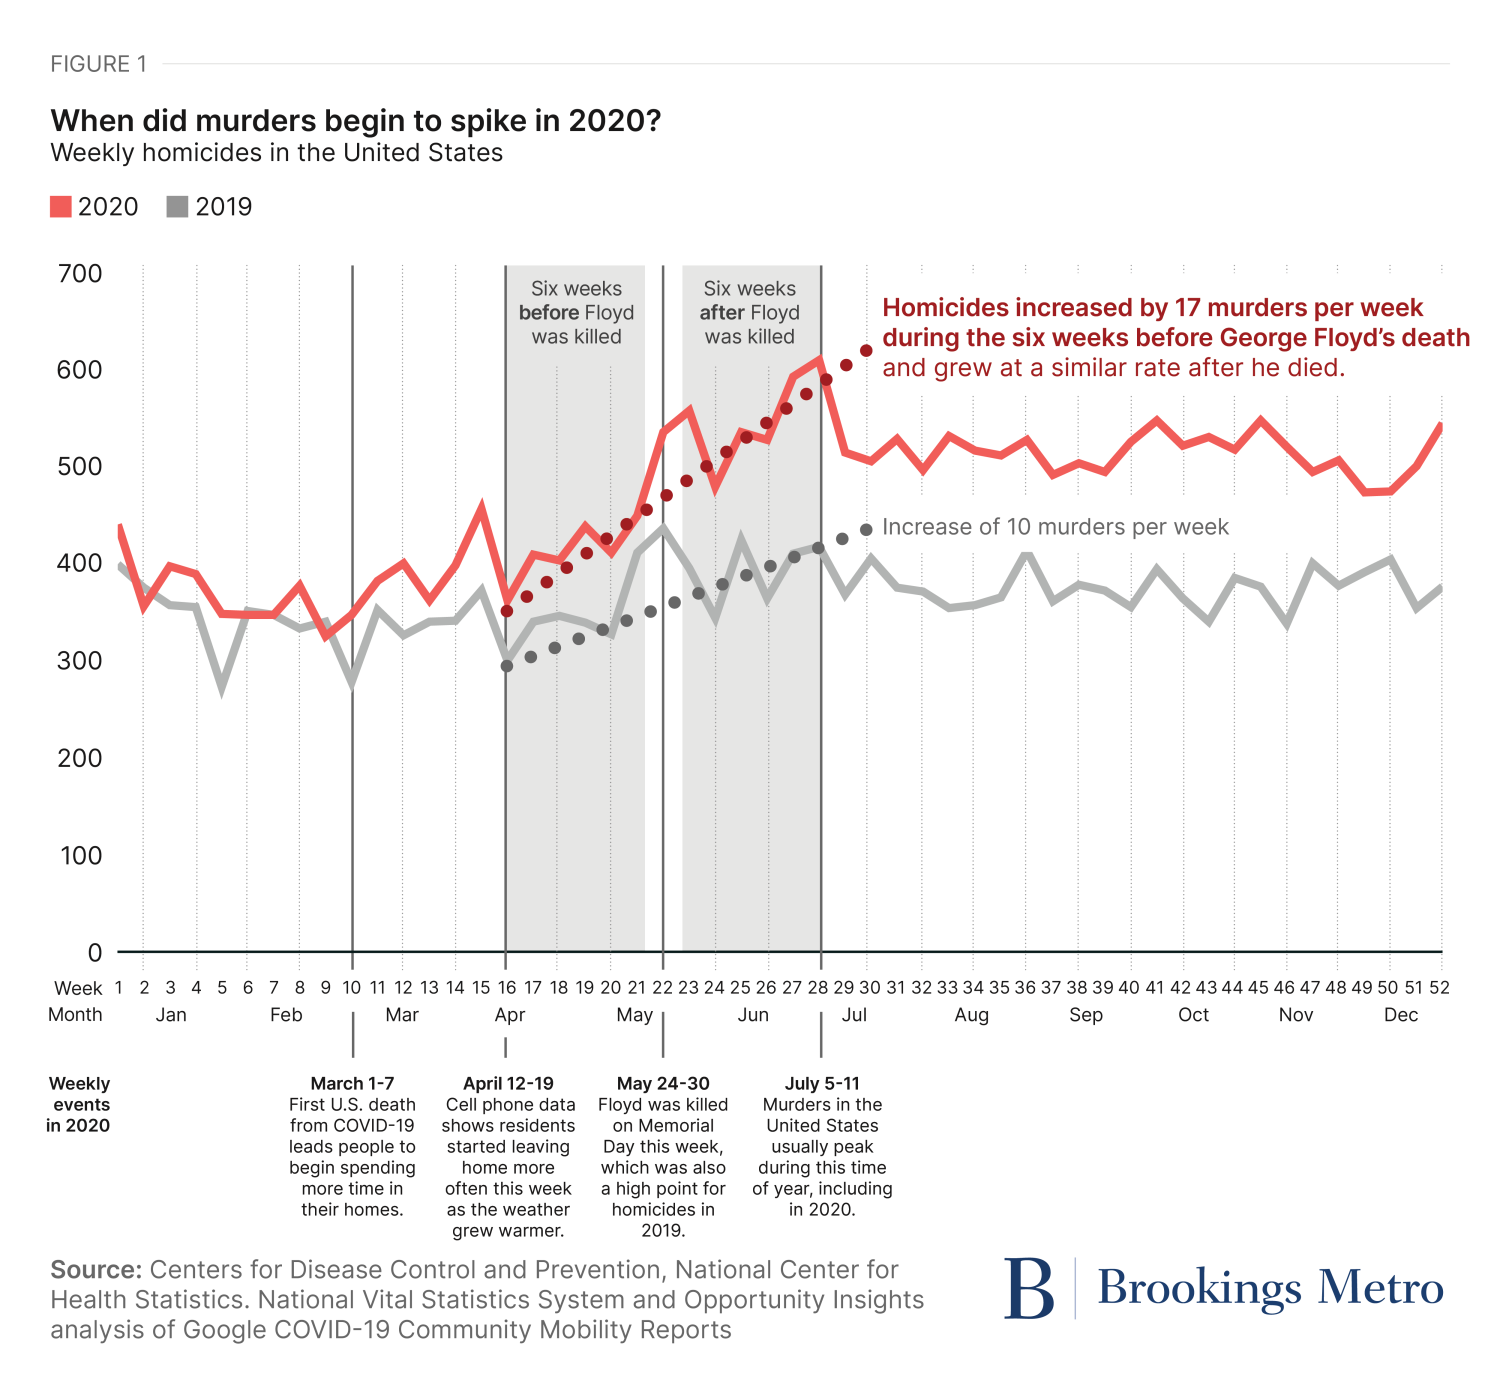
As Figure 1 demonstrates, murders began to rise rapidly in mid-April of 2020. Cell phone data show this is when residents started leaving home more often as lockdown policies eased and the weather grew warmer. During the 6-week period from April 12 to May 23 (weeks 16 to 21 in Figure 1), homicides went up by an average of 17 murders each week.
After Floyd was killed on May 25, the national homicide rate continued to follow this trend, with additional increases during the 2 weeks around Memorial Day and the 2-week period around July 4. But even the highest point of these additional increases was less than 40 murders above the pre-existing trend. While it’s true that homicides did temporarily rise more than they were already on track to following Floyd’s death, these additional increases are unlikely to explain the 5,000 additional murders seen during the year.
This leaves us with a question: What happened that could have caused homicides to spike in 2020, remain high for 2 years, and then start to decline rapidly in 2023?
New data offers a potential explanation. In this report, we analyze thousands of police records and compare them to changes that occurred in U.S. cities just before homicides started to surge. This showed that the spike in murders during 2020 was directly connected to local unemployment and school closures in low-income areas. Cities with larger numbers of young men forced out of work and teen boys pushed out of school in low-income neighborhoods during March and early April, had greater increases in homicide from May to December that year, on average. The persistence of these changes can also explain why murders remained high in 2021 and 2022 and then fell in late 2023 and 2024.
These analyses point to new answers and offer focused solutions that civic leaders can use to prevent future spikes in murder and reduce current levels of violence. We present these findings in detail below in three main sections:
- First, we review evidence from existing research that reveals a formula for how violence develops in cities.
- Second, we analyze detailed administrative data from a single city with multiple spikes in murder prior to the COVID-19 pandemic to illustrate how this formula applies to local communities.
- Finally, we use lessons from this analysis to offer a new explanation for the national spike in homicides in 2020 and make recommendations on how to avoid future increases in murder.
How can data help explain patterns of violence in U.S. cities?
Two findings from previous research offer insights into factors that affect violence in the United States. Though both are well-known among experts who study crime, a number of civic leaders are unfamiliar with them.
Finding #1. Neighborhoods with high rates of poverty have far more homicides than other residential areas in U.S. cities.
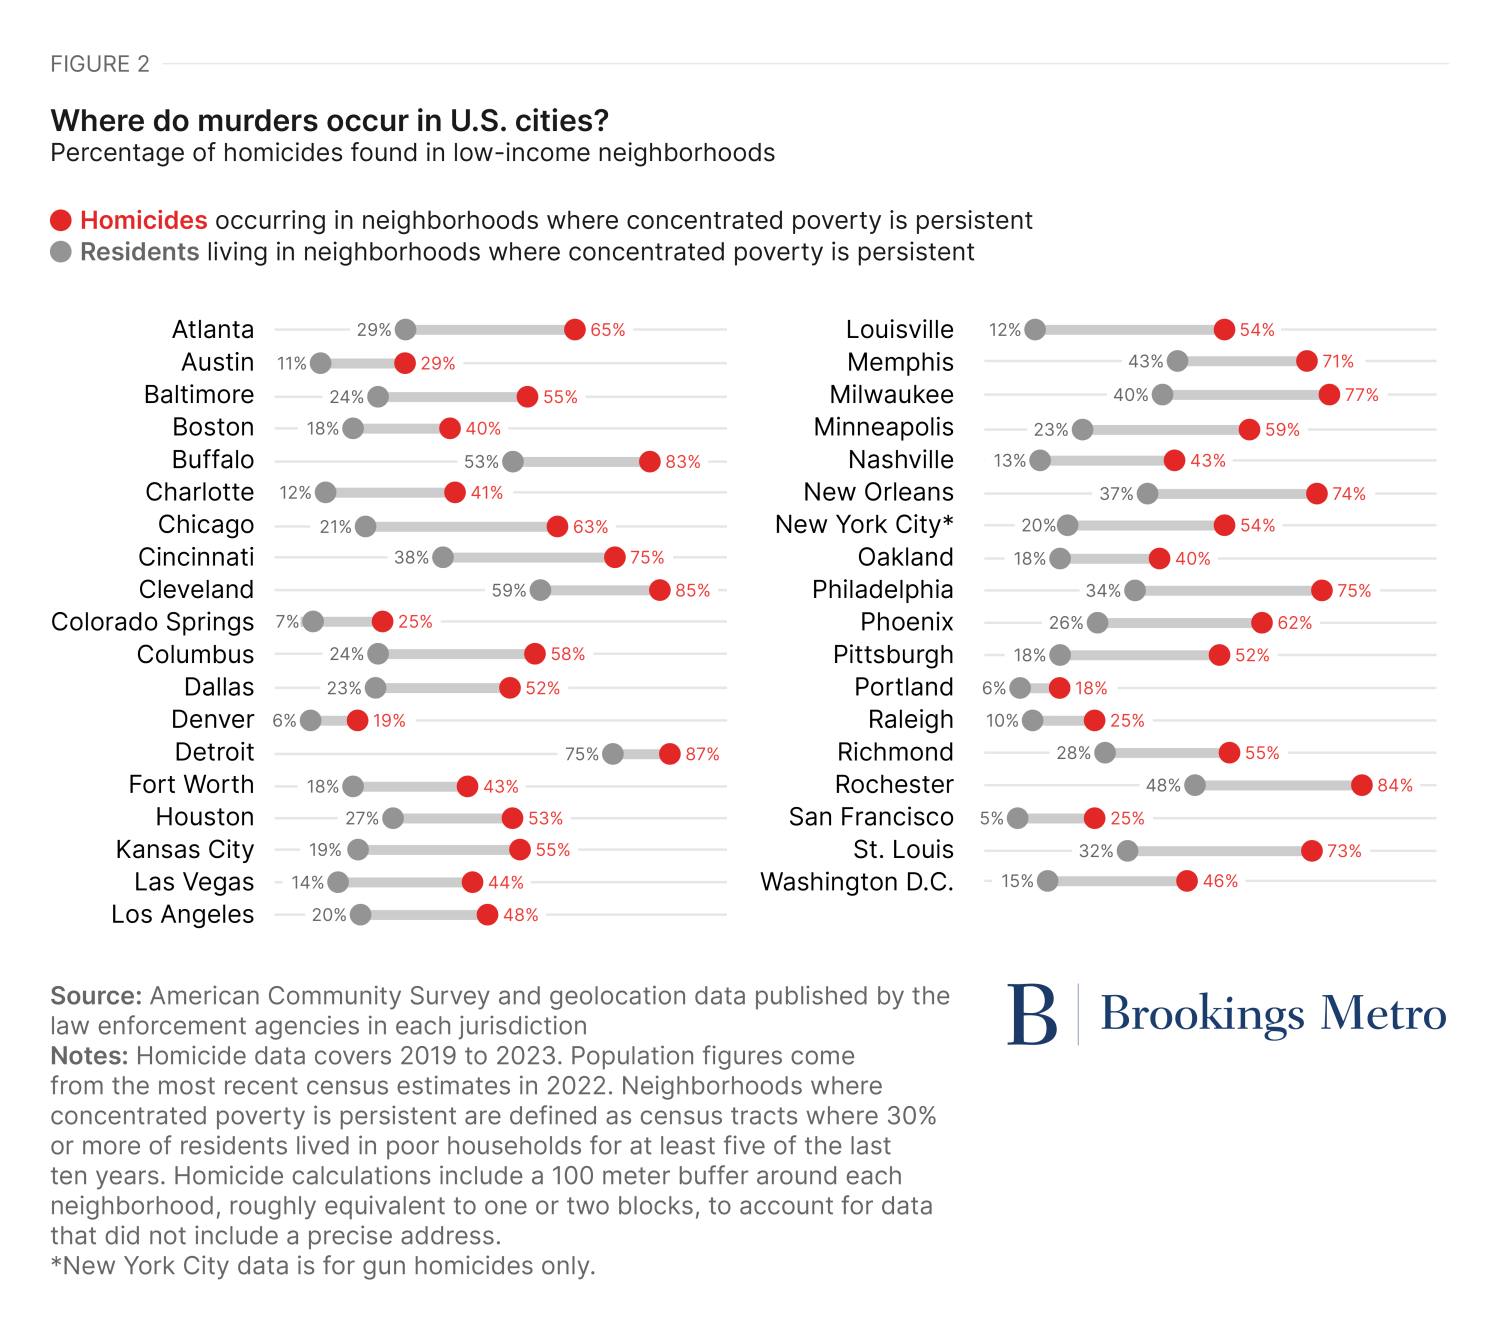
If you map the location of murders in U.S. cities, a clear pattern emerges. Some neighborhoods have no murders, while others experience large numbers of homicides. The places with the most murders tend to have something in common: Almost all of them are neighborhoods with concentrated poverty—residential areas where at least 30% of the population lives below the poverty line.2
In the typical U.S. city, around 10% to 20% of people live in neighborhoods where concentrated poverty is persistent.3 Homicide rates in these low-income neighborhoods are 3 times to 4 times higher than in other residential areas in the same city, on average.4 (See Figure 2.)
There are a number of reasons why violence is concentrated in the same places as poverty. People who grow up in neighborhoods with high rates of poverty have fewer opportunities, weaker professional networks, and earn less income than those in other areas. Children in these communities are more frequently exposed to hazards, such as lead paint and air pollution, which are linked to violent behavior later in life. Low-income neighborhoods also have larger numbers of abandoned businesses and empty lots. Characteristics such as these create an environment much more conducive to crime. Unfortunately, residents in high-poverty communities often have few resources to address them due to low levels of income and historic policies, such as redlining, that deprived them of investments.
Finding #2. Teen boys who are not in school and young men who are unemployed are much more likely to engage in violence than other neighborhood residents.
The vast majority of people who live in neighborhoods with concentrated poverty are not involved in violent crime. Only a very small number of residents in these areas commit homicides, and they are quite different from their neighbors. Studies suggest there are three characteristics that set people engaged in violence apart.
- Most are teenage boys and young men in their twenties. Males under the age of 30 commit more than half of all murders in the United States.
- They are more likely to be high school dropouts. Estimates suggest that around 40% of people incarcerated in U.S. prisons did not graduate from high school or earn a GED, compared to about 9 percent of all adults in the country.
- They are more likely to be unemployed. Studies have found that more than one-third of people who are incarcerated did not have a job at the time their crime was committed. This is 3 times higher than the rate for all men between the ages of 25 and 54.
Research also helps explain why the teen boys and young men who engage in violence would have difficulty completing high school and joining the workforce. People who become involved in violence have often been victims of violence themselves, are more likely to have been abused when they were children, and have higher rates of mental health issues. Due to these challenges, it is not surprising that they also have greater levels of alcohol and drug abuse.
These two findings can be combined into a formula for understanding patterns of violence in U.S. cities. (See Figure 3 below.) When a city has large numbers of low-income neighborhoods combined with large numbers of teen boys not in school or young men out of work, it is likely to have high rates of homicide and other forms of violence.
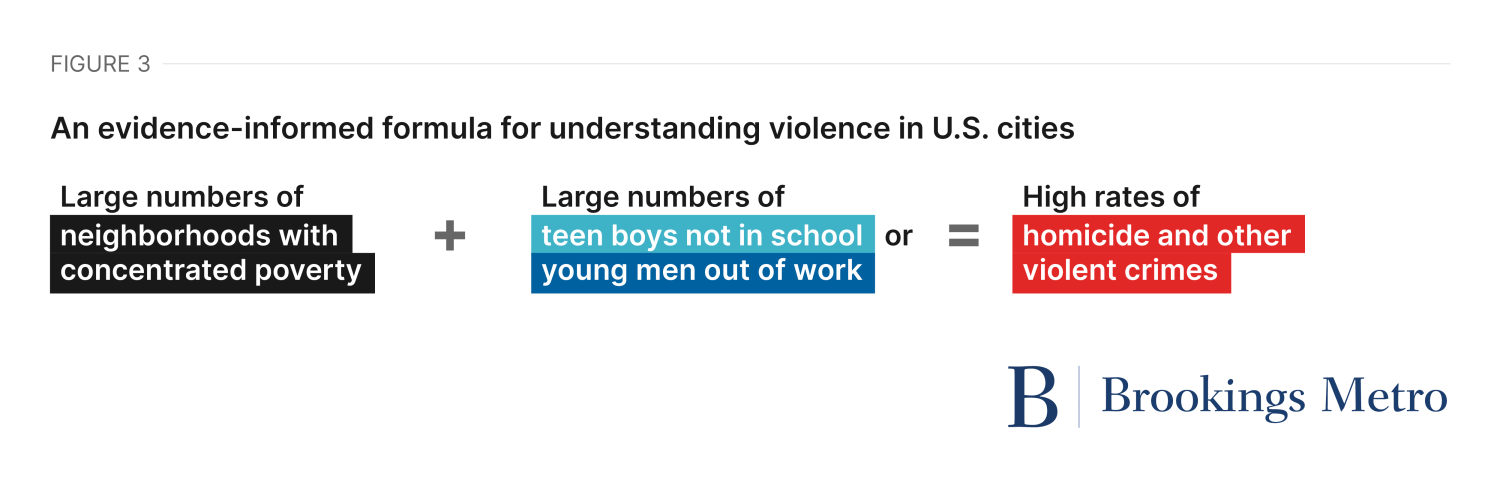
Though there are many factors that influence local crime rates, the components of this formula provide a commonsense way to understand how local violence develops. If a city contains more of the places where murders are likeliest to occur and also produce more of the people likeliest to commit murder, then it is reasonable to expect it will have more murders.
Why did murder rates in a single city spike two separate times before 2020?
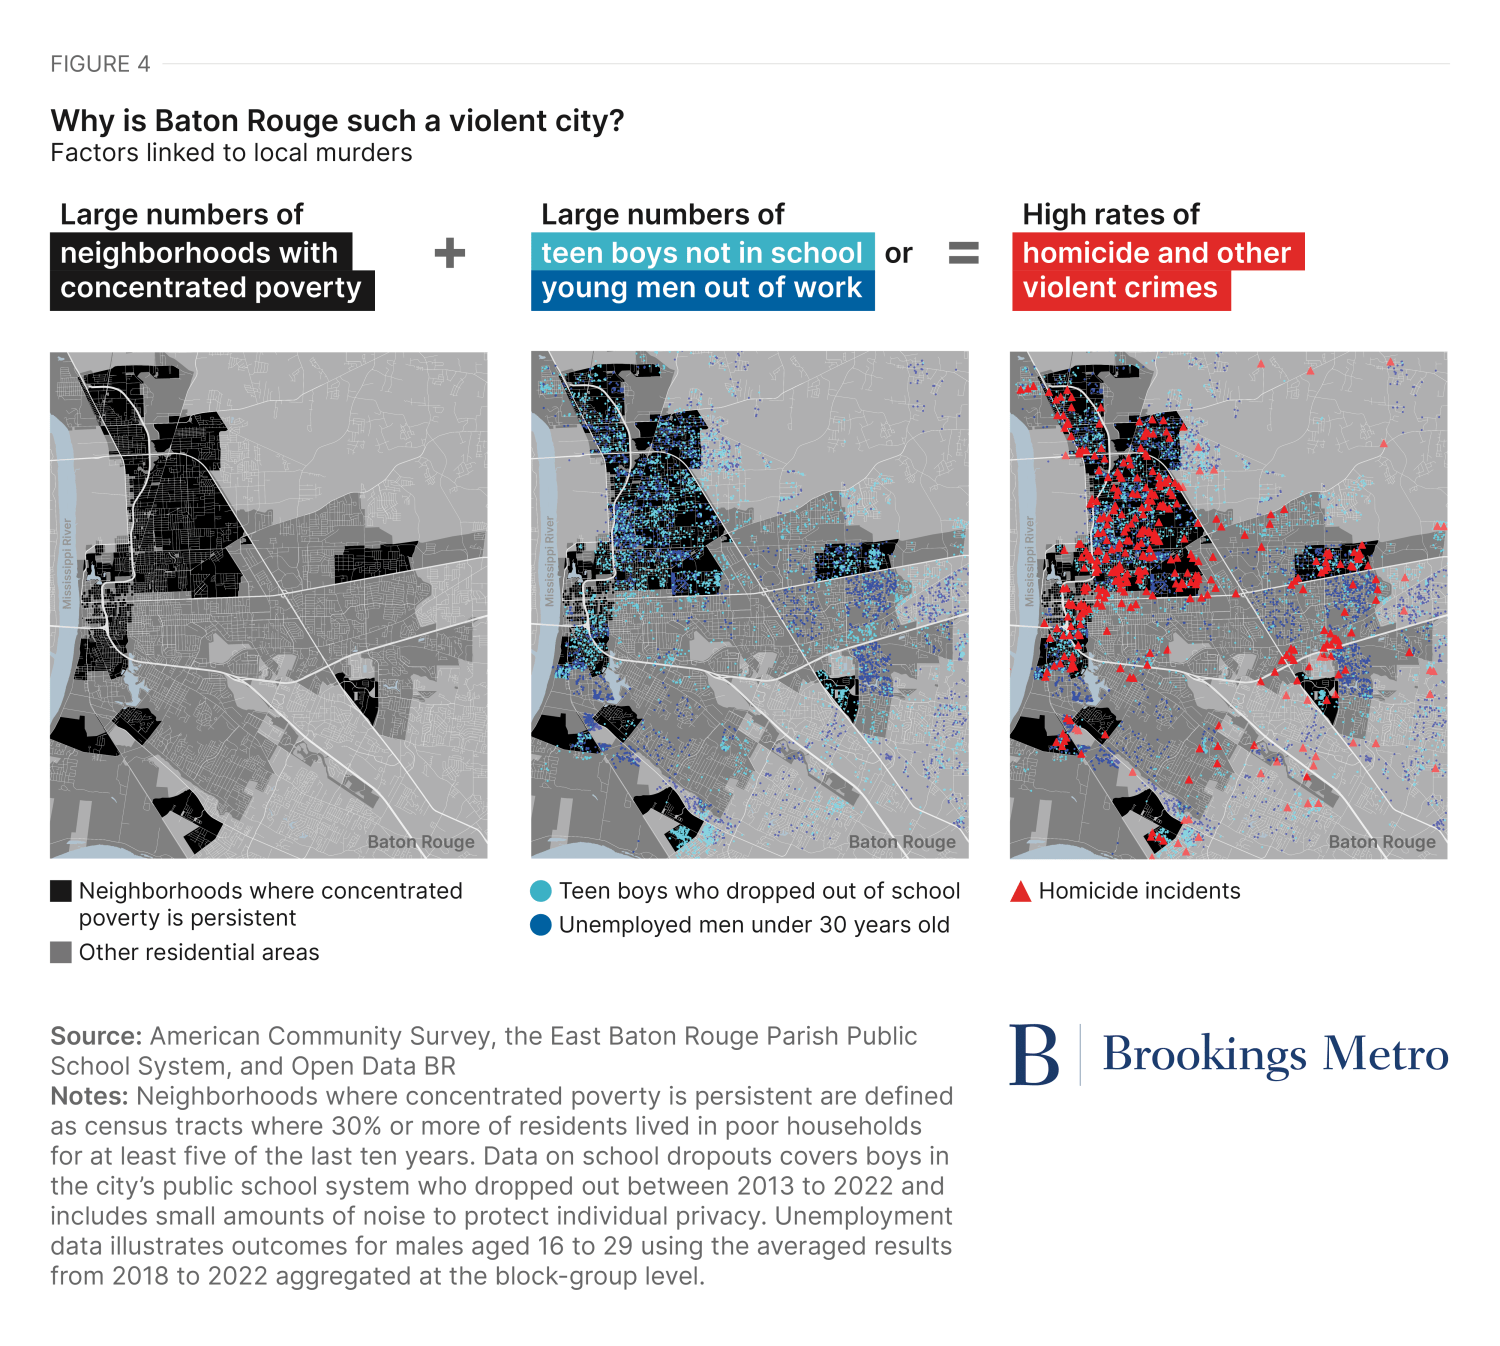
Baton Rouge, Louisiana is one of the most violent cities in the United States, with a homicide rate 4 times greater than the rest of the country. It is also a useful place to study rapid increases in murders, as the city experienced two separate spikes in homicide before 2020 that were not seen in the rest of the country.
Our team at Common Good Labs, in partnership with the Baton Rouge Area Foundation and a coalition of local civic leaders, conducted a study of one of the largest datasets on local public safety in the nation to understand how patterns of violence developed in the city. This included more than a decade of administrative records from the local district attorney’s office and the public school system.
The findings from previous research are clearly demonstrated in Baton Rouge’s crime data. Most of the adults convicted of murder in the city are young men under 30 years old. We estimate that around 60% of these young men grew up in neighborhoods where concentrated poverty is persistent, and 70% did not graduate high school.5
The city’s administrative records make it possible to illustrate each component of the formula from the previous section. The maps below show that the vast majority of local murders occur within or directly next to neighborhoods with concentrated poverty that also have large numbers of teen boys who did not finish high school and young men who are unemployed. (See Figure 4.)
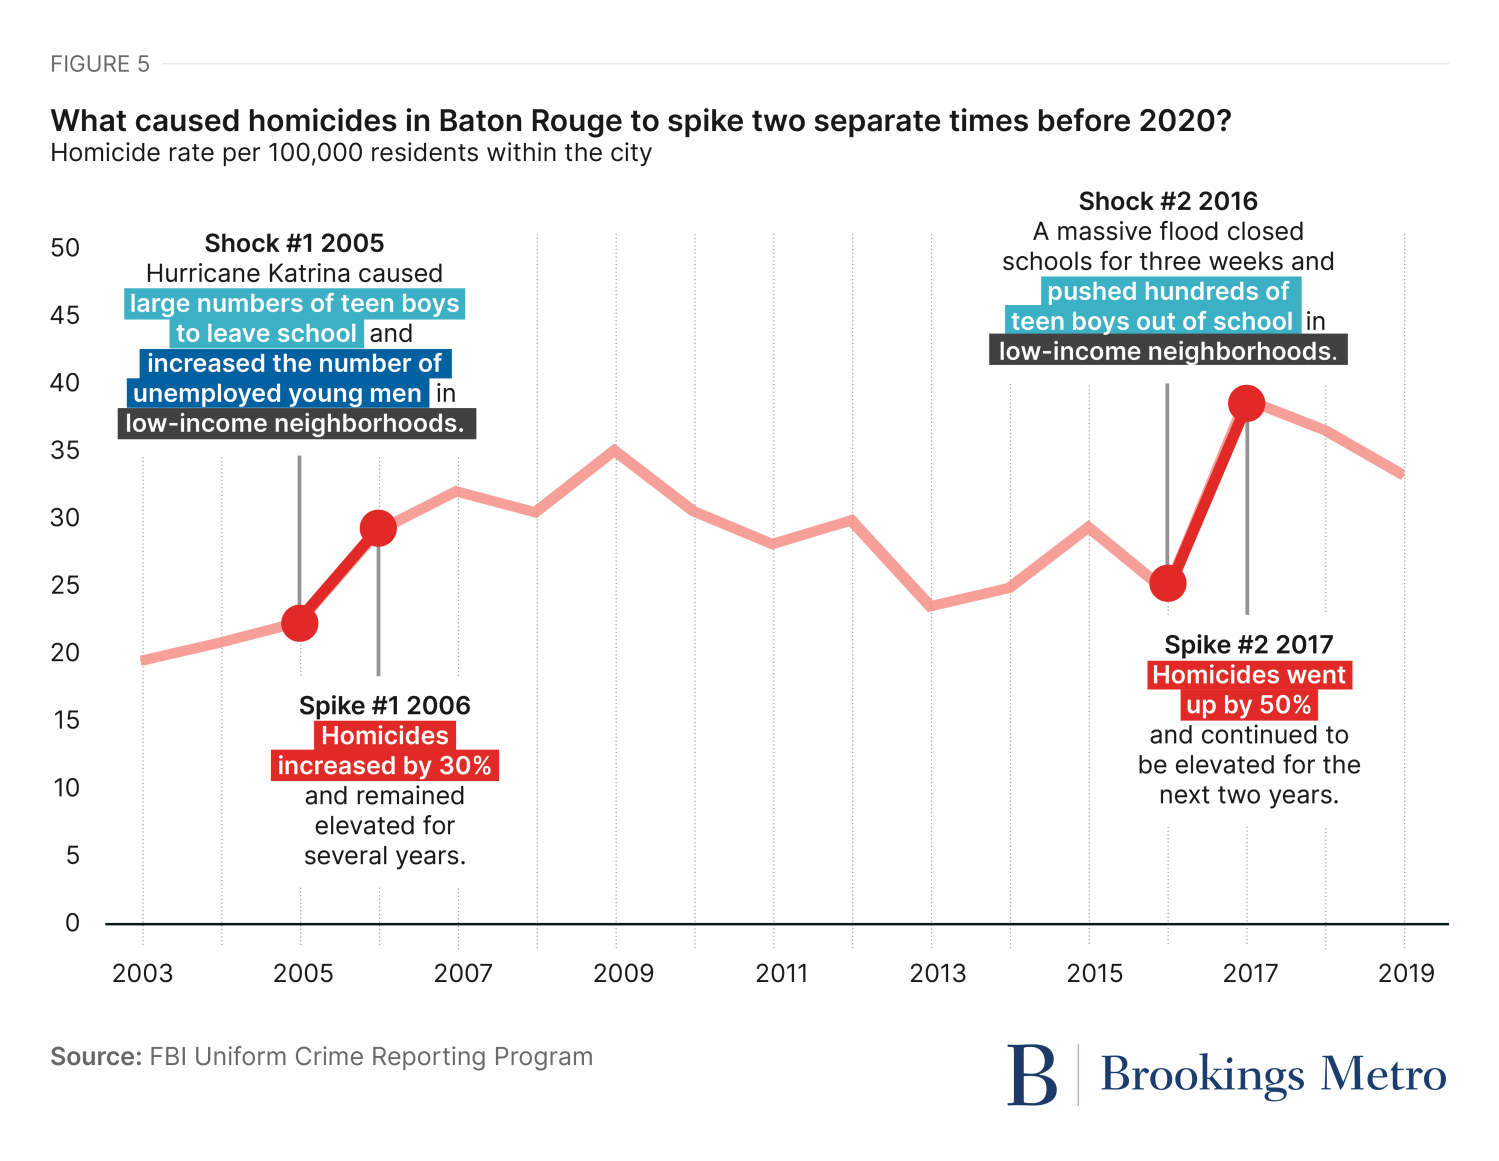
The unique data available in Baton Rouge can also help explain why local violence surged two times before 2020. Just before each spike in homicides, the city experienced a societal “shock” that caused large numbers of teen boys to drop out of school and/or large numbers of young men to become unemployed in low-income neighborhoods.
- Shock #1 (2005). Hurricane Katrina struck south Louisiana in August of 2005, which led to a multi-year increase in local high-school dropouts as Baton Rouge absorbed thousands of displaced students from low-performing schools in New Orleans. Individual records indicate the majority of teen boys who dropped out of school lived in neighborhoods with high rates of poverty. Data also suggest that large numbers of unemployed young men from low-income areas moved to the city after becoming displaced and losing their jobs due to the devastating hurricane.
- Spike #1 (2006). Murders in Baton Rouge increased by 30% the year after Hurricane Katrina, while they remained flat in the rest of the country. It took several years for the local homicide rate to return to levels similar to those seen before the shock in 2005.
- Shock #2 (2016). A massive flood struck Baton Rouge in August of 2016 damaging 50,000 homes in the community and pushing large numbers of teens out of school as thousands of families became homeless and local schools closed for more than three weeks. The high school dropout rate among boys from neighborhoods with concentrated poverty reached its highest recorded point during the 2016–2017 school year and chronic absences also surged.
- Spike #2 (2017). Homicides in Baton Rouge grew by 50% during the year after the flood. Once again, murders remained elevated for several years after the initial shock.
The patterns seen in these events are consistent with the formula suggested by previous research. Each time a shock caused large numbers of teen boys and young men to drop out of school or become unemployed in neighborhoods with concentrated poverty, Baton Rouge experienced a spike in homicides. (See Figure 5.)
These findings in Baton Rouge do not mean that every city where a disaster occurs is doomed to see a subsequent surge in violence. It is possible for communities to experience similar crises and achieve very different outcomes. The city of Houston offers a positive example.
In 2017, Hurricane Harvey damaged more than 120,000 buildings in Houston and the surrounding region. At that time, around one-in-three Houston residents lived in neighborhoods with concentrated poverty, but the city was able to avoid the types of shocks experienced in Baton Rouge. The number of teens who dropped out of local high schools did not substantially increase in the years after Hurricane Harvey and unemployment among young adults in neighborhoods with concentrated poverty also remained flat.6 After Houston was able to keep local teens in school and young adults at work, there was no spike in local murders. The city’s homicide rate decreased the year Harvey struck, and remained flat for the next two years.
What can explain the spike in homicides during 2020?
The surge in murders in 2020 occurred across the country. Almost every large city experienced an increase compared to 2019 and the average urban area registered a jump of almost 30%.
This spike in violence did not start immediately. Murders were slightly elevated in January and February of 2020 and remained consistent in March as the country succumbed to the COVID-19 pandemic.7 Homicides only began to increase rapidly in mid-April when cell phone data show that Americans started leaving home more often as the weather grew warmer and stay-at-home orders eased.
What could have caused murders to surge in 2020 after people started to socialize again? Data show that just before the national spike in homicides began, U.S. cities experienced two shocks similar to those described in Baton Rouge.
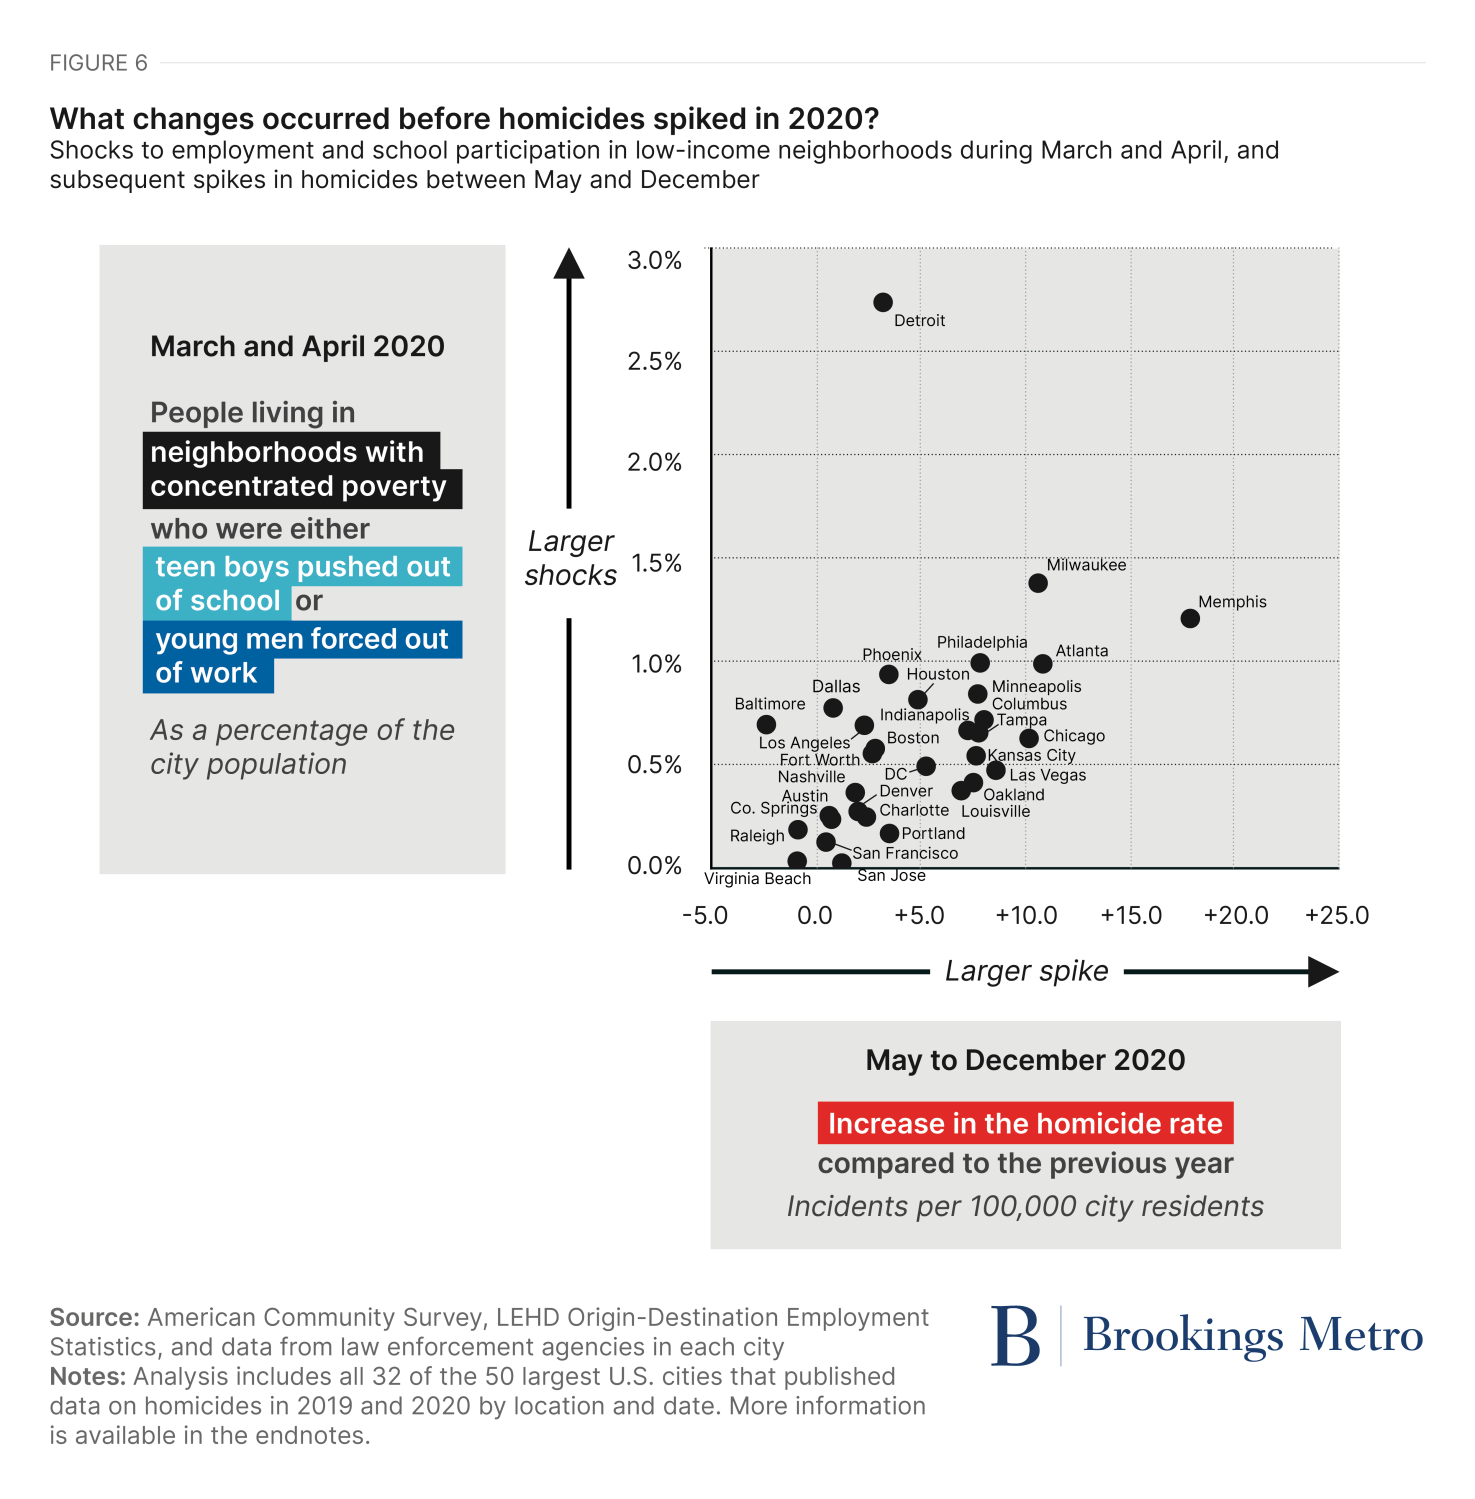
- Large numbers of teen boys in neighborhoods with concentrated poverty were pushed out of school in March of 2020. Every public school in the nation closed during the first month of the pandemic. Students who lived in low-income areas were far more likely to lack internet access at home, which forced many teens to completely leave school when they could not participate in virtual instruction. Even students with internet access often spent weeks out of school, as many districts that serve low-income communities did not offer online classes for several weeks and some took more than a month to begin distributing laptops to students in need. By the time “distance learning” was launched, teachers in these districts reported that around one third to as many as half of local students did not participate in online classes.
- Large numbers of young men in neighborhoods with concentrated poverty also lost their jobs in March and early April of 2020. National unemployment reached the highest levels ever recorded in April of 2020 and young adults in low-income neighborhoods had it worse than almost every other group in the country. Job losses among people under 30 in neighborhoods with concentrated poverty were two times greater than the levels seen in the nation as a whole.8 This is likely due to the residents of these neighborhoods more likely working in restaurants and other service industry sectors that experienced the greatest job losses.
These two developments had a massive impact on neighborhoods with concentrated poverty. By mid-April, young men laid off due to the pandemic and high school boys whose schools were shut down made up around 1 out of every 30 people living in low-income neighborhoods.9
These two shocks were quickly followed by proportional increases in violence. Analyses indicate that the places with the largest spikes in homicides in 2020 tended to have something in common. Cities where more teen boys and young men were pushed out of school and out of work in low-income neighborhoods during March and April, generally had greater increases in murder from May to December.10 (See Figure 6.)
This data can also offer an explanation for the second part of the question posed at the beginning of this report: Why did homicides remain elevated in 2021 and 2022 before falling rapidly in the second half of 2023 and the first nine months of 2024?
The shocks that occurred in low-income neighborhoods during March and April of 2020 lasted for several years. Large numbers of teen boys from these neighborhoods remained out of school as chronic absences skyrocketed across the country. During the 2021–22 academic year, more than half of public schools that serve low-income communities reported “extreme levels of chronic absenteeism,” meaning that more than 30% of their students were chronically absent. This is more than double the rate seen in these schools before the pandemic.
School attendance rates in the United States did not begin to improve until the 2022–23 academic year, but since then they have continued to make progress. By the 2023–24 year, practices to address chronic absenteeism have spread across schools and almost every district reported that they had interventions underway.
Large numbers of young men in low-income areas also remained out of work during 2021, even as national unemployment levels fell. This is likely because employment in restaurants and other hospitality sectors was slower to return than in other industries. Data also show that people with lower levels of educational attainment had much higher levels of unemployment than other U.S. workers during 2021 and 2022.
Things improved significantly in 2023 as employment among the least educated workers once again reached the rate recorded before the pandemic. And in early 2024, the number of people working in the hospitality sector also returned to pre-pandemic levels. Neighborhood-level employment data has not yet been released for 2023 and 2024, but these trends suggest the number of working young men in neighborhoods with concentrated poverty has likely returned to a level much closer to that of 2019.
Taken together, these analyses can help leaders understand why homicides spiked in the United States. The shocks of teen boys and young men being pushed out of school and out of work in low-income neighborhoods occurred across the country just before murders began to rapidly increase, and those baleful educational and economic conditions lasted for the same period of time that homicides remained elevated.
How can civic leaders prevent future spikes in murder and reduce current violence?
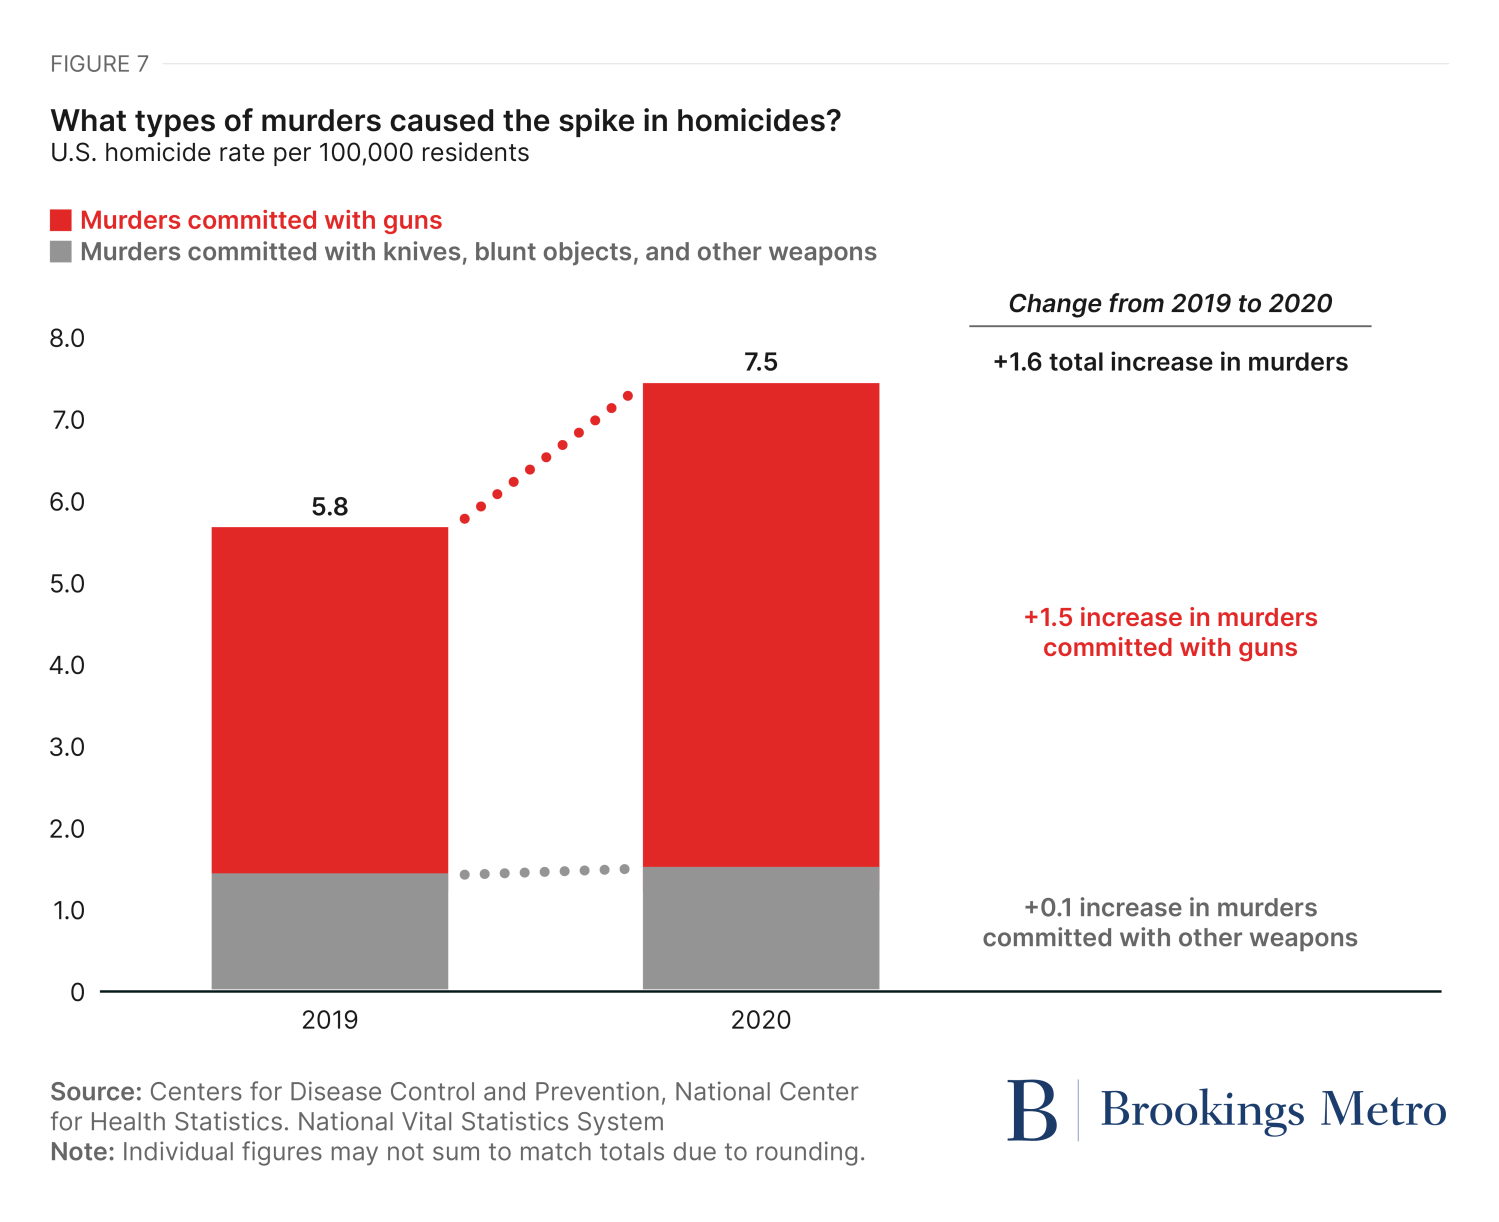
Some authors have noted that the spike in murders during the pandemic was not seen in other wealthy countries, which suggests that it must be connected to something different in the United States. The data from U.S. cities highlight one additional factor that reveals why America’s violence was so unique: Almost all the increases in homicides during 2020 were due to murders committed with guns. (See Figure 7.)
Gun violence has long separated the United States from other nations. Before the pandemic, the likelihood of being killed with a knife or a blunt object was relatively similar for Americans and residents of other countries with high levels of education and wealth. Yet people in the United States were 80 times more likely to be killed with a gun than citizens of countries such as the United Kingdom and Germany. (See Figure 8.)
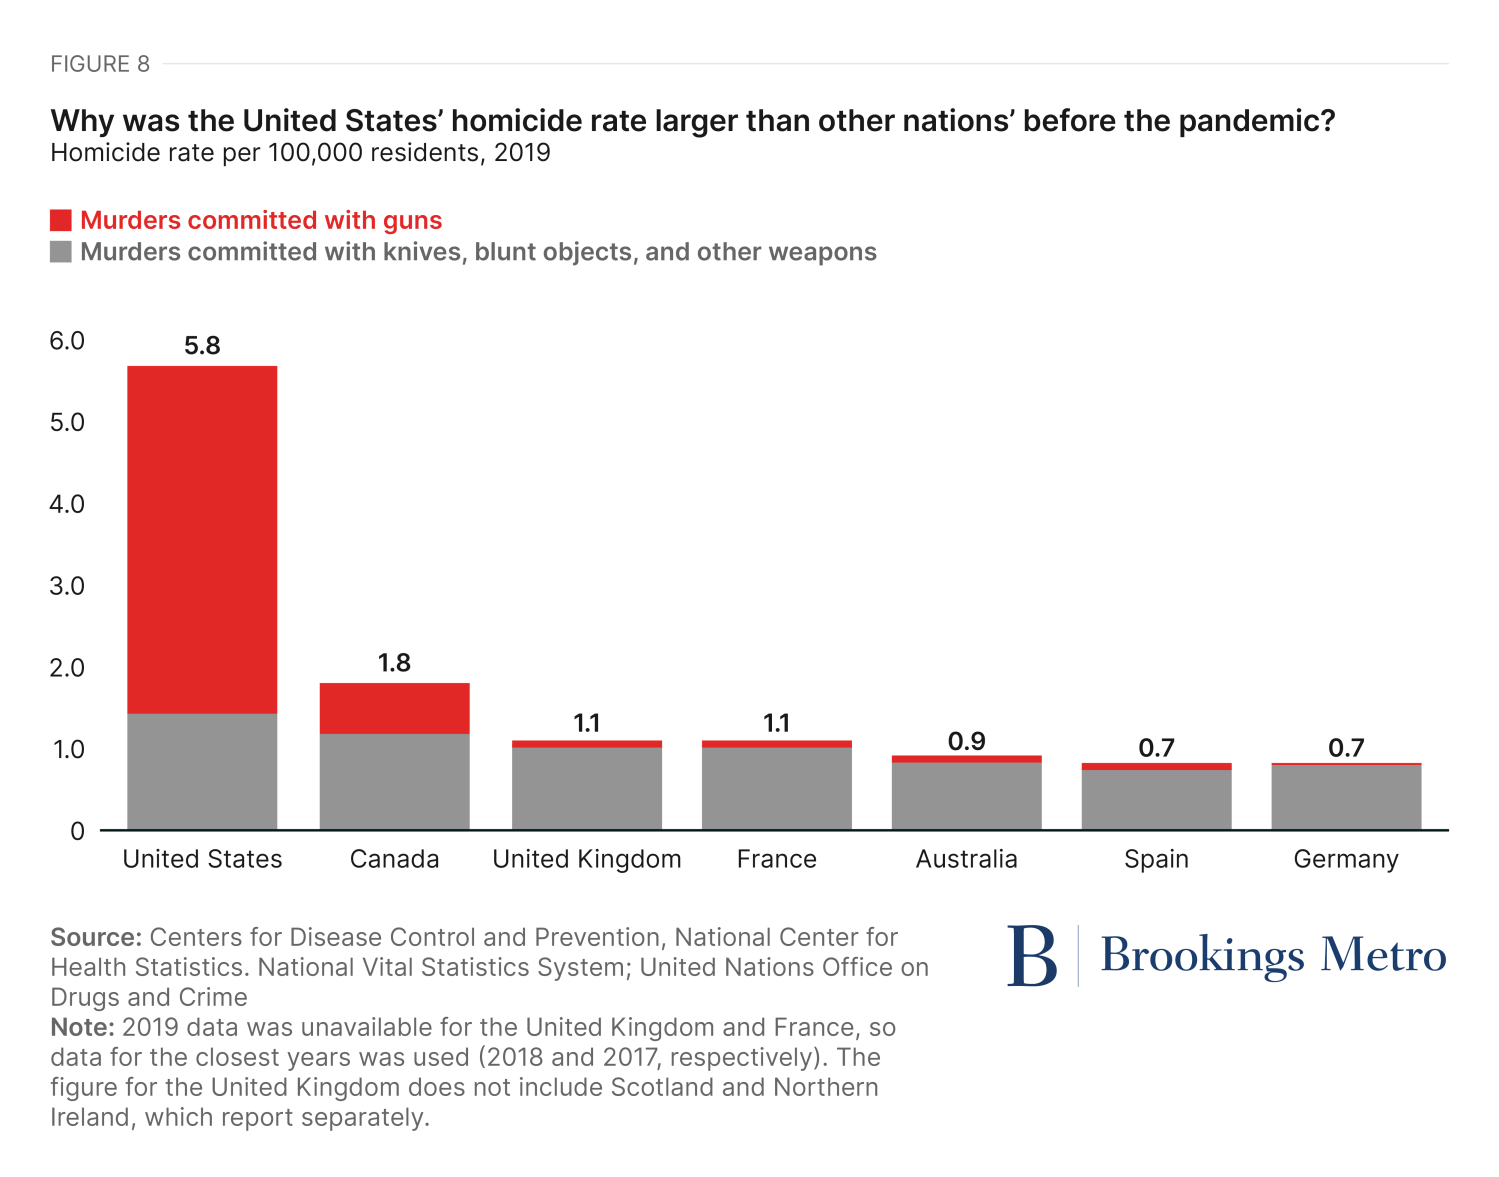
This helps explain why other wealthy nations did not experience a significant rise in murders in 2020. Because the U.S. spike in homicides was due to gun violence, it is not surprising to see that countries that do not struggle with this problem avoided similar increases in murder—particularly during a time when being close enough to stab or physically assault someone carried the chance of being exposed to a deadly virus.
The risk of gun violence is unlikely to disappear from U.S. cities in the near future. The United States has 120 civilian-owned firearms for every 100 residents, far more than any other nation. Domestic production of handguns, the most common weapon used in homicides, has more than doubled since 2010, and the number of guns that are stolen—and become much more likely to be used to commit a crime—has increased dramatically.
These changes indicate there is an urgent need to find ways to prevent the types of shocks experienced during the pandemic in order to reduce the number of young men and boys currently involved in violence. Fortunately, there are clear successes to learn from.
There are a number of strategies that civic leaders currently use to reduce violence. Most tend to fall into the following categories:
- Broad improvement of general conditions and systems that influence crime. This includes programs to increase access to mental healthcare, strengthen community-building organizations, and improve local infrastructure by installing streetlights or removing abandoned buildings.
- Focused improvement of specific practices among police and others involved in criminal justice. Initiatives in this area include directing more resources to solving local murders and reducing incarceration rates for non-violent offences so that those who commit low-level crimes are not placed in prison, which causes them to lose their jobs.
- Focused reengagement of specific people already involved in violence. There is promising research on programs such as READI in Chicago, which identifies young men currently involved in violence or at high risk to do so in the near future and connects them to services such as therapy to help them complete their education and become employed.
We believe leaders should consider a fourth strategy that can complement these efforts: Focused involvement in the prevention of violence among the specific children and teens at greatest risk.
The analyses in this report suggest that cities that help more boys from low-income neighborhoods to graduate high school and find work are less likely to experience high levels of homicide. Evidence from the recent past shows most communities are actually well-prepared to do this.
As the previous section noted, U.S. cities have made significant progress reconnecting teens and young adults to school and work over the past two years. These efforts follow earlier achievements that are relatively unacknowledged given their importance: high school graduation rates and employment among young people both increased significantly in the years before the pandemic. Civic leaders can build on these successes to reduce violence by focusing on three objectives.
- Identify boys at-risk of dropping out and becoming involved in violence before they fall behind their peers. Children who drop out of high school begin to disengage from school many years before they actually leave. There are clear signs in elementary and middle school that indicate a child has a high risk of dropping out, such as higher rates of absences, more frequent behavioral incidents, and lower test scores. Leaders can use signals such as these to identify children from neighborhoods with high rates of poverty who are the likeliest to drop out in the future—and offer them higher levels of support before they disengage so that they remain in school and avoid becoming involved in violence.
- Ensure that the boys at the greatest risk actually receive the support they need. Research shows that tutoring programs, mentoring services, summer jobs initiatives, counseling programs, and other services can help young people graduate high school and avoid becoming involved in violence. These programs cost a few hundred dollars to a few thousand dollars per child, but can help prevent acts of violence that cost communities millions of dollars in expenses, including medical care and incarceration. Alas, the most effective initiatives are not available in every city and the programs that do exist do not always reach the children who need them most.
- Continually measure the results of focused violence-prevention programs to understand which combinations of support are most effective and to maintain program quality. The children at highest risk of engaging in violence probably need more than just a single program. Data can help to identify the local range of programs that best provide young boys with the tools they need to graduate high school, become employed, and avoid involvement in violence. Leaders also need to understand how well these programs are performing to help them adjust and improve over time. Plans to provide this sort of data and transparency are often left out of local efforts and can cause those that are otherwise well designed to be ineffective in the long run.
Conclusion
Federal policies and funding to reduce homicides in U.S. cities may change over the next several years, but local and state leaders will continue to play leading roles in violence prevention across the country, along with partners at other civic institutions. We believe the findings in this report offer a hopeful message to civic leaders across the country. The same programs and strategies that have helped reduce homicides and other forms of violence during the past several years and, in some cases, prior to the pandemic in 2020, can also be used to prevent future spikes in murder.
Authors


-
Acknowledgements and disclosures
We would like to thank the following individuals who provided valuable feedback on our research and writing. At Brookings Metro, we would like to offer special thanks to Hanna Love, who provided encouragement, valued criticism, and inspired editing, as well as Tracy Hadden Loh, who first suggested authoring this work. We would also like to thank Bethany Krupicka, who provided detailed fact-checking as well as Ed Paisley for editing, and others including Carie Muscatello, Erin Raftery, and Phoebe Copeland.
-
Footnotes
- No studies have demonstrated a causal relationship between society’s general reaction to the murder of George Floyd and increases in murder. Those that suggest a link in the timing of Floyd’s death and increases in homicides during the summer of 2020 are complicated by a number of factors they cannot explain. For example, as Figure 1 shows, the U.S. homicide rate was already on track to reach a peak in 2020 that was far above that seen the previous year—even before Floyd was murdered. Moreover, no clear mechanism has been identified to explain why this particular incident of police brutality is the only one to cause a nationwide spike in murders. The United States has experienced numerous examples of incidents similar to Floyd’s murder captured on video in the years before and after 2020. Many of these, such as the death of Eric Garner, led to large protests in cities across the country. Yet there has only been one spike in homicides found across U.S. cities. Evidence that a police “pull back” occurred also appears to be mixed. In Minneapolis, for example, use of force by police did not seem to decline during 2020 and 2021. Yet the number of arrests decreased. The most cited study supporting a causal relationship between reduced policing and increases in crime during 2020 was published earlier this year. It initially reported that decreases in pedestrian stops, vehicle stops, and drug-related arrests by police led to increases in violent crime during the pandemic, but noted this effect was only found in wealthier neighborhoods. Therefore, police behavior could not fully explain the spike in crime since the uptick in violence in 2020 disproportionately occurred in poor neighborhoods. In addition, the authors recently updated their analyses. They now report that decreases in vehicle stops and drug-related arrests by police actually had no discernible effect on violence during the pandemic. The updated effect of the decreases seen in pedestrian stops is also much smaller.
- In 2023, the federal poverty line was equal to around $30,000 for a family of four, or $14,500 for a person living alone.
- Analysis of data from the 2022 American Community Survey.
- Analysis of data from the 2022 American Community Survey and geolocated homicide incidents featured in Figure 1.
- Analysis of administrative records from the East Baton Rouge District Attorney’s Office and the East Baton Rouge Parish School System covering individuals convicted of homicide from 2013 to 2022.
- Analysis of data from 2016 and 2017 LEHD Origin-Destination Employment Statistics. Specific data on teen dropouts can be found in Figure 3. HISD Annual Dropout Rates by Student Group with Exclusions, 2013– 2022 within this report.
- Analyses of weekly homicide data published in CDC Wonder.
- Analysis of data from 2020 LEHD Origin-Destination Employment Statistics.
- Analysis of data from 2020 LEHD Origin-Destination Employment Statistics and the 2020 American Community Survey.
- Neighborhoods where concentrated poverty is persistent are defined as those with concentrated poverty in at least 5 of the past 10 years as measured by the American Community Survey at the tract level. The number of young men laid off from work is estimated as half the change in employment among workers under 30 years old measured as of April 1, 2020 compared to the previous year within each neighborhood since data by worker age and gender are not available. The number of teen boys forced out of school is based on the count of males in each neighborhood who are enrolled in 9th grade to 12th grade at public schools. It is important to note that there are obvious limitations to these analyses. Data on the locations of local homicides are only available in around 30 large cities and counties, for example. Information on employment also is reported for all young adults, rather than just young men.
The Brookings Institution is committed to quality, independence, and impact.
We are supported by a diverse array of funders. In line with our values and policies, each Brookings publication represents the sole views of its author(s).