
How many homes does the country need to close its housing shortage? The answer depends on how we count households. Housing supply projections and affordability statistics translate people into households—and households into housing demand. But that framework simplifies complex living arrangements and, in doing so, can mask who is actually living under housing strain.
Estimates of housing demand begin with household formation. Researchers project how many households are expected to exist based on headship rates, defined as the share of adults designated as the householder in survey data. These projections are used to assess whether housing supply is keeping pace with housing demand.
The same designation shapes how we analyze affordability. When we assess which groups are most burdened by high housing costs, we typically rely on characteristics of the designated head. In other words, one person stands in for the household.
This makes sense if the survey’s designated head broadly reflects the adults living in the home. But nearly half of adults are not household heads, and non-head adults often differ systematically from the head. Describing households based on a single reference person can therefore mask important differences within multi-adult households.
In periods of elevated housing costs, this carries real consequences. Who we count shapes how we measure housing supply, how we interpret who is most burdened, and how we target policies meant to provide relief from high housing costs.
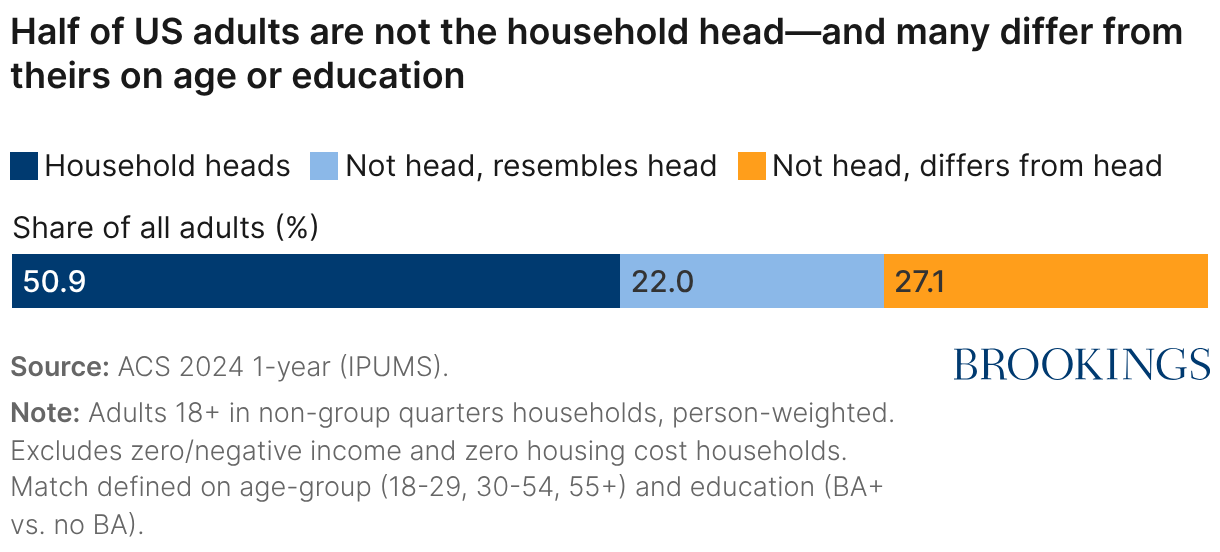
Nearly half of adults are not household heads
In the 2024 American Community Survey (ACS), only 50.9% of adults age 18 and over are household heads. In other words, about half of adults are represented in housing statistics only through the profile of someone else.
Figure 1 illustrates this basic tension. It compares household heads to other adults living in the same household along two dimensions central to housing analysis: age, which reflects life-cycle stage, and education, which relates to earnings capacity. Along both dimensions, non-head adults often look meaningfully different from the designated head.
This limitation is not accidental. Household surveys typically designate a single reference individual in each household for defining family relationships. In the ACS, that individual is the “householder,” typically the owner or leaseholder of the home. Earlier Census surveys used the term “head of household,” often reflecting gendered norms. The terminology has changed, but the structure has not: One individual represents the entire household.
Within multi-adult households, the head is not the whole story
Many widely cited housing statistics describe affordability, tenure, and demographic trends in housing using characteristics of the “householder.” But roughly two-thirds of households in the 2024 ACS include more than one adult. In those households, adults may differ along dimensions central to housing analysis, making reliance on the householder more consequential.
Figure 2 illustrates this divergence using age and education—two characteristics commonly used to describe housing demand and affordability. Age alignment within multi-adult households varies by the age of the head. When the head is a young adult (18 – 29), most other adults are also 18 – 29. But alignment weakens at older ages, with nearly 40% of other adults in 30-54 headed households falling into a different age group and 43.5% of non-head adults in 55+ headed households being younger than 55.


Differences in educational attainment are even more pronounced. When the head has less than a high school diploma, a majority of non-head adults are more educated. At the other end of the spectrum, when the head has a bachelor’s degree or more, nearly half of other adults have less education. Even among households headed by someone with a high school diploma, roughly half of non-head adults differ in educational attainment.
In other words, describing households by the characteristics of the head compresses meaningful demographic differences within the home. When affordability measures rely on head characteristics, they inherit that simplification.
Accounting for all adults changes who appears cost-burdened
This divergence carries over into affordability statistics. Housing cost burden is measured at the household level, with households classified as burdened if housing costs exceed 30% of income and severely burdened if costs exceed 50%. Figure 3 shows two age distributions within the same cost-burdened households: one for those above the 30% threshold and one for those above the 50% threshold.


The difference is meaningful and appears at both burden thresholds. Among households spending more than 30% of their income on housing, 14.5% of heads are young adults, but 21.8% of adults living in those same households are young adults. At the same time, prime-aged and older adults make up a larger share of heads than of all adults in those households. A similar gap appears among the severely burdened.
Framing affordability by the age of the head changes the demographic picture of who is burdened. Counting all adults reveals that younger adults represent a larger share of adults living under high housing costs than head-based statistics indicate. The number of burdened households does not change, but who appears most exposed does—shaping how housing pressures facing younger adults are understood in research and policy decisions.
Measurement choices shape housing narratives
Headship is foundational to how we measure housing demand. The headship rate translates the population into households, and households into required housing units. But headship is not fixed. Living arrangements reflect individual preferences and respond to housing costs. When rents rise or home prices outpace incomes, adults double up, delay forming independent households, or remain in shared housing longer. In those scenarios, a lower headship rate may reflect constraint rather than reduced demand.
Using head characteristics as a proxy for household composition can mischaracterize who is living under high housing costs. When assessing affordability, researchers should consider not only who heads a household, but who lives within it.
Authors


Related Content


The Brookings Institution is committed to quality, independence, and impact.
We are supported by a diverse array of funders. In line with our values and policies, each Brookings publication represents the sole views of its author(s).