What is the difference between discretionary spending and mandatory spending?
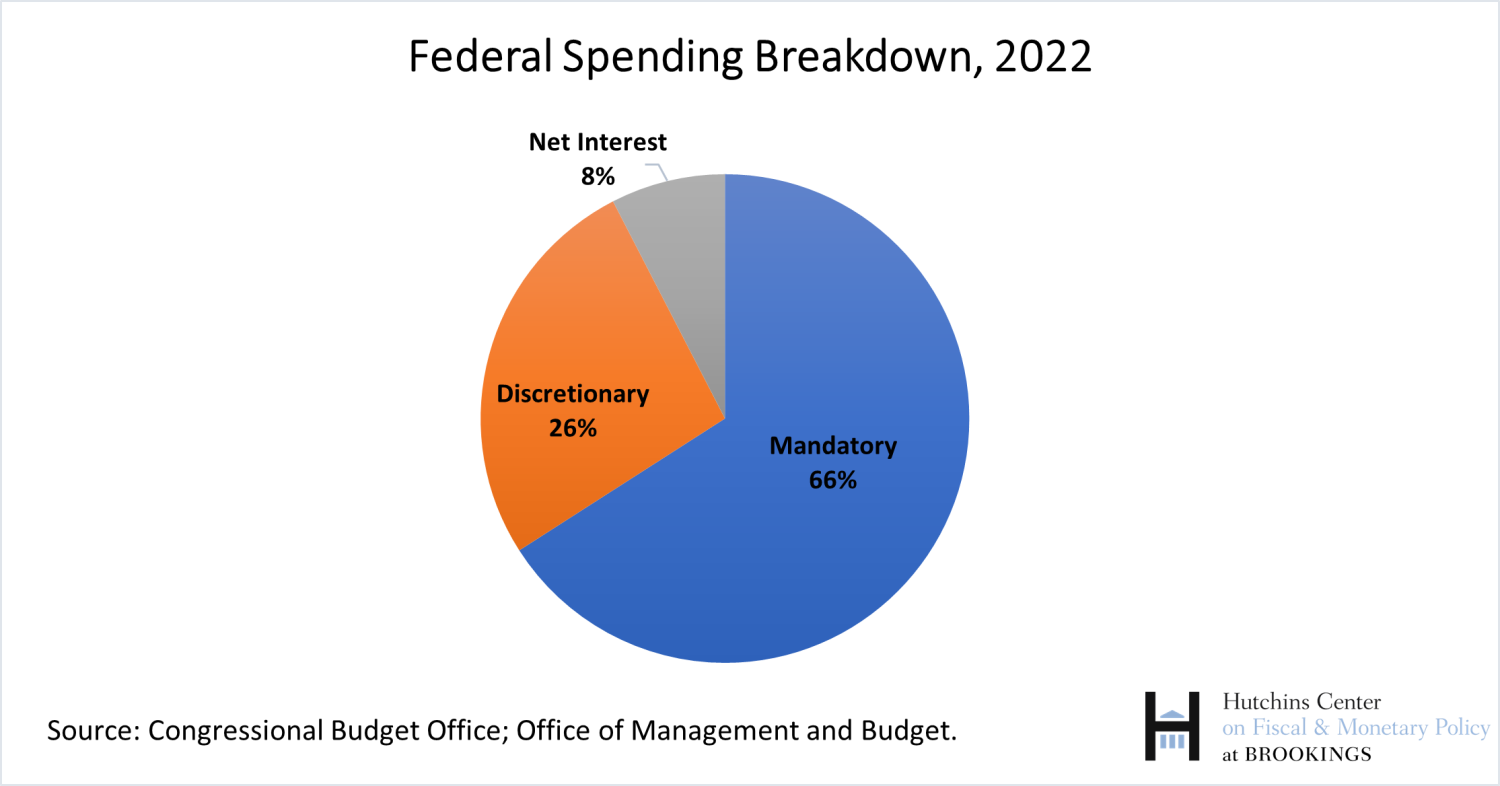
Discretionary spending is federal spending that must be appropriated by Congress every year. In 2022, it represented a little over a quarter of all federal spending and included everything from building roads to paying salaries of federal workers. In contrast, mandatory spending—spending on programs like Social Security, Medicare for the elderly and disabled, and Medicaid for the poor—is not approved by Congress each year. Instead, the government must provide program benefits to anyone who qualifies for them. Congress created these programs and can change them, but it doesn’t approve spending for them; they are on autopilot.
Mandatory spending, sometimes called entitlement spending, consists of about two-thirds of all federal spending. The remaining slice of federal spending is interest on the federal debt, about 8 percent of all federal spending in 2022.
What goes into the discretionary spending bucket?
Much of discretionary spending—about 45 percent in recent years—goes to salaries and benefits for government employees, both military and civilian. About 15 percent goes to grants to state and local governments. Most of the remainder goes to purchases of goods and services from the private sector.
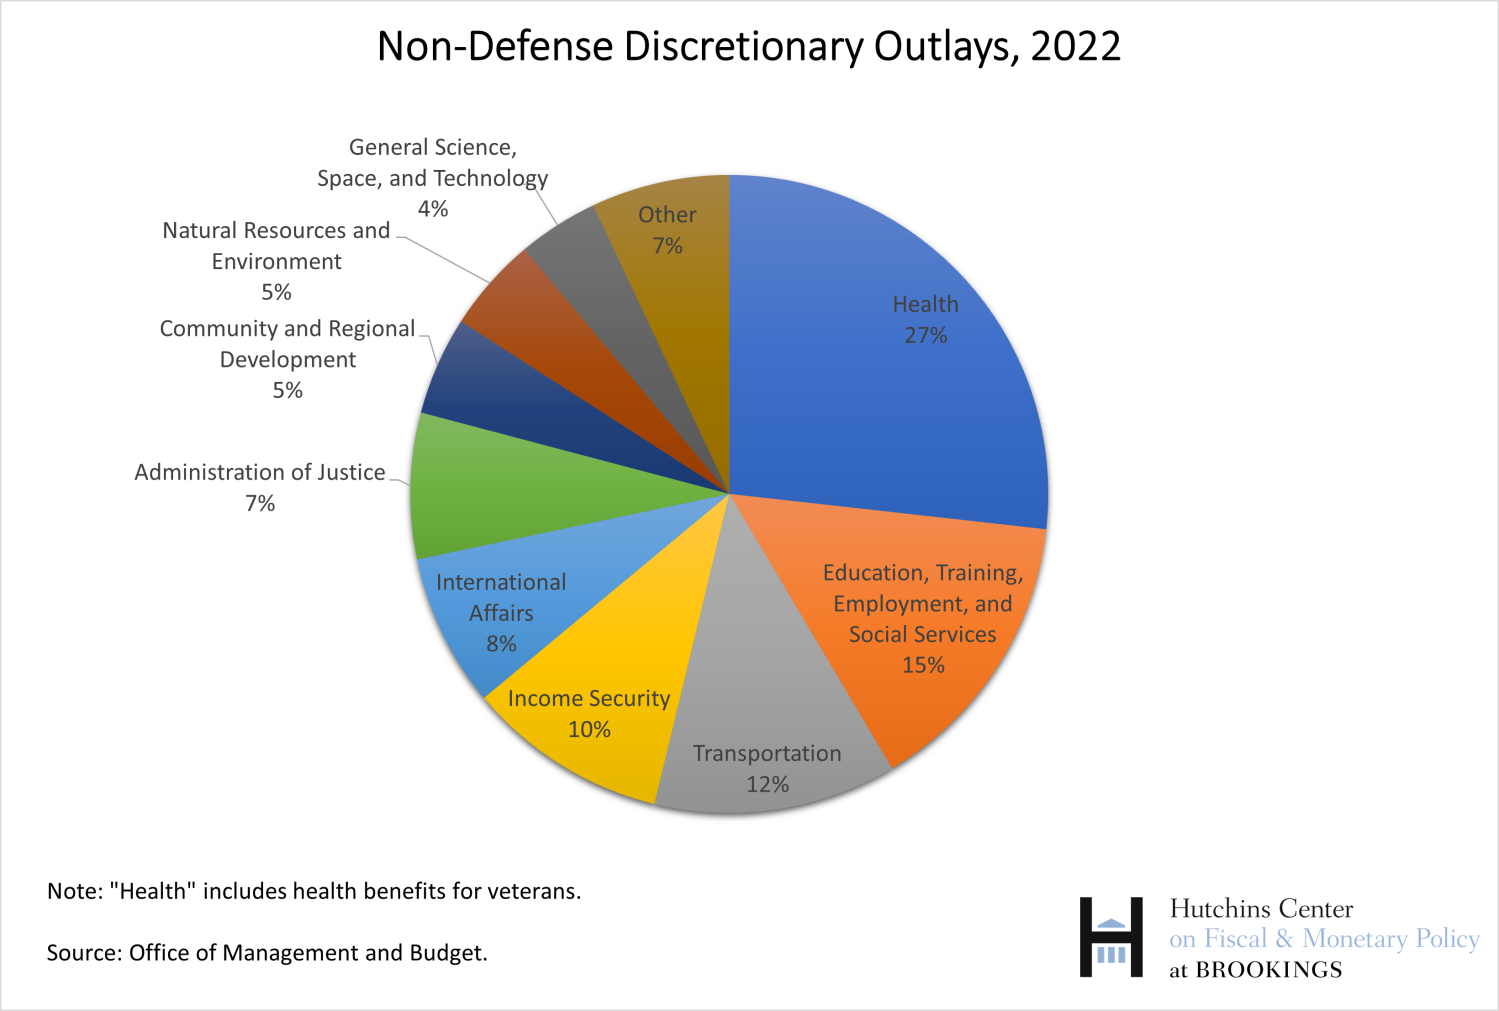
Spending can also be decomposed by function. In 2022, about $750 billion, or 45 percent, of discretionary outlays went to defense, and $910 billion, or 55 percent, went to non-defense—a broad category that includes certain health spending, (including veterans’ health, the National Institutes of Health, and public health), education and training (including Pell grants for low-income college students and grants for K-12 schools with large numbers of low-income students), and transportation (including highways, bridges, and airports). Most of the spending in the Infrastructure and Jobs Act of 2021 (sometimes called the Bipartisan Infrastructure Law) and the CHIPS and Science Act of 2022 is discretionary spending.
How has discretionary spending changed over time?
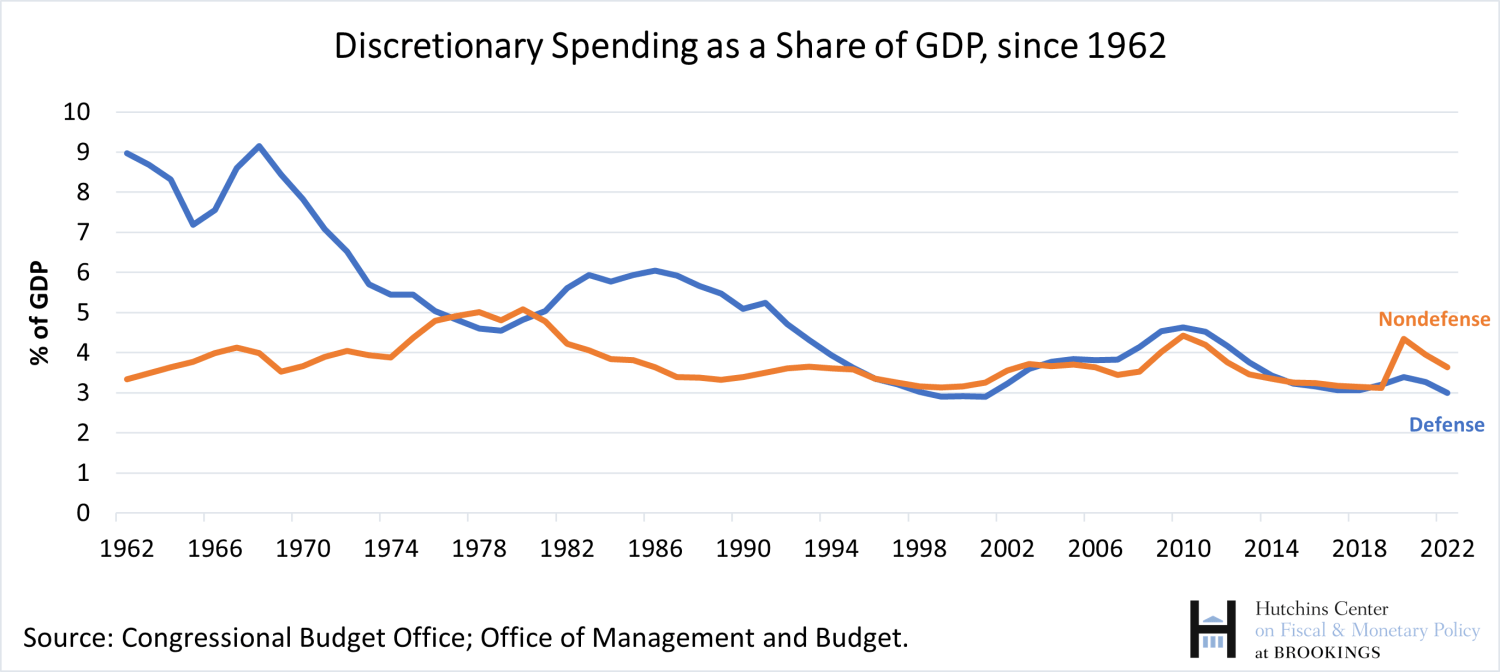
In 1973, discretionary spending amounted to 9.6 percent of GDP, with about 60 percent of that for defense. Today, discretionary spending is 6.6 percent of GDP. A little under half of that goes to defense.
Defense spending, of course, rises with wars and with concerns about national security. Defense spending was 9.2 percent of GDP in 1968 near the height of the Vietnam War, reached a low of 2.9 percent in 1999 after the end of the Cold War, and climbed to 4.6 percent of GDP by 2010, during the wars in Iraq and Afghanistan. Defense spending has generally declined as a share of GDP since then, reaching 3 percent in 2022.
In contrast to the significant declines in defense spending since the 1960s, non-defense discretionary spending has hovered between 3 and 4 percent of GDP in most years, with a few exceptions. It was, for instance, a bit above 4 percent of GDP during the Great Recession and the pandemic. Non-defense spending in 2022 was 3.6 percent of GDP, a bit below its average level since 1962.
What was the impact of the Fiscal Responsibility Act of 2023 on discretionary spending?
The Fiscal Responsibility Act, which suspended the legal limit on federal borrowing until January 2025, set separate caps on defense and non-defense discretionary spending for two years. For details, see this.
How does the Congressional Budget Office (CBO) project discretionary spending?
When the Congressional Budget Office projects future budget deficits, it must make an assumption about the trajectory of discretionary spending because it has no way of knowing what Congress will do in the future. For any program for which Congress has not appropriated a specific sum for future years, the Deficit Control Act of 1985 requires CBO to assume that appropriations grow with inflation. Thus, for its ten-year projections, CBO takes the latest year’s total discretionary spending, takes account of any legislated caps on discretionary spending (such as the ones set in the Fiscal Responsibility Act), and assumes spending increases with inflation thereafter. Because GDP typically grows faster than inflation, this means that CBO generally projects that discretionary spending as a share of GDP will fall over its ten-year projection period. Beyond ten years, CBO assumes that discretionary spending grows at the same rate as the overall economy; in other words, it assumes it is stable as a percent of GDP.
Related Content
Authors


-
Acknowledgements and disclosures
The Brookings Institution is financed through the support of a diverse array of foundations, corporations, governments, individuals, as well as an endowment. A list of donors can be found in our annual reports published online here. The findings, interpretations, and conclusions in this report are solely those of its author(s) and are not influenced by any donation.
The Brookings Institution is committed to quality, independence, and impact.
We are supported by a diverse array of funders. In line with our values and policies, each Brookings publication represents the sole views of its author(s).


Commentary
What is discretionary spending in the federal budget?
July 11, 2023