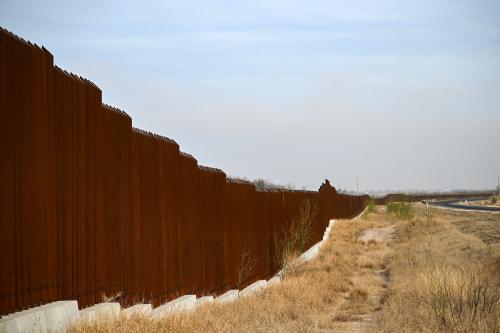
While mainstream public opinion of the Trump administration has engulfed the media, the views of foreign-born immigrants—a key influential bloc that shifted to the right, helping Republicans clinch the 2024 presidential race—has attracted much less of the spotlight. Trump’s sweeping immigration crackdown amid mass deportation raids, immigration protests, and a slew of judicial rulings on the birthright citizenship ban, have thrust immigrant communities squarely into the public eye. In this article, I analyze how foreign-born or first-generation immigrants (both with and without U.S. citizenship) view the administration’s policies during its initial months, how those views have evolved since the past election, and what this could portend, electorally, for future election cycles among immigrant communities.
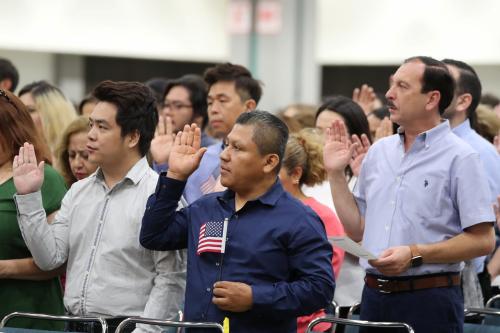
November 2024 saw many naturalized citizen immigrant voters1, a traditionally Democratic-leaning bloc, rally around Trump’s campaign pledge to tame spiraling inflation and immigration. However, several months into his second term, overall approval of the president’s policy agenda has dipped, whereas some specific policies, such as immigration, remain relatively less affected.
During the prior election, according to Pew Research’s post-election findings, which confirm prior analysis conducted by Brookings, Democrats’ share of the total foreign-born vote steadily decreased during that period, even more so than the overall U.S. electorate, and was consistent across racial and ethnic lines. Between 2020 and 2024, the Democratic share shrunk from roughly 59% to 51%, whereas the Republican share increased from around 38% to 47%, a nearly 17+ point swing in favor of the Grand Old Party and a near even split between the two parties in 2024.
Trump flipped many of the key battleground states (including Georgia, Nevada, Arizona, and Pennsylvania) in 2024 where immigrant voters represent a sizable portion of the total U.S. electorate: 14% of all eligible voters in Nevada, 9% in Arizona, 7% in Georgia, and 5% in Pennsylvania are foreign-born. Additionally, based on pre- and post-election data from the American National Election Studies, roughly 43% of immigrants who voted in the 2024 election believed the Republican Party would do a better job of handling immigration: a positive nine-point spread over Democrats and a staggering reversal from the 2020 election where Democrats had a 25+ point edge over Republicans.
And several months into the Trump presidency, these policy issues continue to be important to voters today. According to a national survey2 of immigrant voters (fielded from April 22 to April 27, 2025), the top three issue area priorities ranked by them is still consistent with what drove them to the polls: inflation/prices (27.4%), jobs/economy (13%), immigration (9.2%), and health care (7.9%), respectively.
Still, similar to the general public, immigrant assessments of the president’s overall performance have slipped into negative territory across several key areas: 47.8% disapprove of the president’s overall performance while 45.1% approve; 50.4% believe the country is on the wrong track versus 42.1% who believe it is on the right track. Further, regarding inflation/prices and the economy, there is roughly a negative 10-point spread between those who disapprove and those who approve, respectively, for each area.
Nevertheless, the president’s immigration agenda garners the most support with a slight majority of immigrants in support of it (50.5% to 41.1%). This was also true of the broader public until more recently in August—where there is now a roughly negative 5.9 point margin of disapproval across most major polls. What’s more, according to a recent Gallup poll completed in June, almost 80% of Americans now view immigration positively—the highest share on record—and only 30% of Americans want immigration reduced, a sharp decline from a year earlier in 2024 when the share was 55% of Americans. While this decline was spread across all parties, the shift was most prominent among Republicans: 88% of Republicans wanted immigration reduced in 2024 compared to 48% of Republicans today—a sizeable 40-point turnaround.
Additionally, across most of the key issue area priorities, there appears to be growing signs of a narrowing margin between foreign-born swing voters or switchers—the coalition who switched from voting for Biden in 2020 to Trump in 2024—who approve and disapprove of the administration’s policies. Although, according to post-election data from Pew Research, swing voters were not the primary contributors to Trump’s gains among immigrants compared to the new, low propensity voters that were (roughly 22% of foreign–born 2024 voters were new voters with Trump netting roughly 57% of them), it is likely that both groups were motivated by similar cost of living and immigration-related concerns. Further, according to national-level perceptions after the first 100 days, only 46.8% of Biden-Trump foreign-born switchers say the country is better off, while 35.5% say it is worse off—a gap of just over 10 points
This pattern appears, generally, to be most pronounced along economic affordability, exhibiting only narrow to moderate majority levels of approval. A slim majority of overall Biden-Trump switchers believe their economic situation has improved after 100 days (33.4% to 32.1%); 35.9% are more confident in the president’s ability to handle inflation and prices, compared with 34.6% who are less confident; on jobs and the economy, 39% express greater confidence, versus 24.2% who express less. Conversely, immigration policy stands as an outlier—roughly 61% of Biden-Trump immigrant switchers, overall, are more confident in the president’s immigration policy after 100 days compared to about 17% who are less confident, a whopping 43.7+ point margin.
Remarkably, in stark contrast to public support for economic concerns, which have sunk since the election, public support for immigration appears to have instead relatively endured since last fall. The fact that the U.S. experienced the highest influx of immigration on record between 2021 and 2023, during the Biden administration, with a majority of those immigrants lacking legal status, may partly explain why.
Even so, there are important caveats to consider. First, while a majority of immigrant voters are in support of the president’s immigration policy, it is a fairly slim majority, and these sentiments, taken from the most recent publicly available data, were captured before subsequent developments such as immigration protests, intense deportation raids, travel bans, and other occurrences. The American public has since formed a more negative attitude about the administration’s handling of immigration, suggesting there is still room for immigrant public attitudes to follow suit as well.
Second, when the nuances of immigration policy are unpacked to show which specific parts elicit the most appeal, it’s evident that it’s context-specific, and there is seemingly a disconnect between policy goals and implementation. The administration’s overall goals appear popular, but support drops sharply for its specific tactics and implementation—especially on deportations—even among Trump supporters. When distinguishing between the two main immigration issues—border security and deportations—border security appears to garner more support, while deportation policies and their ties to the legal system receive far less.
While a very slight majority approve of deporting all undocumented immigrants, a one-point difference, the data suggests that this is narrower in scope and pertains only to more recent arrivals or those convicted of violent crimes. A plurality of both immigrant switchers and immigrant voters overall—roughly 60% to 75% in each group—largely disapprove of deporting undocumented immigrants who are employed, have strong family ties (such as being married to a U.S. citizen or parenting a U.S.-born child), or have lived in the country for a decade or more, with family separation drawing the strongest disapproval. Some of the margins are even wider in key swing states that flipped from blue to red, as in Nevada and Georgia. Similarly, a clear majority of immigrant voters oppose deporting non-U.S. citizens with legal status, such as student or work visa holders, as well as international students participating in protests.
What’s more, regarding other aspects of immigration policy such as enforcement in certain areas and perceived lack of adherence to court orders, immigrant public opinion largely disfavors the administration’s approach. A majority do not approve of deporting immigrants without proper due process or a judge’s order, deporting undocumented migrants to other countries—such as to the El Salvador prison, publicized by the high profile case of the mistakenly deported Kilmar Abrego Garcia—or conducting enforcement activities in sensitive locations. Further, the bulk of both Biden-Trump immigrant switchers and overall immigrant voters, respectively, believe the administration should obey court orders regarding deportations and believe mistakes/errors are being made in who is being deported.
The continued flurry of immigration policy directives have helped to fuel this public backlash and have also led to widespread economic and social upheaval for many immigrant families. Mass immigration raids have rippled across shopping centers, farms, hotels, and workplaces—not only gripping many immigrants in a web of fear, chaos, and deep social unrest, but also shattering longstanding economic and socially vibrant communities.
International students with minor infractions or without any prior criminal record have faced abrupt visa cancellations and deportations, leaving their educational hopes and aspirations stranded overseas. What’s more, not only have policies to strip naturalized citizens of their citizenship due to certain crimes been enacted but U.S. citizens and other legal residents have found themselves swept up in deportation and detention efforts. Additionally, since Trump took office, only a minority (roughly 40%) of illegal immigrants being detained by ICE have been found to have a criminal record and only about 8% have a violent criminal conviction.
The combination of these developments may be fueling views that there is a growing gap between the administration’s intended policy objectives and actual implementation. Most of the shift in immigrant voter support was driven by Trump’s policy campaign mandate: mostly to ease economic burdens and immigration levels—largely centered on border security and deporting illegal immigrants convicted of violent crimes.
However, on both accounts, immigrant public sentiment reveals that they believe this is not being adequately tackled, at least in the initial months, and that the broader scope of deportations of both undocumented and legal immigrants appears to be a departure from what he campaigned on. Still, even amidst the dampening of public support for immigration, the administration has sought to intensify its policy arsenal—injecting an additional $170 billion into immigration enforcement and $75 billion into ICE alone—making it the most funded law enforcement agency in the U.S. federal government.
Among all immigrants—not just those who voted—disapproval of the administration’s policies is higher across naturalized U.S. citizens, immigrants with legal status (permanent residents or work/student visa holders), and undocumented immigrants, with notable differences by race and ideology.
According to a recent national survey from the Kaiser Family Foundation, fielded from March 6 to April 13, 2025, the sentiment of immigrant voters is largely reflective of the broader immigrant community. However, among non-U.S. citizens, there are much higher levels of dissatisfaction, particularly on immigration-related issues. Overall, with respect to immigration, concerns for either themselves or a family member being detained/deported have almost doubled from 2023 to 2025 for nearly all immigrant groups. Roughly four in 10 immigrants overall, and six in 10 immigrants with legal status, express concern about detentions or deportations.
Among Latinos, these concerns have risen from 41% to 59%; and for Asians, from 14% to 19%. Fellow Brookings scholar Gabriel R. Sanchez and a team of researchers also arrive at similar conclusions in their recently released survey on Latino immigrant sentiment toward deportation policy. What’s more, AAPI data show that Asian Americans—who are the only racial group with a foreign-born majority at 65%—tend to oppose the administration’s deportation policies. Only 43% support deporting all undocumented immigrants, while roughly 80% support deporting those charged with violent crimes.
While Asians and Latinos represent the bulk of the immigrant pool (roughly two-thirds), there is limited statistically representative data of the early public views of other racial groups (i.e. Blacks, whites etc.). Further, on immigration policy, 54% of naturalized citizens express disapproval—but when all immigrant groups are considered, regardless of legal status, that share rises to 63%. This is largely driven by non-U.S. citizen immigrants3 who exhibit higher dissatisfaction numbers around immigration-related issues.
Nonetheless, as with the broader foreign-born electorate, breaking down specific immigration policies shows deportations are widely unpopular, while a slim majority of all immigrants support the administration’s border enforcement efforts (54%) and the deployment of additional troops to the border (53%).
Conversely, only 21% of all immigrants supported the proposed birthright citizenship ban, which would limit automatic citizenship to children with at least one U.S. citizen or permanent resident parent. While the Supreme Court has not ruled directly on its constitutionality, it has restricted judges from issuing universal or nationwide injunctions against Trump’s executive orders. As a result, until the Court resolved the policy’s legality, some second-generation Americans could have faced a patchwork system in which their citizenship was recognized in some states but not in others.
However, beyond universal injunctions, the Supreme Court’s ruling left room for narrower injunctions or other legal avenues—such as class-action lawsuits—to challenge the birthright citizenship ban. Several recent lower court decisions have done so, finding the ban unconstitutional and either granting nationwide protection for U.S.-born children through class actions or upholding prior universal injunctions, arguing these do not constitute judicial overreach. Anticipating the issue’s return to the Supreme Court, the administration has released an implementation plan directing agencies like Homeland Security and the Social Security Administration to require additional parental documentation to verify a child’s eligibility for U.S. citizenship. Until the Court rules, the ultimate impact on immigrant communities remains uncertain.
Still, while immigrant public opinion is less supportive of the president’s policies overall, it is sharply divided along party lines. About 64% of all immigrants disapprove of his performance, yet 75% of Republican immigrants approve compared with just 13% of Democratic immigrants. Likewise, 81% of Republican immigrants back his immigration policy, versus 19% of Democratic immigrants. Even so, only a slim majority of Republican/conservative immigrants support banning birthright citizenship (52%), and an even smaller share back the administration’s approach to curbing inflation (59%).
In sum, support for the administration’s policy agenda has waned—not only among the loose coalition of immigrant voters who helped secure victories in key battleground states, but also across the broader immigrant population. Public sentiment indicates that expectations for easing everyday economic hardship remain unmet, and that while border security enjoys broad backing, the administration’s broader deportation efforts and judicial tactics have been uneven and diverge from its original campaign mandate. While these findings draw from some of the most recent publicly available data on immigrant views, they were captured before the administration’s latest policy actions, and forthcoming data could paint a strikingly different picture going forward.
Overall, the socio-political views of foreign-born immigrants largely align with those of the broader American public, and—as in the last presidential election, when immigration and inflation were dominant issues—their electoral influence could again prove pivotal in future races. This underscores the need for elected officials and policymakers to advance policies that address the pressing socioeconomic needs and lived realities of a broad and diverse immigrant population.
Related Content

Author

-
Acknowledgements and disclosures
The author would like to thank Dr. Rashawn Ray, Carly Bennett, and Zach Affeldt for insightful and valuable feedback and editing assistance.
-
Footnotes
- Naturalized citizens are permanent residents in the U.S., born outside of the country, who have acquired U.S. citizenship. Naturalized citizens become eligible to vote in elections.
- While this data is provided in aggregate, there is limited availability of demographic data on the preliminary views of immigrant voters.
- Undocumented immigrants are included in the non-U.S. citizen pool but there is not enough statistical representation in this study to show a sub-level breakdown.
The Brookings Institution is committed to quality, independence, and impact.
We are supported by a diverse array of funders. In line with our values and policies, each Brookings publication represents the sole views of its author(s).