Portions of this post have previously appeared on Government Executive.
Americans head into the 2022 campaign season with record-setting doubts about the federal government’s faithful execution of the laws. Public demand for “very major” government reform is at a twenty-year high, while confidence in government to do the right thing has dropped to a historic low, the thickening of government with needless management layers has continued unabated, and support for government careers has slipped below 40%. Absent large-scale repairs to renew and repair the federal government’s sprawling bureaucracy, Americans have good reason to ask whether the government can deliver on the promises it makes.
Until Washington takes the crisis seriously, Americans have no choice but to prepare for more government breakdowns. Despite decades of grand reforms dating back to Truman’s post-World-War II reorganizations, Carter’s civil service modernization plan, Reagan’s war on waste, Gore’s search for a government that works better and costs less, and President Biden’s 2011 plan for a 21st-century regulatory system, the federal government remains vulnerable to “major malfunctions,” predictable failures, design flaws, over-confidence, and silent safety systems that have caused so many breakdowns in the past and continue to frustrate best-laid plans as the nation confronts new social, economic, and political threats. As the following takeaways suggest, the federal government desperately needs an overhaul, and Americans want it now.
- The demand for “very major” government reform is rising.
- Americans are deeply divided about government reform.
- The number of government breakdowns is accelerating.
- The thickening of government continues.
- Biden’s job rating for running the federal government has been falling.
- Support for careers in government is falling.
THE SIX TAKEAWAYS
- The demand for “very major” government reform is rising.
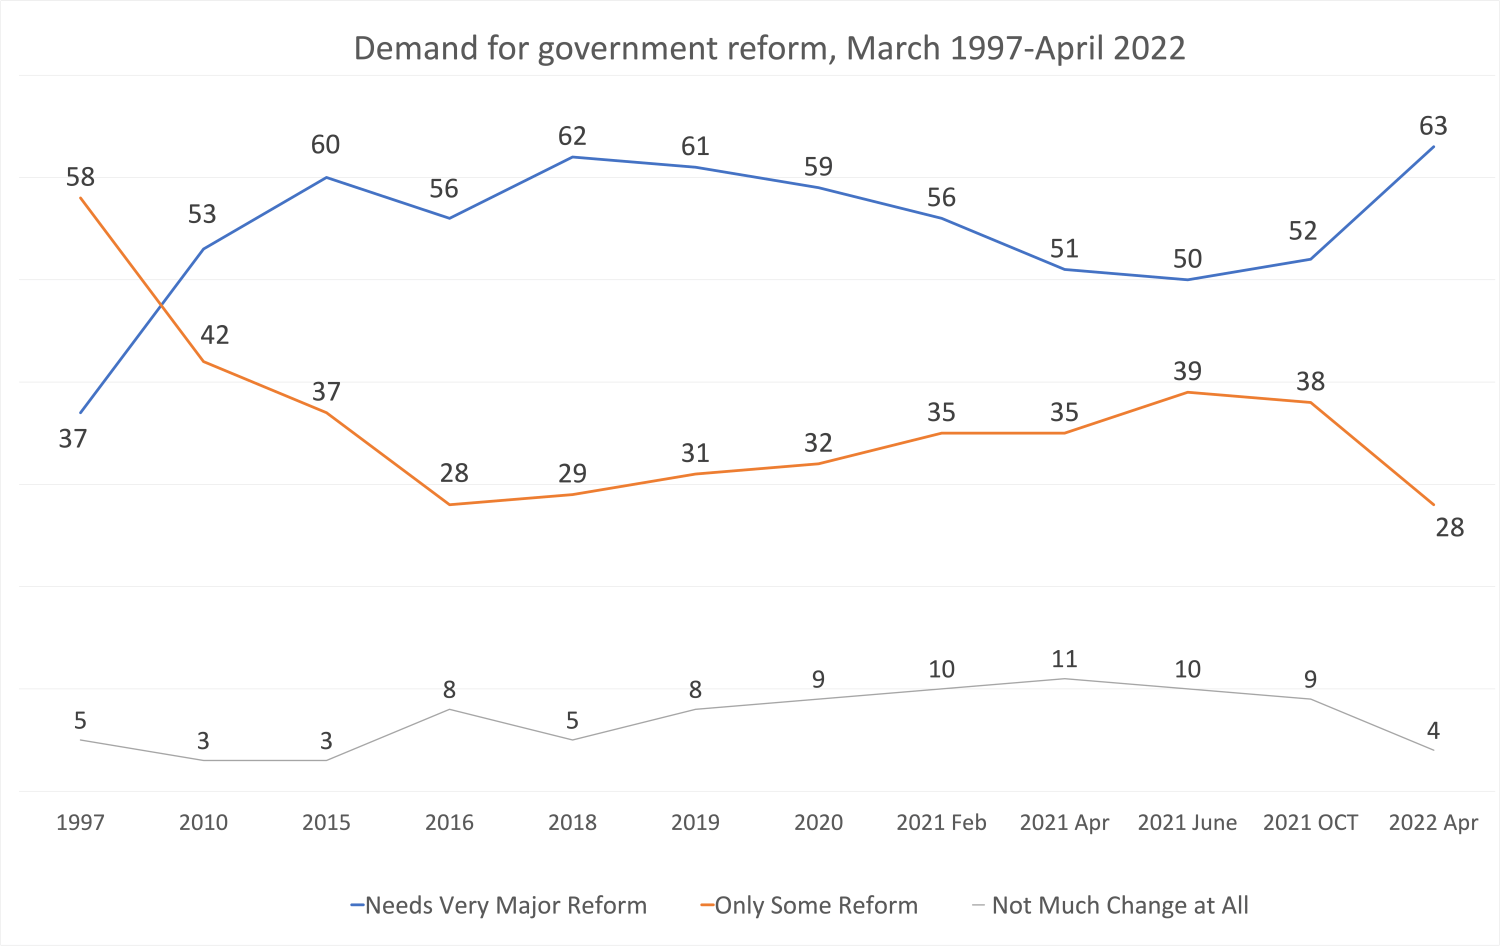
Clinton began his second term in office in 1997 with 58% of Americans convinced the federal government was “basically sound and only needed some reform.” The economy was strong, the world was at peace, and Clinton remained popular deep into his presidency.
This era of confidence was short-lived, however, as public demand for “very major reform” increased from 37% in 1997 when the Pew Research Center first asked the question to 60% two decades later. Meanwhile, the number of Americans who said the government is “basically sound and needed only some reform” dropped 30 points to 28%.
(See Chart 1 for the demand curve.)
CHART 1: THE DEMAND FOR GOVERNMENT REFORM
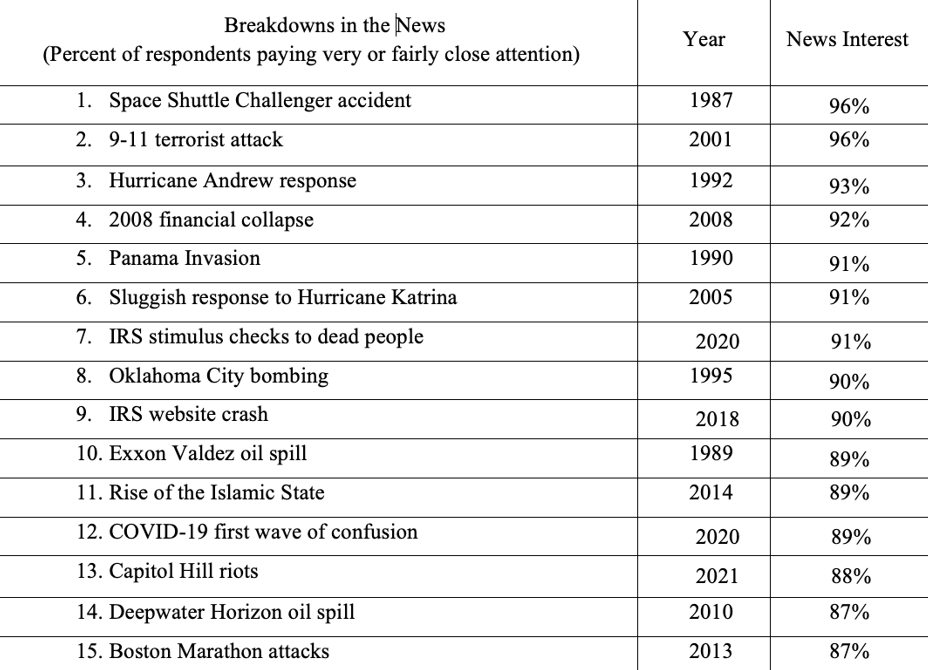
The demand for reform is broadly linked to the recent increase in government breakdowns, declining confidence in government more generally, and public dissatisfaction with the way the country is headed. Even as some Americans might justify a breakdown as the price of ambition, Americans have a long history of following breakdowns very closely and have long memories of government tragedies such as the 9/11 terrorist attacks, the Shuttle Challenger accident, the sluggish response to Hurricane Katrina, vaccine and medical supply shortages and stimulus checks sent to dead people.
(See Chart 2 for a list of the most visible federal breakdowns dating back to 1997 when Pew first asked its first questions about government reform.)
CHART 2: BREAKDOWNS IN THE NEWS, 1987-2021
Where Americans stand on demand for government reform depends on party control of government—that is, Democrats tend to favor very major reform when Republicans are in power, while Republicans return the favor when Democrats are in power:
- In March 2010 with a Democrat in the White House, 66% of Republicans favored very major reform, compared with 43% of Democrats.
- In July 2014 with a Democrat still in the White House, 59% of Republicans favored very major reform compared with 37% of Democrats.
- In June 2018 with a Republican in the White House, 54% of Republicans favored very major reform, compared with 63% of
- In April 2022 with a Democrat in the White House, 84% of Republicans favored very major reform compared with 49% of Democrats.
Party identification is not the only anchor of demand for reform—ideology also plays a role, as do recent events and scandals. Americans pay attention to large-scale government breakdowns such as the 9/11 attacks and pandemic response. Partisans often give the benefit of the doubt to the president and party, but breakdowns provoke a much deeper response, especially in the wake of highly visible tragedies such as the Buffalo and Uvalde shootings.
- Americans are deeply divided about government reform.
As Chart 3 shows, the demand for very major reform and preferences for bigger or small government can be sorted into four broad philosophies that help predict public responses to reforms: (1) the “expanders” who favor a bigger government and only some reform; (2) the “streamliners” who favor a smaller government and only some reform; (3) the “rebuilders” who favor a bigger government and very major reform, and (4) the “dismantlers” who favor smaller government and very major reform.
CHART 3: SUPPORT FOR REFORM
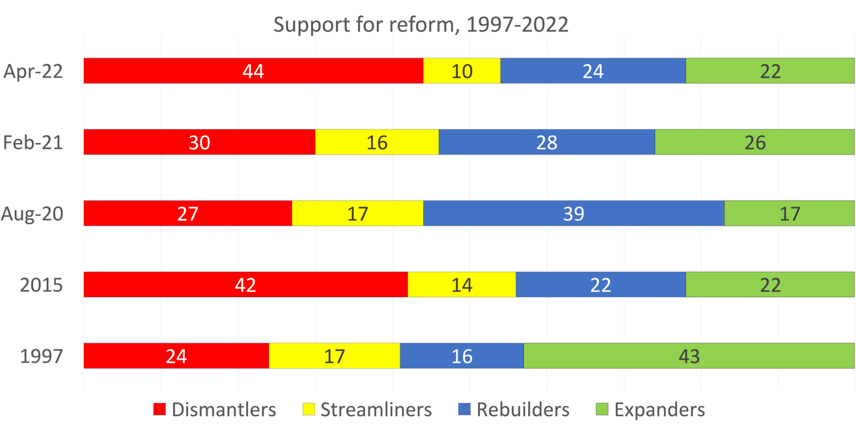
At first glance in 2021, Biden’s $1.8 trillion Build Back Better plan seemed tailormade to attract big-government expanders. As Chart 3 shows, however, the expanders ended the campaign with little momentum toward their bigger-government-that-delivers-more agenda and did not earn a bounce even with an expander in the White House and the Build Bank Better plan still on the agenda. Meanwhile, the rebuilders lost almost half of their support between August and April, while the streamliners settled at a recent low.
Measured in shares of support, the dismantlers had the strongest reaction to the end of the Build Back Better plan and early signs of declining public support were visible. Starting with a 27% share just before the 2020 election, the dismantlers rose to a 44% high by April 2022. Just as the Build Back Better plan seemed tailormade for the big-government expanders, its demise may be tailormade for bringing the rebuilders and dismantlers together in support of common sense government reforms and the deep repairs needed to address the rising number of government breakdowns. If doing so jump-starts the economy, as Peter Schuck and Philip Howard argued in early 2021, all the better for winnowing the needless rules that undermine federal performance.
For now, Biden continues to court the rebuilders with promises to end the bureaucratic runarounds that impose steep “time taxes” on government services and a pledge to move citizens to the front of the line. Skeptics might be more enthusiastic about the promises if Biden rebooted his 2011 campaign to cut government waste and his promise to “hunt down and eliminate misspent tax dollars in every agency and department across the Federal Government.” Shorter lines at the Social Security Office and faster internet access offer little comfort to Americans who worry about economic turmoil and tax increases.
A traditional war on waste might calm opposition to Biden’s spending plans, but Republican-leaning dismantlers have already built on his stumbles to close in on a near-majority in favor of their smaller-government/major-reform agenda. Having started their trendline with a 24% share of support in 1997, the dismantlers lost a third of their supporters between 2015 and 2021 before rebounding to a 44% share in April 2022. The dismantlers have shown little interest in Biden’s policy agenda and hit their most recent high after Biden pulled the plug on the Build Back Better plan in December. They have also shown little confidence in Biden’s leadership, giving him a 65% poor rating for running the federal government and its programs in October 2021 and an 81% in April.
The expanders stayed with Biden through the period with a 66% excellent/good rating in October 2021 and a 68% in April 2022, while the streamliners held steady with a 51% excellent/good in October and a 44% in April.
- The number of federal breakdowns is accelerating.
Defined as a government policy or management failure that produces high levels of news coverage and reader interest, the number of federal breakdowns has risen in every administration since my count began in 1986. Although the news industry often promotes stories about high-interest breakdowns for ratings, the number of breakdowns listed in the Pew Research Center’s “News Interest Index” has grown steadily over time.
Some of the failures involved what Biden has described as the “irrational downplaying” that led President Trump to minimize the 2020 SolarWinds hack, while others were triggered by legislative hubris, under-funding, and outright sabotage. The question for future action is whether there are patterns across the 123 breakdowns on my list that might lead to fewer failures in the future. Were policy designs at fault? Was political pressure to blame? Were major malfunctions dismissed? Were shortcuts and end-arounds a factor?
The answers can only come from a breakdown-by-breakdown analysis of the facts. The data is easy to assemble—the 123 breakdowns account for dozens of blue-ribbon commissions, congressional investigations, research studies, best-selling histories, and teaching cases. The challenge is to use the findings to develop simple questions that might provoke second thoughts before the policies are enacted, programs implemented, budgets scrubbed, and countdowns begun.
As Chart 4 shows, the number of highly visible government breakdowns has been rising since 1986 when the count began with the Shuttle Challenger accident. Thirty years and 123 breakdowns later, the federal government continues to face significant odds of failure baked into the over-promising, under-staffing, and short-cuts driven by more-with-less directives that stress aging programs to the edge of failure and offer little room for error in new initiatives.
CHART 4: GOVERNMENT BREAKDOWNS BY PRESIDENT
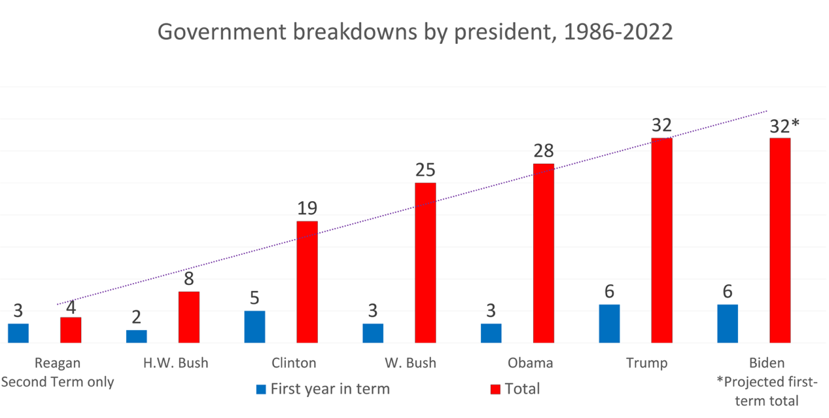
Each of the past three presidents started their first year in office with a short list of breakdowns that multiplied over time. Trump faced six more breakdowns in his second year, five in his third, and sixteen in a final year that began with early missteps in the fight against COVID and ended with the Capitol Hill riots just weeks before he left office.
As Chart 4 also shows, Biden faced six breakdowns in a first year that started with a border surge just weeks after his inauguration, the Colonial Pipeline internet hack in May 2021, rising crime and gun violence into summer, a supply-chain shutdown, increasing inflation by July, and the bloody Afghanistan withdrawal in September. He added two more breakdowns to his list by mid-summer, 2022 with a baby formula shortage that started in May and a torrent of summer flight delays and cancellations by July.
- The thickening of government continues.
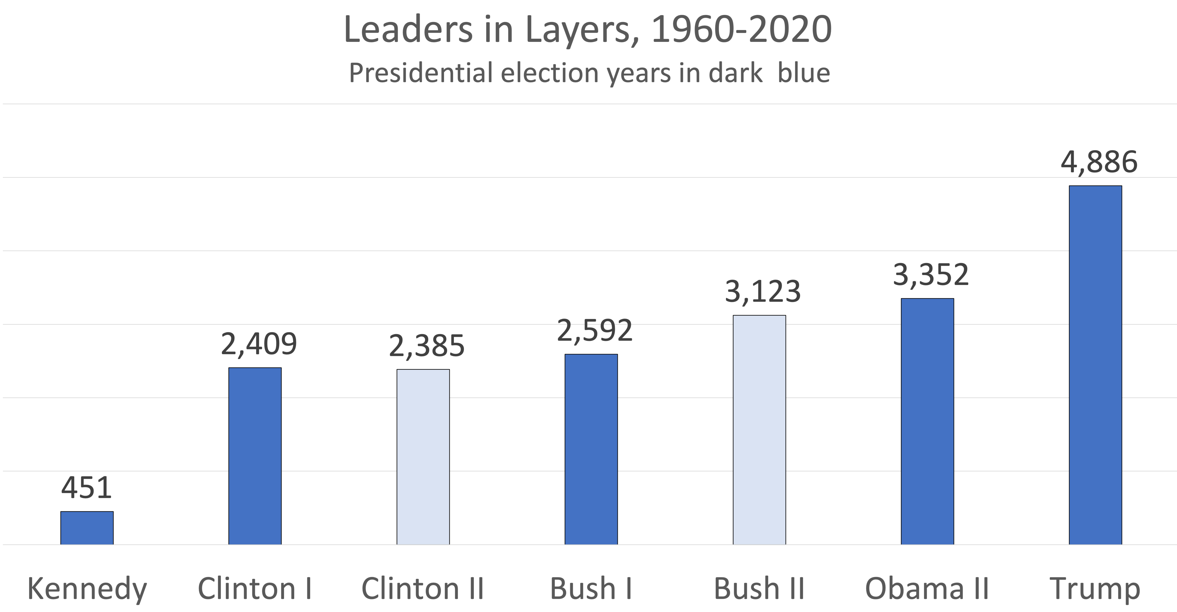
According to the online phonebooks published by Leadership Connect in 2020, Biden took control of 83 layers of presidential appointees and 5,000 jobs on Inauguration Day. Biden also inherited hundreds of lower-level “title-riders” who thicken the hierarchy with second titles such as “associate deputy assistant secretary,” “assistant deputy undersecretary,” “deputy associate assistant commissioner,” “associate principal deputy assistant secretary,” “deputy chief of staff,” and “assistant deputy chiefs of staff.” As Chart 5 shows, Biden inherited a government that has never had more layers of leaders nor more leaders per layer confirming Trump’s complaint that there were so many appointees in government that “it’s just people over people over people.”
(See Chart 5 for the rising number of presidential appointees and the number of layers they occupy)
CHART 5: LAYERS OF LEADERS & LEADERS IN LAYERS

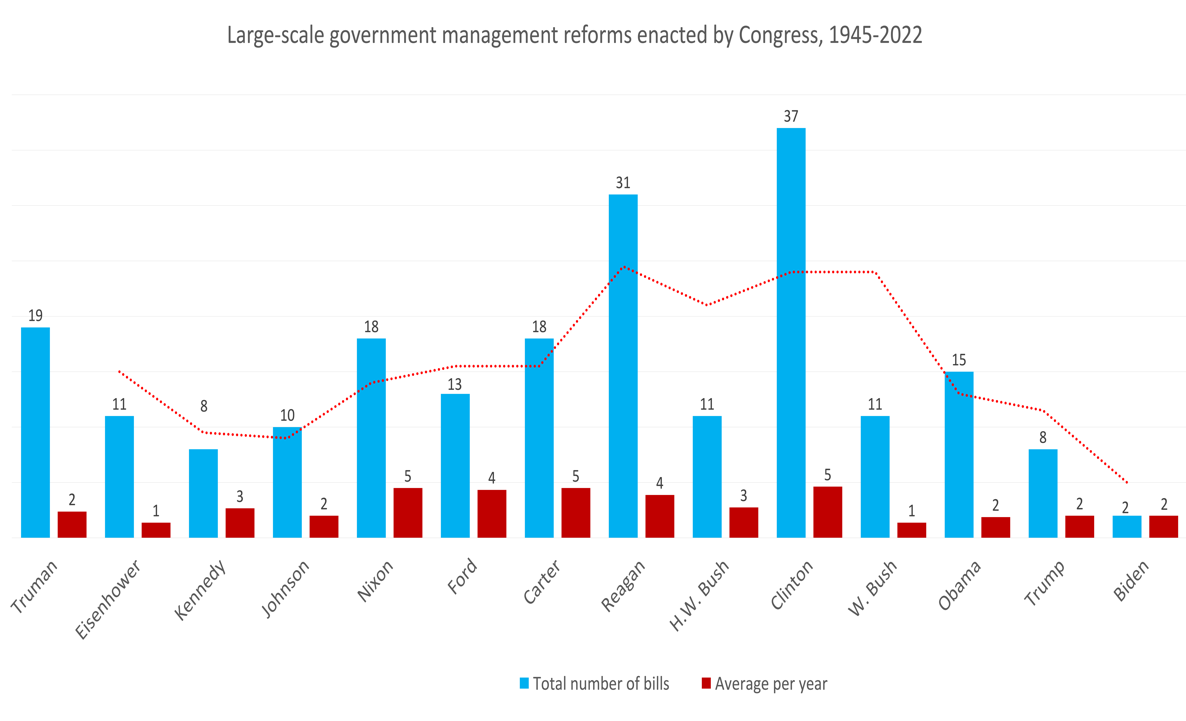
Congress has the primary role in flattening the hierarchy but will not act without presidential demand. Despite constant nudging by the Government Accountability Office (GAO), Congress continues to ignore the outdated management laws and systems that have fueled so many government breakdowns. Absent a call to action and restoration of the president’s reorganization authority, the reform draught will continue. Congress averaged five major reform bills per year during the Nixon, Carter, and Clinton administrations, but throttled back to just two bills per year over the last twenty years.
(See Chart 6 for the recent decline in congressional enactments on government reform.)
CHART 6: GOVERNMENT REFORMS ENACTED BY CONGRESS, 1945-2022
- Biden’s job rating for running the federal government has been falling.
Biden began his presidency in January facing a border crisis and a pandemic panic, but ended his honeymoon six months later 51% excellent/good rating for running the federal government and its programs. As Chart 7 shows, Biden’s excellent/good ratings dropped to 44% in October and 35% last April, while his fair/poor ratings went the opposite direction from 48% in October to 63% by April.
CHART 7: BIDEN’S RATINGS FOR RUNNING THE FEDERAL GOVERNMENT

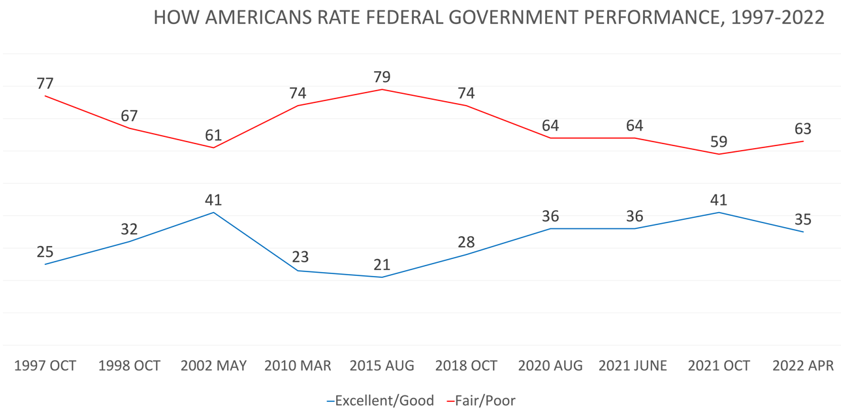
More recent surveys also show broad public concerns about the president’s performance, including a May 2022 CBS News poll in which 65% of Americans said Biden was “slow to react when important things come up.” As Chart 7 also shows, public ratings of the federal government’s performance show continued cause for concern. The federal government has only breached the 40-percent excellent/good mark twice since 1997 and has shown no momentum toward better marks in the future.
CHART 8: HOW AMERICANS RATE THE FEDERAL GOVERNMENT’S JOB PERFORMANCE
- Support for careers in government is falling.
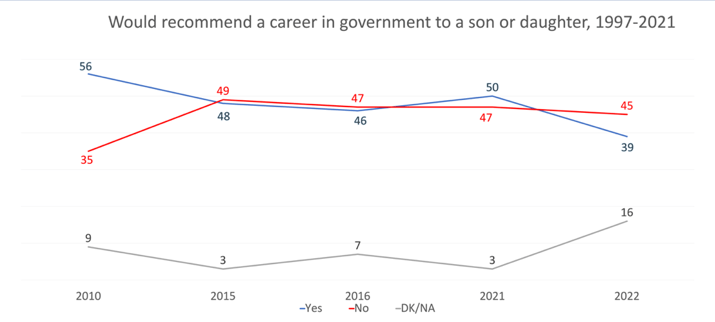
The percentage of Americans who said they would want a son or daughter to pursue a career in government dropped from 56% in 2010 to just 39% in April 2022 as the number of respondents who did not answer the question increased. Republicans and independents were most likely to say “no” to a government career and Democrats most likely to say “yes,” while conservatives and moderates were the most likely to say “no,” and liberals again most likely to say “yes.”
(See Chart 9 for the trend lines.)
CHART 9: SUPPORT FOR CAREERS IN GOVERNMENT
The four reform philosophies also shape support for careers in government. Asked last April whether they would recommend a career in government to a son or daughter, 77% of the dismantlers answered “no,” “don’t know,” or refused the question entirely, while 36% of the streamliners, 52% of the rebuilders, and 54% of the expanders answered “yes.”
Alongside the 11-point drop in the number of Americans who would recommend a career in government to a son or daughter, the number of null answers rose 13 points between 2021 and 2022, suggesting that Americans are becoming more uncertain about the value of careers in government. Indeed, even the most enthusiastic expanders might reconsider their recommendations if they knew how long the hiring process takes, how many federal employees say performance has little impact on pay and promotions, and how few say creativity and innovation are encouraged in their organizations. Recent studies also highlight the impact of polarization, economic uncertainty, and benefit cuts on student interest in government careers.
The recent downturn in student interest comes just as the baby boomers begin leaving for retirement. Although the departures offer a rare opportunity to repair the federal personnel and pay systems, Congress has shown little interest in the task. Almost everything that could go wrong with the recruiting, hiring, training, and disciplining of the federal service needs repair, but Congress continues to ignore reform.
A CALL TO REFORM
Biden rarely talked about the need for government reform during his years in the Senate and bluntly rejected the topic in 2008 when Obama asked if he would be “very happy” to reorganize the federal government” as part of his vice-presidential portfolio. “No,” he answered, “that’s not what I want to do.”
Even though he passed on government organization during the campaign, Biden accepted occasional management chores overseeing the implementation of Obama’s 2009 stimulus package and chairing the administration’s 2011 “Campaign to Cut Waste.” Along the way, Biden also developed expertise in selling excess property, closing small government offices, harvesting improper payments, cutting government travel budgets, and hunting down Medicare fraud.
Biden needs more than an early-warning system to bend the breakdown curve. He also needs fierce honesty from his staff, unrelenting skepticism about vulnerable plans, and honest data on rising threats. He has acknowledged that he found out about the shortage two months after it began and complained that members of the White House staff had known about the baby formula shortages months earlier before the news reached his daily brief. “There were a million crises going on” at the time, a White House staffer later told Politico. “That doesn’t mean that this wasn’t also a crisis, it just wasn’t elevated to a top-level crisis.”
Biden also needs to address the underlying problems that triggered the 123 breakdowns discussed in this report. Although the “Biden-Harris 2021 Management Agenda Vision” has won plaudits for its commitment to an “equitable, effective and accountable government that delivers results for all,” the agenda has yet to outline an implementation plan that might appeal to the two-thirds of Americans who favor very major reform. As for a public response, Biden’s disapproval rating already stood at 52% when the vision was released on November 19 and has barely moved since. His agenda might be a “big deal” to public administration experts but is still far from the very major reform Americans want. It also lacks the punch that wars on government waste, budget cuts, and civil service cuts provide.
Vice President Al Gore’s National Performance Review took a different course. “We cut government the right way,” reinventing-government guru, Elaine Kamarck told Congress in 2013, “by eliminating what wasn’t needed—bloated headquarters, layers of managers, outdated field offices, obsolete red tape, and rules.” By the end of the first year, Gore, Kamarck, and the rest of the reinventing team had cut 78,000 federal management jobs, issued 1,250 directives toward improved performance, harvested $136 billion in waste, and added three dozen management reforms to the federal code. Although the reinventing campaign and its papers are now housed in a Texas cyber-cemetery, the website still generates traffic as change agents look for insights on how to reinvent their organizations.
Elected as the “big spender America wants,” as Paul Krugman wrote after the inauguration, Biden must now become the “Mr. Fixit” Americans say the federal government needs. He may not be happy in the role, but it is now on his agenda whether he likes the work or not. Although Americans often express favorable opinions toward highly visible agencies such as the Centers for Disease Control, Postal Service, and even the IRS, a fifth of Americans said they were angry toward the federal government when interviewed by the Pew Research Center in August 2020, 60% were frustrated, and just 20% were basically content.
Trust in the federal government is unlikely to rebound without significant reform. According to the Pew Research Center, nearly half of Americans believe the federal government faces more difficult challenges today than in the past, but 40% say dealing with federal government agencies is often not worth the trouble, while 71% say the federal government intentionally withholds information from the public, and just over 60% said most or all candidates for office are running to serve their own interests rather than their communities.
Americans remain unsparingly negative toward the federal government’s job performance. Interviewed in April and May 2022, just 32% had a favorable opinion of the federal government, compared with 54% and 66% who felt the same about their state and local governments respectively. In contrast, only 34% said the federal government responds to the needs of ordinary Americans and just 26% said the federal government is careful with taxpayer money. Nevertheless, 43% said the federal government has the capacity to address new problems as they come up, suggesting some flexibility in meeting crises.
These findings suggest that breakdowns are more an accelerant of declining trust than a cause. Although every breakdown creates new doubts about government performance, they are almost always traceable to bureaucratic failures that can and should have been addressed long before the federal government embraced a new endeavor. This is not to forgive the broken agencies, failed technologies, missed warning signs, and wishful thinking that often trigger the highly visible breakdown profiles in this report. Rather, it is to encourage thorough cause-and-effect research on every breakdown toward future prevention. Mistakes may be inevitable, but ignorance is no excuse. The challenge is how to prevent breakdowns before they add another tragedy to the breakdown curve.
History will judge Biden’s role in the rising number of breakdowns on his watch and ask which ones, if any, could have been prevented given the government he inherited. However, Biden’s more general lack of interest in government management may yet produce new breakdowns with further erosion of what the Niskanen Center calls the “state capacity” needed to faithfully execute the laws. The breakdown curve is on Biden’s watch now and will take its toll in the 2022 midterms and beyond.
Related Content


Author

The Brookings Institution is committed to quality, independence, and impact.
We are supported by a diverse array of funders. In line with our values and policies, each Brookings publication represents the sole views of its author(s).

Commentary
What Americans still want from government reform — a midsummer update
July 20, 2022