
Executive summary
This report analyzes intergenerational economic mobility in New Orleans using data from Opportunity Insights. It focuses on two parent-child cohorts: the first being children born between 1978 and 1982, and the second being children born in 1992. The report explores how structural inequalities—particularly around race, place, and public investments—have uniquely shaped economic mobility over time, with Hurricane Katrina as a major disruption.
New Orleans, a Black-majority city with significant economic and racial inequalities, is uniquely vulnerable to climate shocks and disinvestment. These intersectional factors—combined with pronounced neighborhood segregation, high economic inequality, and a history of exclusion—make the city an important case study for how place shapes economic mobility.
Overall, this report finds that New Orleans ranks at the bottom among the 50 largest U.S. commuting zones for upward economic mobility for children from low-income families. Children who grow up in the city are predicted to earn 13.4% less than the national average as adults, and approximately 40% of their income is determined by parental income. This signals strong intergenerational persistence effects.
We find mixed patterns across parishes. St. Charles and St. Tammany parishes show higher absolute mobility for low-income youth, but still low relative mobility, indicating the persistence of intergenerational disadvantage across class. Orleans Parish has seen gains for its poorest residents, yet still ranks among the lowest nationally in both relative and absolute mobility measures. St. Bernard and Plaquemines parishes show relatively better metrics for overall mobility, and St. James and Jefferson parishes show disproportionately large gains for high-income groups.
The report concludes with policy recommendations primarily focused on evidence-based policies that have proven successful in supporting upward economic mobility.
Introduction
Economic mobility is a multidimensional phenomenon and reflects changes in economic circumstances influenced by a range of factors, including education, safety nets, social capital, private investment, access to health care and education, and crime rates. High upward economic mobility strengthens a region’s adaptive capacity and the ability to absorb shocks. This is particularly relevant for New Orleans—a region marred by high levels of poverty, inequality, and vulnerability to climate shocks.
Residents of regions with greater economic mobility are more likely to have savings and assets that protect against job loss and disasters. Growth in business ownership and private investment improves access to credit and insurance, enabling quicker recovery.
New Orleans faces persistent spatial and racial inequalities, and overall low upward mobility. By investing in interventions focused on supporting upward economic mobility for low- and middle-income residents, we can aim toward a long-term goal that minimizes the generational disadvantage gap while also making New Orleans more resilient to climate risks. Thus, the urgent call for efforts to invest in economic mobility is not just an equity concern, but one that will enhance the city’s resilience and recovery capacity in the face of shocks.1
Resilience enhances the probability of developing more engaged and empowered communities, whereby individuals with upward economic mobility are more inclined to invest in their neighborhoods and advocate for improvements in infrastructure, zoning, and disaster response. Research shows that Black residents returned to New Orleans at a slower pace compared to other residents—a finding that is correlated with mobility constraints and unequal recovery capacity. Economic mobility starts with individual success, but also forms the foundation for collective resilience. In a city prone to climate risks and marred by systemic barriers and racial inequalities, advancing mobility is a form of long-term disaster preparedness and place-based economic stability. This report contributes to the broader understanding of intergenerational economic mobility by providing empirical evidence on income persistence across two generations of New Orleanians.
Opportunity Insights data reveal that New Orleans ranks among the worst in the U.S. for upward income mobility, with only a 5.1% chance that a child born into a low-income family will reach the top income quintile as an adult. Findings reveal that relative mobility is also low in New Orleans: 40% of a child’s income is determined by parental income, and children who grow up in New Orleans are predicted to earn 13.4% less than the national average as adults, even after controlling for parental income. This reflects the negative causal effect of place on long-term earnings for low-income children. Mobility outcomes vary significantly across parishes, with St. Bernard and St. Tammany parishes showing broad-based post-Katrina gains, while others, such as St. Charles Parish, show rising inequality. Overall, income gaps by race and class persist.
Data and methods
This analysis uses data from Opportunity Insights, which links restricted Internal Revenue Service tax records with Census Bureau data to examine intergenerational economic mobility across two cohorts.2 The two cohorts consist of those born between 1978 and 1982 and those born in 1992, measuring adult income at age 27-28, the earliest age at which reliable estimates of income can be observed.3
The Opportunity Atlas defines intergenerational economic mobility as the correlation between parents’ and children’s positions in the national income distribution, conditional on growing up in a certain census tract. The dataset measures intergenerational economic mobility by comparing the child’s adult income to their parents’ income, based on where they grew up. Lower mobility means a stronger correlation between the child and parents’ incomes, and that intergenerational income persists across these two generations more strongly. A weaker correlation suggests that the child has greater opportunity to move in terms of economic mobility, regardless of their inherited economic status or their parents’ status.
Economic research shows that where children grow up has a significant causal effect on their prospects for upward income mobility.4 The Opportunity Insights dataset explores estimates of children’s well-being outcomes in adulthood by census tract and subgroup.5 The methodology of linking children to parents is based on dependents claiming tax returns. For the cohort of children born between 1978 and 1982, Opportunity Insights observes their incomes in 2005; for those born in 1992, income is observed in 2019.6 Both cohorts are around age 27 to 28 when their incomes are observed. Opportunity Insights’ model is based on the hypothesis that children’s outcomes are associated with parental income percentile, race, and gender, conditional on growing up from birth in a certain census tract.7
The selection of these cohorts enables a quasi-experimental design to understand how the timing of exposure to an exogenous shock (Katrina) shaped existing social and economic infrastructures to impact long-run economic outcomes.8 The older cohort was between the ages of 23 and 27 at the time Katrina hit, meaning they had largely crossed developmental stages and their economic trajectory was primarily determined by pre-Katrina institutional and labor market conditions. In contrast, children born in the 1992 cohort were approximately 13 years old when Katrina struck in 2005, placing them at a pre-adulthood developmental stage. The hurricane impacted children in this cohort through disrupted schooling, relocation to other metro areas, and long-term exposure to new neighborhood conditions upon returning to New Orleans. Therefore, their adult earnings in terms of economic mobility reflect, beyond the household and neighborhood levels, the ability of local systems to ensure equitable access to opportunity post-Katrina. While the older cohort serves as a baseline reflecting pre-Katrina conditions, the younger cohort more accurately captures the long-run impact of the hurricane and post-disaster recovery policies on disrupted schooling, housing displacement, and changes in neighborhood composition and public investment.
While the Opportunity Insights dataset is not perfectly aligned with the timing of Hurricane Katrina, it is the only open-access dataset available for analyzing intergenerational economic mobility at the local level in New Orleans. In this analysis, we use descriptive statistical comparisons, parish-level disaggregation, and cohort-based analysis to identify patterns in mobility across race, income group, and place, and treat Katrina’s exposure as a natural experiment to explore the impact of climate disasters on structural inequality over time.
Finally, this report focuses on the New Orleans metropolitan area, which the federal government defines as the areas that include eight parishes: Plaquemines, St. Bernard, Orleans, Jefferson, St. Charles, St. John the Baptist, St. James, and St. Tammany.9 In the following section, we present key findings on economic mobility across parishes, with particular attention to cohort differences and place-based disparities
Economic mobility in New Orleans
Absolute and relative mobility
To understand economic mobility, it is essential to understand the standard metrics of measuring this phenomenon. “Relative” and “absolute” mobility are typically used to measure economic mobility, but each metric captures a different reality.
- Absolute mobility measures whether children are doing better than their parents in terms of income, typically comparing inflation-adjusted earnings across generations. High absolute mobility means economic growth is lifting living standards across the board, even if inequalities remain.
- Relative mobility measures how tightly a child’s economic position is tied to that of their parents. High relative mobility means there is more movement up and down the income ladder and people are not locked into the same rank as their parents. Low relative mobility indicates that your starting point in life is a strong predictor of where you’ll end up, making economic outcomes more dependent on family background than individual potential.
Opportunity Insights’ research on national trends in absolute and relative mobility finds that nationally, absolute mobility decreased from approximately 90% for children born in the 1940s to 50% for children born in the 1980s.10 While national estimates of relative mobility have remained stable for the 1971 to 1993 birth cohorts, it varies significantly across the country.11 This distinction is especially important in a region like New Orleans, which ranks among the lowest in the country among the 50 largest commuting zones and where economic gains have not translated into equal opportunity to climb the income ladder. For example, the probability that a New Orleans child with parents in the bottom income quintile ends up in the top income quintile as an adult is 5.1%—one of the lowest in the country among the 50 largest commuting zones.12 This is a measure of relative mobility, and it reflects how tightly a child’s future is linked to their parents’ income. In other words, New Orleans shows a strong pattern of intergenerational income persistence.
Concerningly, absolute mobility in New Orleans is also low. Children who grow up in the city from birth are predicted to earn 13.4% less in adulthood than their peers across the country. This means not only are low-income children less likely to move ahead (low relative mobility), but they are also earning less overall than they would have if raised elsewhere (low absolute mobility). From a policy perspective, this is not meant to discourage policymakers, but rather motivate sharp, place-based investments that address the root causes of persistent disadvantages. More specifically, these findings are meant to build a case for urgently investing in solutions such as baby bonds, which have proven successful in supporting upward economic mobility for children from the most disadvantaged families. In a place like New Orleans—where absolute and relative mobility are low, wealth is concentrated at the top, and economic and climate vulnerabilities put low-income families at compounded risk—baby bonds offer a promising solution.
Relative mobility
New Orleans has a relative mobility of 0.397, which means that approximately 40% of a child’s economic status is determined by their parents’ income rank—a signal that parental income is highly correlated with the child’s predicted income. This correlation between parental and child income is relatively stronger for New Orleans compared to other cities in the country. This implies low relative mobility: Children born to poor families are significantly less likely to climb the income ladder, and children from wealthy families are more likely to remain at the top. So, New Orleans exhibits a strong intergenerational persistence of income, reinforcing inequality across generations.
Below is a ranking of New Orleans’ eight parishes based on how much a child’s economic status is determined by parental status, thus reflecting relative economic mobility. For example, Orleans Parish ranking fourth-worst nationally means income is highly inherited there—children from poor families are unlikely to move up, and those from wealthy families are likely to stay at the top. It does not measure how far children climb in actual income terms (that is absolute mobility, discussed in the next section), but rather how tightly economic outcomes are linked across generations.
- Orleans Parish: Upward economic mobility varies significantly among New Orleans’ eight parishes. For example, Orleans Parish exhibits low upward income mobility. It performs worse than 96% of all counties in the U.S., and is the fourth-worst for upward income mobility. Black boys from low-income families have some of the worst prospects for economic mobility in this area. As of 2023, 67% of the population in Orleans Parish identifies as Black.
- Jefferson Parish: This parish ranks at the 35th percentile nationally, which means it has low upward mobility. While this is better than Orleans Parish, it still lags behind other counties in opportunities for children from low-income families to climb the income ladder.
- Plaquemines Parish: This parish ranks at the 49th percentile nationally and represents average upward mobility relative to other parishes. Rural poverty and underinvestment in industry create limited opportunities for upward mobility in this area.
- St. Charles Parish: This parish ranks at the 61st percentile nationally, showing high upward mobility relative to other parishes.
- St. John the Baptist Parish: This parish ranks at the 25th percentile nationally, reflecting one of the lowest ranks of economic mobility. This region is characterized by historical disinvestment, industrial pollution, and low-quality schools. Black children and those living closer to the petrochemical industries may be particularly vulnerable to structural and environment damage.
- St. Tammany Parish: This parish ranks at the 45th percentile nationally, representing average upward mobility.
- St Bernard Parish: This parish ranks at the 50th percentile nationally, representing the middle of the national average.
- St. James Parish: This parish ranks at the 36th percentile nationally, exhibiting low upward income mobility.
Absolute mobility
The mobility scores shown in Table 1 reflect a measure of absolute intergenerational mobility. More specifically, the scores measure the mean income rank at age 26/27 for children whose parents were at the 25th percentile of the national income distribution. This measure solely focuses on economic gains for the bottom quintile regardless of how other quintiles fare across the income distribution. The z-score indicates how a place compares to the national average in driving upward economic mobility. A negative score means below-average mobility outcomes.
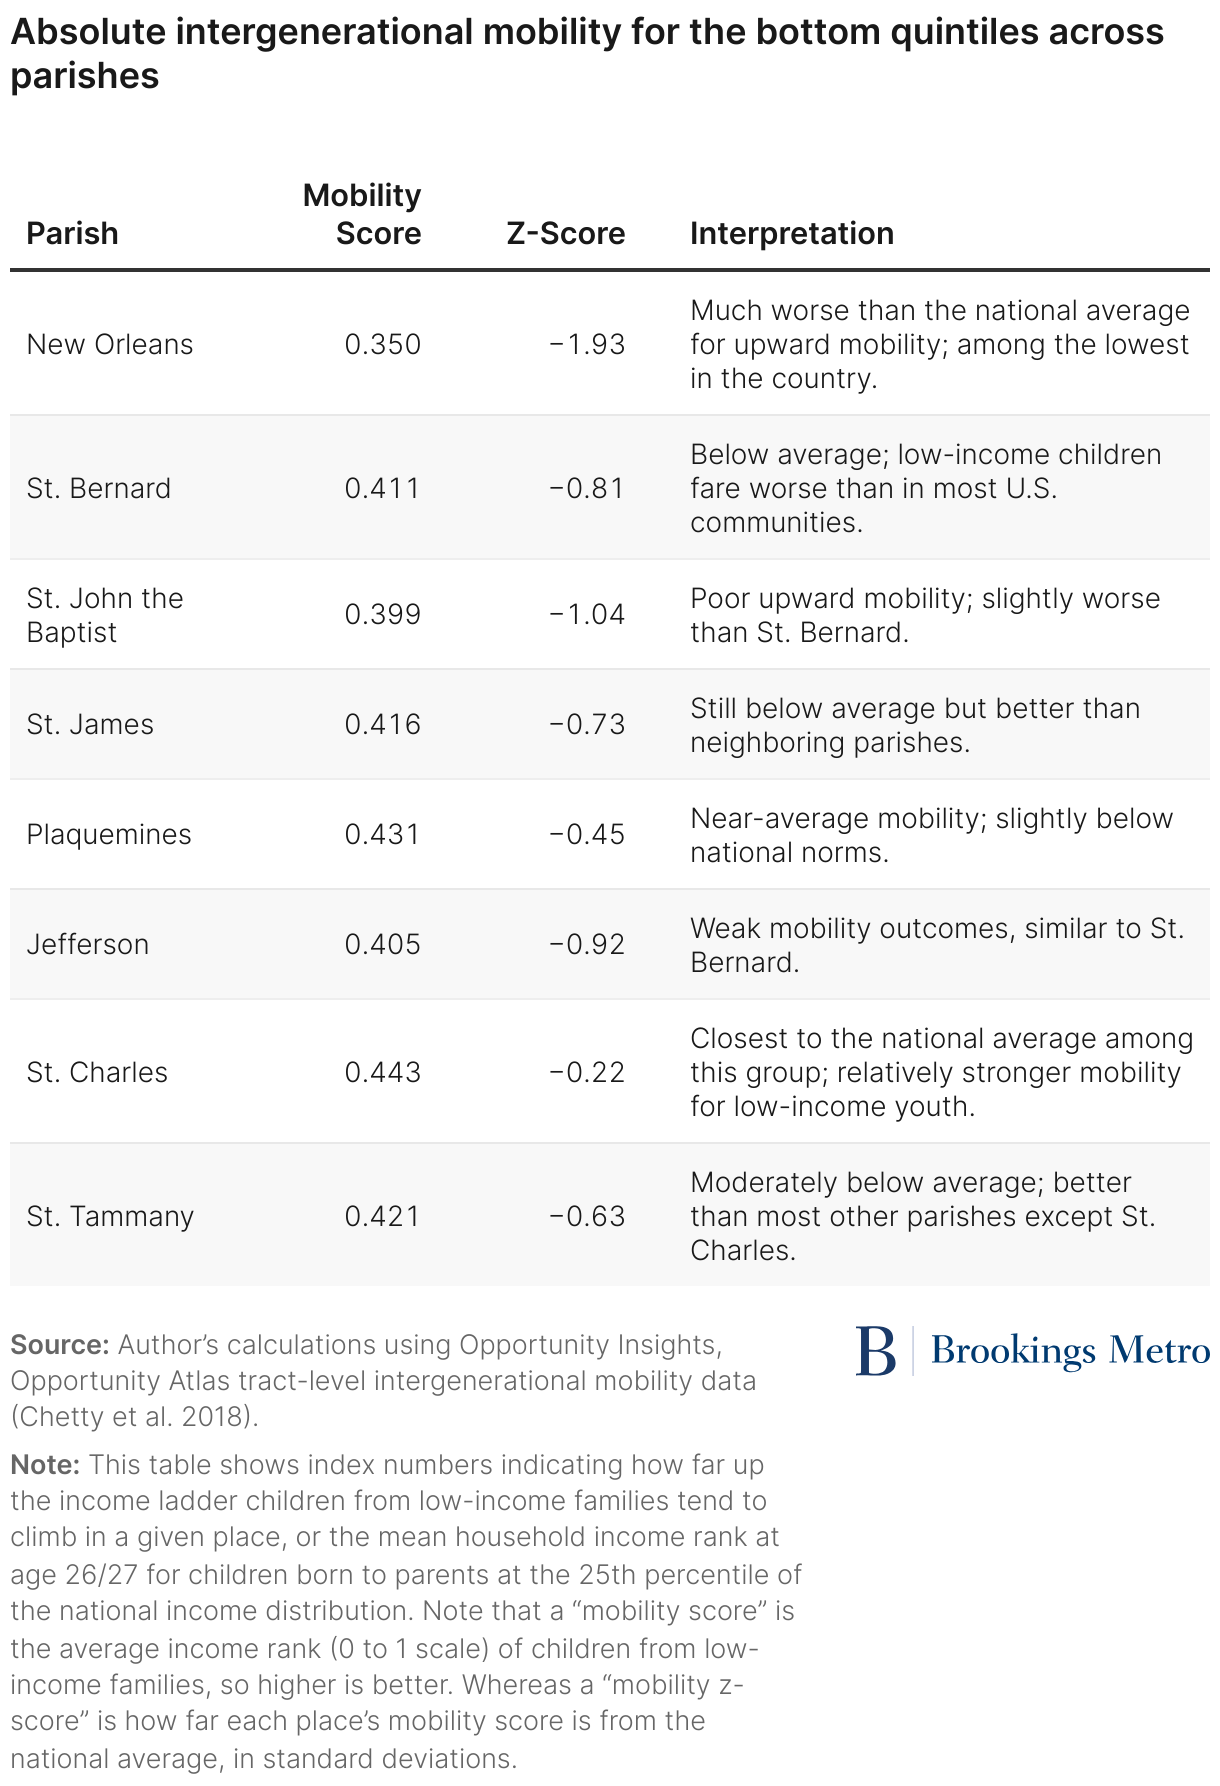
Absolute mobility data reveal nuances across parishes:
- New Orleans (mobility score: 0.35; z-score: -1.93) has one of the lowest absolute mobility scores in the country. On average, children from poor families remain stuck near the bottom of the income distribution, reflecting long-standing structural barriers. As mentioned in the preceding section, New Orleans has a relative mobility score of 0.397. Faring low on both absolute and relative mobility means that low-income children in New Orleans earn significantly less in absolute terms and face higher barriers to upward mobility in relative terms. This reinforces intergenerational cycles of poverty.
- St. Bernard, St. John the Baptist, and Jefferson parishes also fall well below national norms, with z-scores from -0.81 to -1.04, suggesting similarly constrained economic prospects for low-income children. These parishes have low to moderate relative mobility.
- St. James, St. Tammany, and Plaquemines parishes perform moderately below average, offering somewhat better but still limited pathways out of poverty. These parishes exhibit below-average relative mobility, meaning that while low-income children earn slightly more than their parents, their likelihood of climbing the economic ladder is still significantly low in relative terms.
- St. Charles Parish stands out as the least disadvantaged in absolute mobility terms, with a mobility score of 0.443 and z-score of -0.22. While still slightly below the national average, this suggests that local conditions in St. Charles historically supported high upward mobility for low-income residents. However, this changed dramatically after Katrina.
Katrina reshaped the physical as well as economic landscape of the region, and compounded structural inequalities that persisted. The numbers on economic mobility reflect historical inequities, but also call for urgent targeted and place-based investment in the region.
Changes in household income across two cohorts based on parental income
Figure 1 shows that relative changes in household income vary significantly for various income groups and parishes. The chart compares income at age 27 for two cohorts—those born in 1978 (age 27 when Katrina hit) and those born in 1992, who were 13 years old when Katrina struck in 2005.13
- The younger cohort, who were adolescents during Hurricane Katrina, experienced disrupted schooling, family displacement, and uneven access to rebuilding resources—factors that have shaped long-term earnings in ways that vary sharply by class and geography.
- Nationally, household income fell 6.2% for the lowest-income group (Q1) and 4.2% for low-income youth (Q2) born in 1992 compared to the 1978 cohort. Middle-income youth saw a 3.1% drop, while high-income youth (Q4) barely improved (0.3% gain), and only the highest-income group (Q5) saw relative gains (5.4%).
- In this context, income outcomes in New Orleans parishes reveal a more polarized and spatially unequal pattern, where some low-income youth bucked the national trend, while others fell behind even more sharply.
- Several parishes in the New Orleans metro area diverged from national averages. Some experienced greater losses for low-income youth, while others reported large gains for high-income groups.
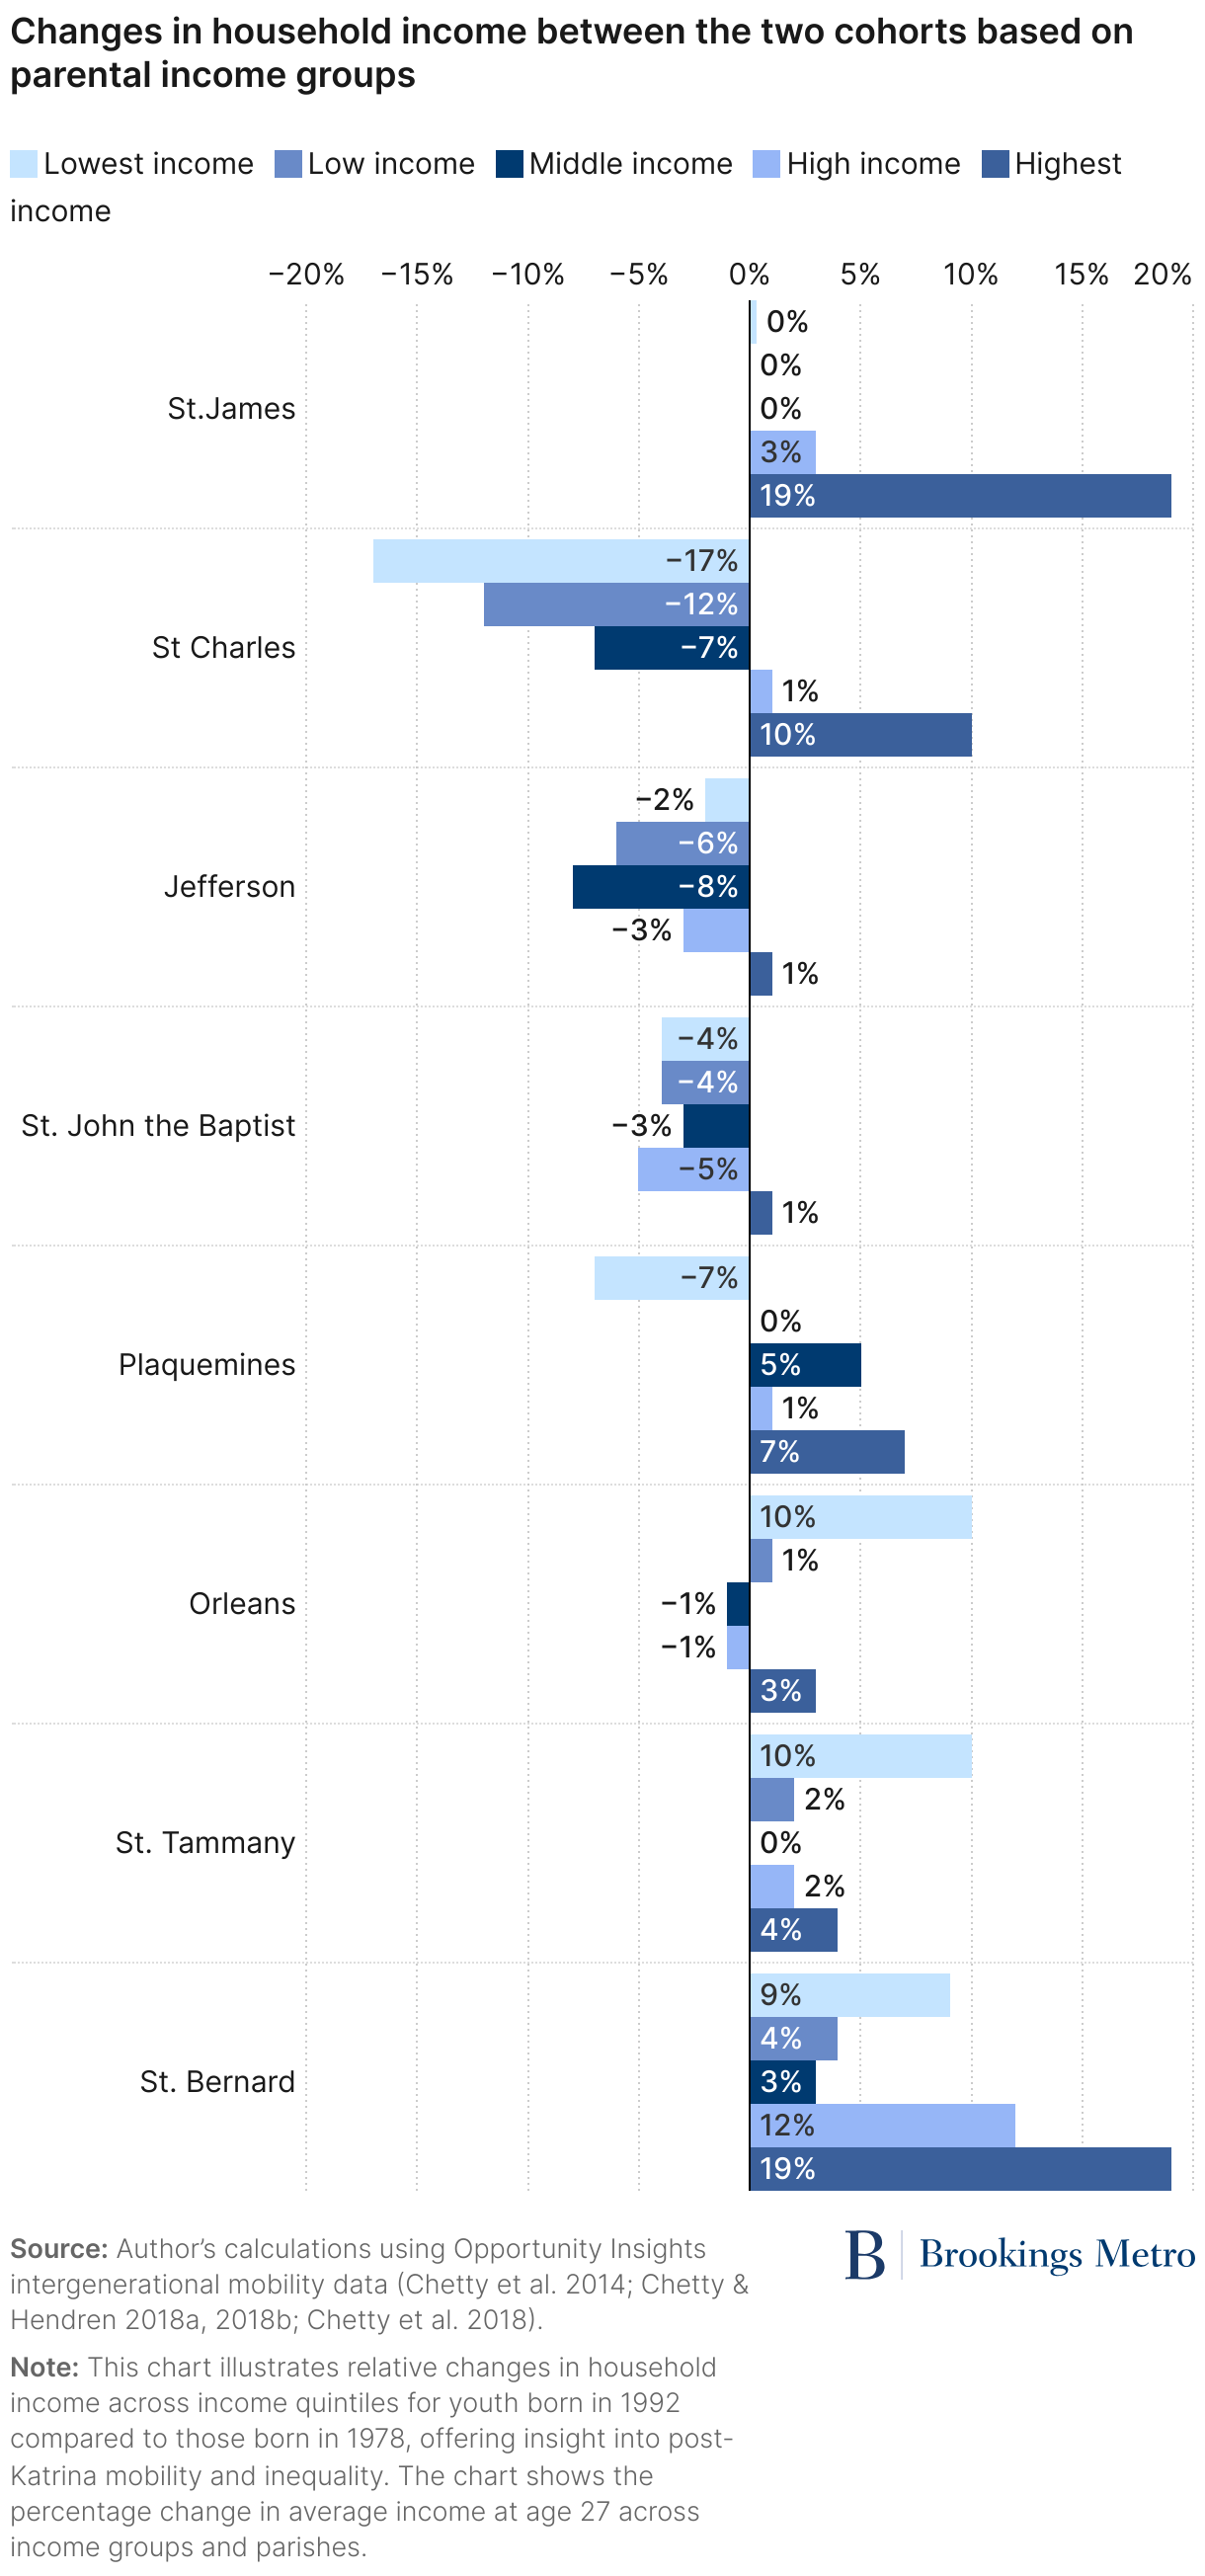
Parish-level differences
- St. Charles and Jefferson experienced sharp declines for low- and middle-income youth, while high-income youth gained. St. Charles stands out: Youth from the lowest quintile saw a dramatic 17% drop, compared to a 10% gain for the highest-income group—sharpening the post-Katrina class divide. It is worth noting that St. Charles fared better historically in terms of absolute mobility, primarily for the pre-Katrina generation. However, this changed dramatically after Katrina, as the lowest quintile experienced sharp reductions in income relative to their parents.
- Orleans Parish saw modest gains for the lowest-income youth (10%), outperforming the national average for this group. However, middle- and high-income youth stagnated or declined, suggesting that recovery efforts were uneven. Interpreting this with an absolute mobility score of 0.35—one of the lowest in the country—suggests that while some post-Katrina investments reached the poorest residents, these were limited in scale and likely not sustainable over time. The parish also ranks extremely low in terms of relative mobility, indicating strong persistence of intergenerational inequality.
- St. Bernard and St. Tammany showed broad-based mobility, with income gains across all quintiles, including low-income gains of 4% and 2%, respectively. This is consistent with moderate absolute mobility scores; though both are below the national average, their relative mobility scores are around 50th percentile, suggesting that progress is more inclusive compared to other parishes.
- St. James saw strong gains only for the highest-income group (19%), while lower-income youth remained largely flat, increasing inequality. Its low absolute and relative mobility scores align with the stagnancy in household income between the two cohorts, reinforcing the fact that economic opportunity is largely available for those already advantaged.
Unpacking the earnings gap between the two cohorts
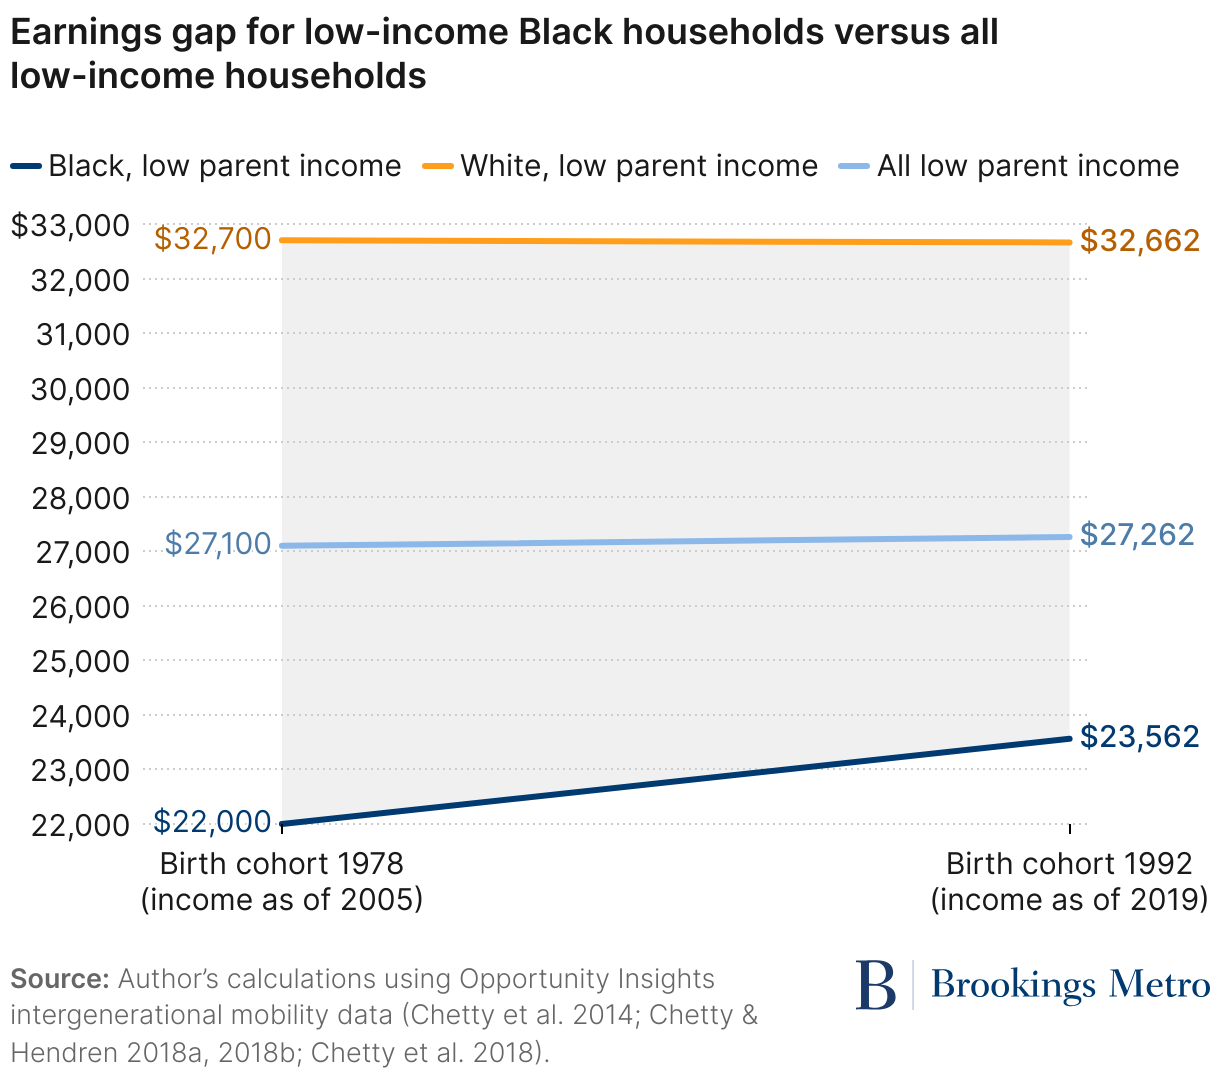
The earnings gap between low-income Black people and low-income people overall who were born in 1992 and grew up in New Orleans decreased by 27% ($1,400) compared to the earnings gap of the 1978 cohort. And the earnings gap between low-income Black people and low-income white people who were born in 1992 and grew up in New Orleans decreased by 15% compared to the 1978 cohort. This signals a step in the right direction and suggests progress toward reducing disparities for Black families despite the persistence of structural inequalities. Black low-income children see about a 7% increase in incomes across cohorts, while white incomes are essentially flat.
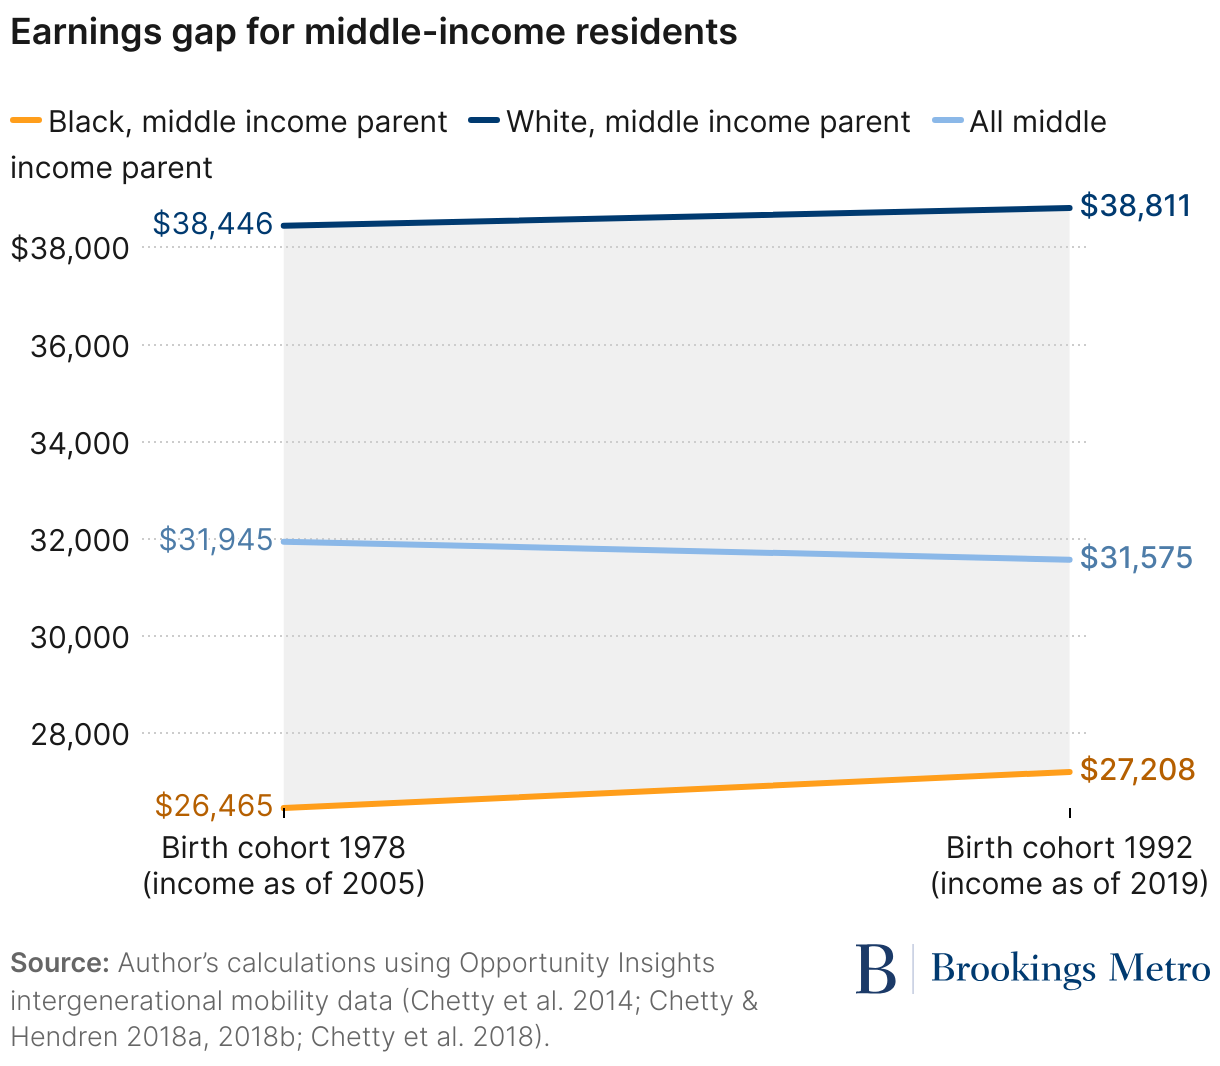
The earnings gap between middle-income Black people and middle-income people overall who were born in 1992 and grew up in New Orleans decreased by 20% ($1,100) compared to the 1978 cohort. The earnings gap between middle-income Black residents and middle-income white residents narrowed by 3%. However, white middle-class households still earned 43% more than Black middle-class households in the 1992 cohort. This indicates that racial disparities remain substantial among middle-class households.
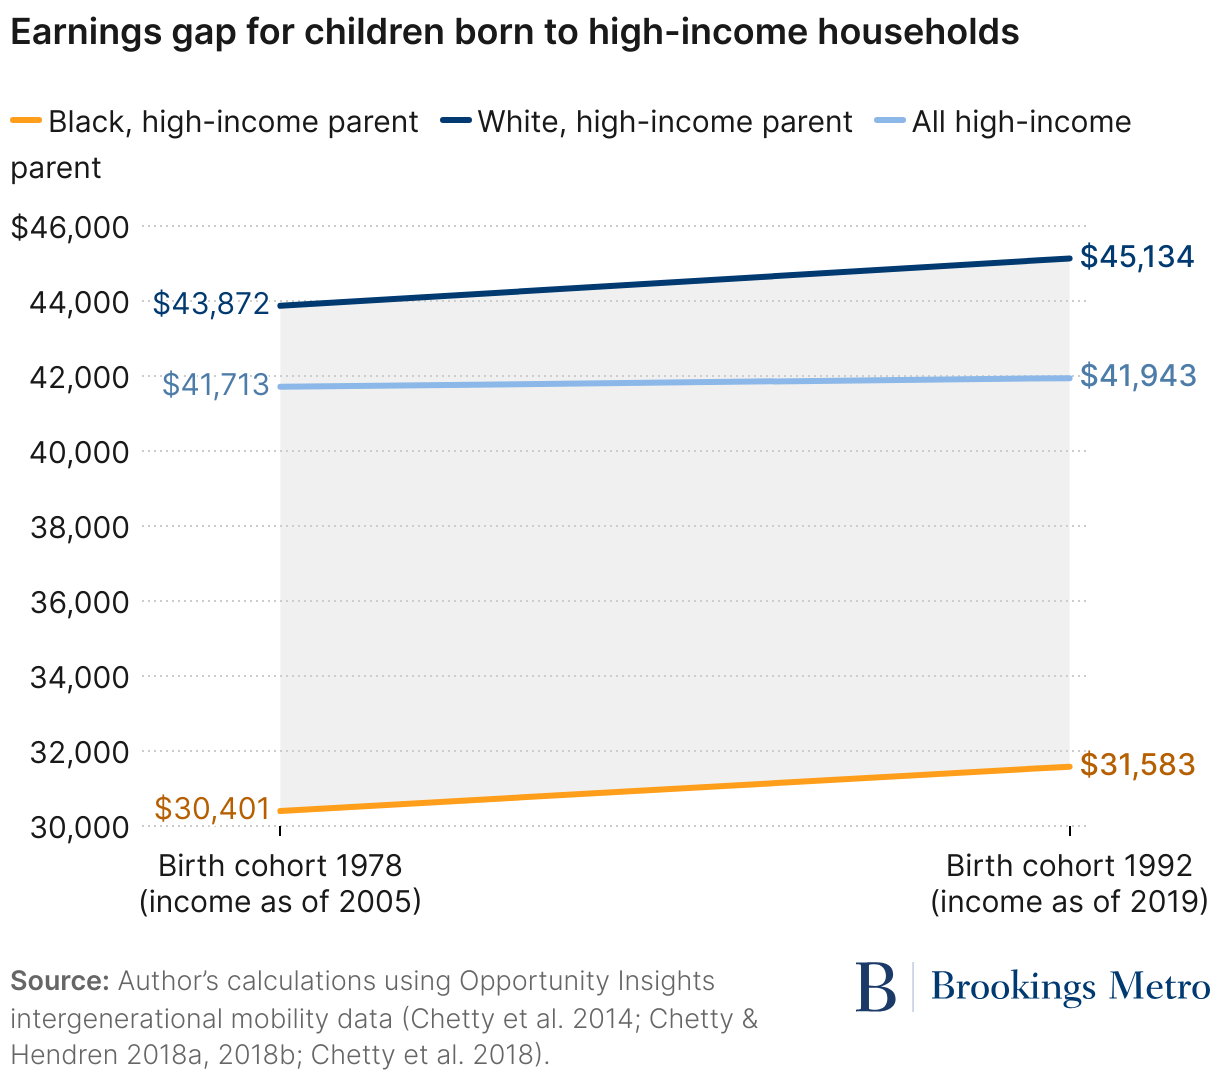
Among children from high-income families in New Orleans, Black people in the 1992 cohort earned somewhat more than those in the 1978 cohort, but the white-Black gap remains unchanged in that the average white high-income household still earned roughly 40% to 45% more than Black peers even at the top of the income distribution.
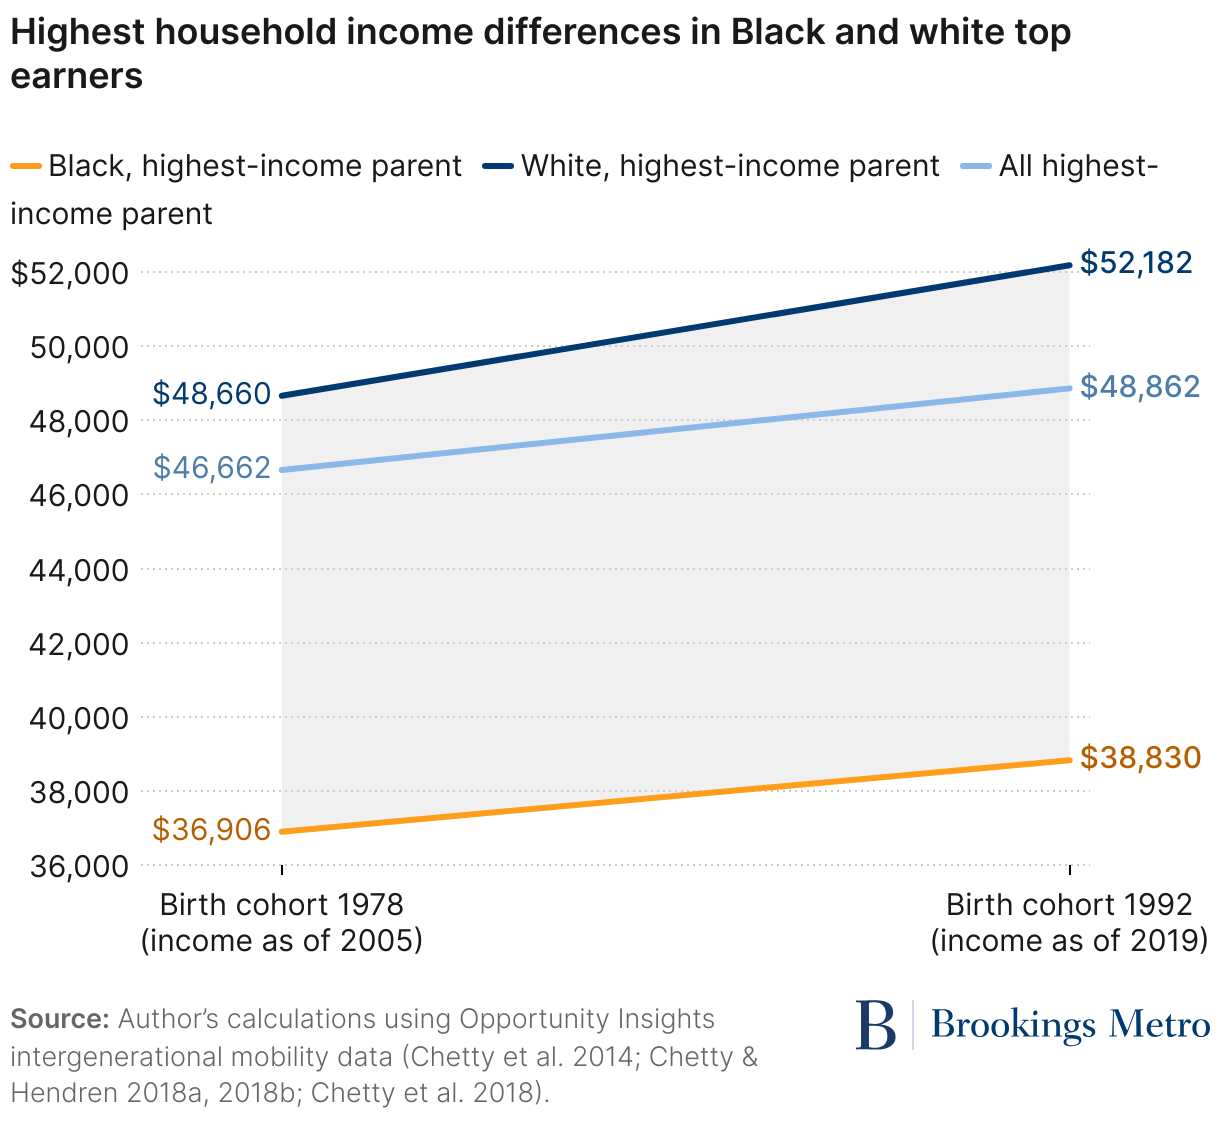
The earnings gap between highest-income Black people and highest-income white people who were born in 1992 and grew up in New Orleans increased by 14% compared to the earnings gap of the 1978 cohort. This reflects the extreme wealth gains and race disparities even for the those at the top of the income distribution.
Collectively, it is worth highlighting that Black children in the 1992 cohort did see gains compared to the 1978 cohort—across all groups, Black adults born in 1992 earned more than those in the 1978 cohort. For low-income families, the Black versus “all low-income” gap shrunk by 27%. For middle-income families, that gap shrunk by about 20%, but racial wealth gaps remain significant across all income groups. Black-white gaps have shrunk most in the low-income category but not significantly in the middle- and high-income groups. So while Black incomes have moved closer to the overall median incomes, they remain far behind white peers in similar income categories. Racial earnings gaps remain large, on the order of 40% to 45% at every level of parental income. While patterns show improvement for Black children at the bottom of the distribution, persistent structural barriers exist even for those in more advantaged households
Wealth inequality
While income mobility reflects how relative or absolute income fares across generations, it is important to also analyze wealth inequality in order to collectively explore how accumulation of assets and differences in income impact deeper and more persistent inequalities. It is also critical to understanding how and why investments must be designed such that they focus on both income and wealth disparities across class and race to make New Orleans more equitable and resilient.
Recent estimates from The Data Center’s Profile of Wealth in the New Orleans Metro shows how unequal wealth is by race. While white households make up about 54% of households in the metro area, they hold 83% of total net worth. Black households represent 34% of all households in the metro area and hold about 10% of total net worth—reflecting generational differences in asset-building and access to capital.
Policy pathways toward upward mobility
New Orleans has struggled with structural barriers to economic mobility and racial equity for decades, and many of these barriers were intensified post-Katrina. Poverty, racial and class income gaps, and geographical segregation are deeply entrenched in the region. While many policy efforts and experiments have been conducted, ranging from affordable housing initiatives to workforce development programs, the scale and coordination of these efforts has not necessarily been sufficient to generate population-level shifts in economic mobility outcomes.
The following policy proposals do not claim novelty of approach, but rather are efforts to integrate, sustain, and center communities around a framework that can boost economic mobility and growth in the region. A multidimensional policy framework that includes targeted, local investments and structural reforms needs to be developed.
Build generational wealth
Municipal baby bonds and child trust accounts are meant to act as seed capital for children from low-income families to use in adulthood for wealth-building, including higher education, homeownership, and starting a business. The idea stems from seminal work produced by economists Darrick Hamilton and William A. Darity, Jr. Their work finds that investing in baby bonds could be a significant policy effort to reduce the racial wealth gap in the country.14 In 2021, New Jersey became the first state to pass baby bond legislation, with a proposal to provide $2,000 trust accounts to every child born into Medicaid-eligible households. Adapting this in New Orleans—a region with some of the widest racial wealth gaps in the nation—could be transformative for the economic mobility of the most vulnerable residents.
Invest in Black neighborhoods without displacement
Land banking or community land trust (CLTs) are known for stabilizing neighborhoods with declining property values.15 CLTs have been successful in Washington, D.C.; Durham, N.C.; and other cities across the country. They preserve affordability, discourage speculative displacement, and build community wealth. In New Orleans, some small-scale CLTs already exist, and have merged to form initiatives such as People’s Housing+, which combined three local community organizations (Home by Hand, Crescent City Community Land Trust, and Tulane Canal Neighborhood Development Corporation). This collaboration is a model local framework that centers housing affordability. A policy initiative to expand city support for such initiatives through land donations, social-impact financing mechanisms, and technical assistance could help scale CLTs across the eight parishes.
Expand pathways to employment and business ownership
Minority entrepreneurship programs give access to capital, technical assistance, and more. Programs such as Cincinnati’s Minority Business Accelerator and the Atlanta Wealth Building Initiative can serve as role models for entrepreneurship and capital access programs in New Orleans. The city can also create business incubators and commercial real estate co-ownership blueprints for disinvested neighborhoods.
Invest in high-growth career sectors and AI-resilient career paths
As AI reshapes the global labor market, New Orleans must invest in sectoral training programs that prepare citizens for the future of work. Organizations such as Per Scholas have a demonstrated track record of success in enabling people of color to transition from low-wage to high-growth jobs in IT, cybersecurity, and software development. This initiative can be integrated at scale in programs such as those in public works to enable the community to build resilience for an AI-driven economy.
Conclusion
This analysis reveals a deeply stratified economy in New Orleans, in which place, race, and class strongly shape economic trajectories. The city ranks at the bottom of the 50 largest U.S. commuting zones for upward mobility: Just 5.1% of low-income children reach the top quintile, and their earnings are 13.4% below the national average. Relative mobility is low as well, with high persistence of inherited economic status such that 40% of adult income is linked to parental income rank—significantly higher than the national average. Post-Katrina, low-income groups in Orleans Parish saw some gains, but middle- and high-income groups stagnated. In St. Charles and Jefferson parishes, class gaps widened. Overall, the racial earnings gap increased by 45% among the top earners.
These facts cannot be viewed in isolation from the city’s historic past of redlining, exclusionary zoning, and Jim Crow—long-standing federal, state, and local policies that exacerbated the concentration of risk and poverty. In terms of resilience, these legacies increased economic and climate exposure by clustering low-income residents in high-risk areas with infrastructure deficits.
This report’s findings point to a way forward. Policymakers must focus on increasing resilience by reducing exposure and investing in climate-resilient housing infrastructure—simultaneously building capacity so that New Orleans households are resilient both to both economic and climate risks. One of the most promising strategies to break generational disadvantage in New Orleans is the implementation of municipal baby bonds (publicly funded trust accounts for children from low-income families). With mobility low and racial wealth gaps widening, baby bonds provide seed capital for key wealth-building opportunities in adulthood, such as education, homeownership, and entrepreneurship. In a city marked by deep asset poverty and structural exclusion, this policy could be transformative—shifting mobility trajectories by enabling long-term ownership, stability, and opportunity.
Author
-
Footnotes
- Fussell, Elizabeth, Narayan Sastry, and Mark VanLandingham. “Race, socioeconomic status, and return migration to New Orleans after Hurricane Katrina.” Population and environment 31 (2010): 20-42.
- https://www.opportunityatlas.org/
- Chetty, Raj, Matthew O. Jackson, Theresa Kuchler, Johannes Stroebel, Nathaniel Hendren, Robert B. Fluegge, Sara Gong et al. “Social capital I: measurement and associations with economic mobility.” Nature 608, no. 7921 (2022): 108-121.
- Chetty, Raj, and Nathaniel Hendren. “The impacts of neighborhoods on intergenerational mobility I: Childhood exposure effects.” The quarterly journal of economics 133.3 (2018): 1107-1162.
- https://opportunityinsights.org/wp-content/uploads/2018/10/atlas_slides.pdf
- Chetty, Raj. “Improving equality of opportunity: New insights from big data.” Contemporary Economic Policy 39.1 (2021): 7-41.
- Darrick Hamilton and William Darity, Jr., “Can ‘Baby Bonds’ Eliminate the Racial Wealth Gap in Putative Post-Racial America?” The Review of Black Political Economy 37, no. 3-4 (September 2010): 207-16. https://doi.org/10.1007/s12114-010-9063-1.
- Marina, Peter J. Down and out in New Orleans: Transgressive living in the informal economy. Columbia University Press, 2017.
- https://www.datacenterresearch.org/reports_analysis/on-st-tammanys-split-from-the-new-orleans-metro/
- Raj Chetty, David Grusky, Maximilian Hell, Nathaniel Hendren, Robert Manduca, and Jimmy Narang, “The Fading American Dream: Trends in Absolute Income Mobility Since 1940,” NBER Working Paper 22910 (2016), https://doi.org/10.3386/w22910.
- Raj Chetty, Nathaniel Hendren, Patrick Kline, and Emmanuel Saez, “Where Is the Land of Opportunity? The Geography of Intergenerational Mobility in the United States,” Quarterly Journal of Economics 129, no. 4 (2014): 1553–1623.
- Chetty, Raj, and Nathaniel Hendren. “The Impacts of Neighborhoods on Intergenerational Mobility II: County‑Level Estimates.” Quarterly Journal of Economics 133, no. 3 (August 2018): 1163–1228. Accessed June 26, 2025. https://opportunityinsights.org/paper/neighborhoodsii/.
- Note that for the 1978 cohort, income was measured in 2005 (before Katrina hit) so for this cohort we do not suspect income to be impacted by Hurricane Katrina compared to the 1992 cohort, whose incomes were measured in 2019.
- Damir Cosic and others, “Modeling the Impacts of a Federal Baby Bonds Program” (Washington: Urban Institute, 2024), available at www.urban.org/sites/default/files/2024-12/Modeling-a-National-Baby-Bonds-Program_0.pdf
- Ali, Omar, and Silvia Raviola. “The Effects of Community Land Trusts on Neighborhood Outcomes.” Real Estate Economics 53 (2025): 498–542. https://doi.org/10.1111/1540-6229.12525.
The Brookings Institution is committed to quality, independence, and impact.
We are supported by a diverse array of funders. In line with our values and policies, each Brookings publication represents the sole views of its author(s).