Editor’s note: An earlier version of this tracker was developed by Wendy Edelberg and Riki Matsumoto.
Monitoring international trade flows is crucial to understanding how countries and businesses react to an ever-changing trade policy landscape.
After decades of stability, 2018 marked the start of a shift in U.S. trade policy. Since then, but particularly since January 2025, there has been a sharp increase in tariffs, a tax on imports to the U.S. In response, some trading partners have imposed countermeasures, i.e., raising tariffs on U.S. exports.
To help users navigate and understand changes in trade policy and flows, this data interactive allows users to monitor changes in U.S. trade flows, tariffs applied, and traded goods prices on an ongoing basis. The tool presents data dashboards on goods and services trade, an estimate of tariffs charged (calculated duties), and imports and exports price inflation since 2015. Users have the option to overlay key U.S. trade policy actions that increased tariffs to allow them to monitor changes in the data in the context of changing tariff policies.
The tracker has three dashboards:
- Dashboard 1. Trade flows: Monthly goods trade by country, industry, and principal end-use and quarterly goods and/or services trade by country;
- Dashboard 2. Tariffs: The monthly estimated value of tariffs charged and the estimated weighted-average tariff rates by industry and country; and,
- Dashboard 3. Prices: Monthly indices of goods trade price inflation by industry and country.
This guide explains how to use the trade tracker’s dashboards and provides example applications to help users understand how to explore different aspects of trade and trade policy changes. One can additionally hover over the information icon or click on links for additional information.
Navigating the trade tracker
Step 1: Choose dashboard and tab
To switch between dashboards, use the drop-down arrow on the right-hand side of the interactive.

Some dashboards include multiple tabs for alternative data classification options or sub-indicators. The dashboards are organized as follows:
- Dashboard 1. Trade flows: U.S. goods and/or services trade
- Tab 1: Goods by country and industry
- Tab 2: Goods by end-use
- Tab 3: Goods and/or services by country
- Dashboard 2. Tariffs: Estimated tariffs collected and average tariff rates
- Tab 1: Calculated duties by industry and country
- Tab 2: Calculated average tariff rate by industry and country
- Dashboard 3. Prices: Merchandise trade price inflation by industry and country
Dashboard 1. Trade flows: The Trade flows dashboard tracks the value of goods and/or services exports from the U.S. and imports by the U.S. in billions of nominal U.S. dollars. Within the Trade flows dashboard, the “Goods by country and industry” tab displays monthly goods trade by selected industries and trade partners (based on North American Industry Classification System [NAICS]). The “Goods by end-use” tab displays monthly goods trade by principal end-use (e.g., automotives or industrial supplies) in either real (chained-2017) or nominal dollars. The “Goods and/or services by country” tab displays quarterly goods and/or services trade by country in nominal dollars. (Note: Country-specific disaggregation is not available for principal end-use data, and industry-specific disaggregation is not available for goods and services data.)
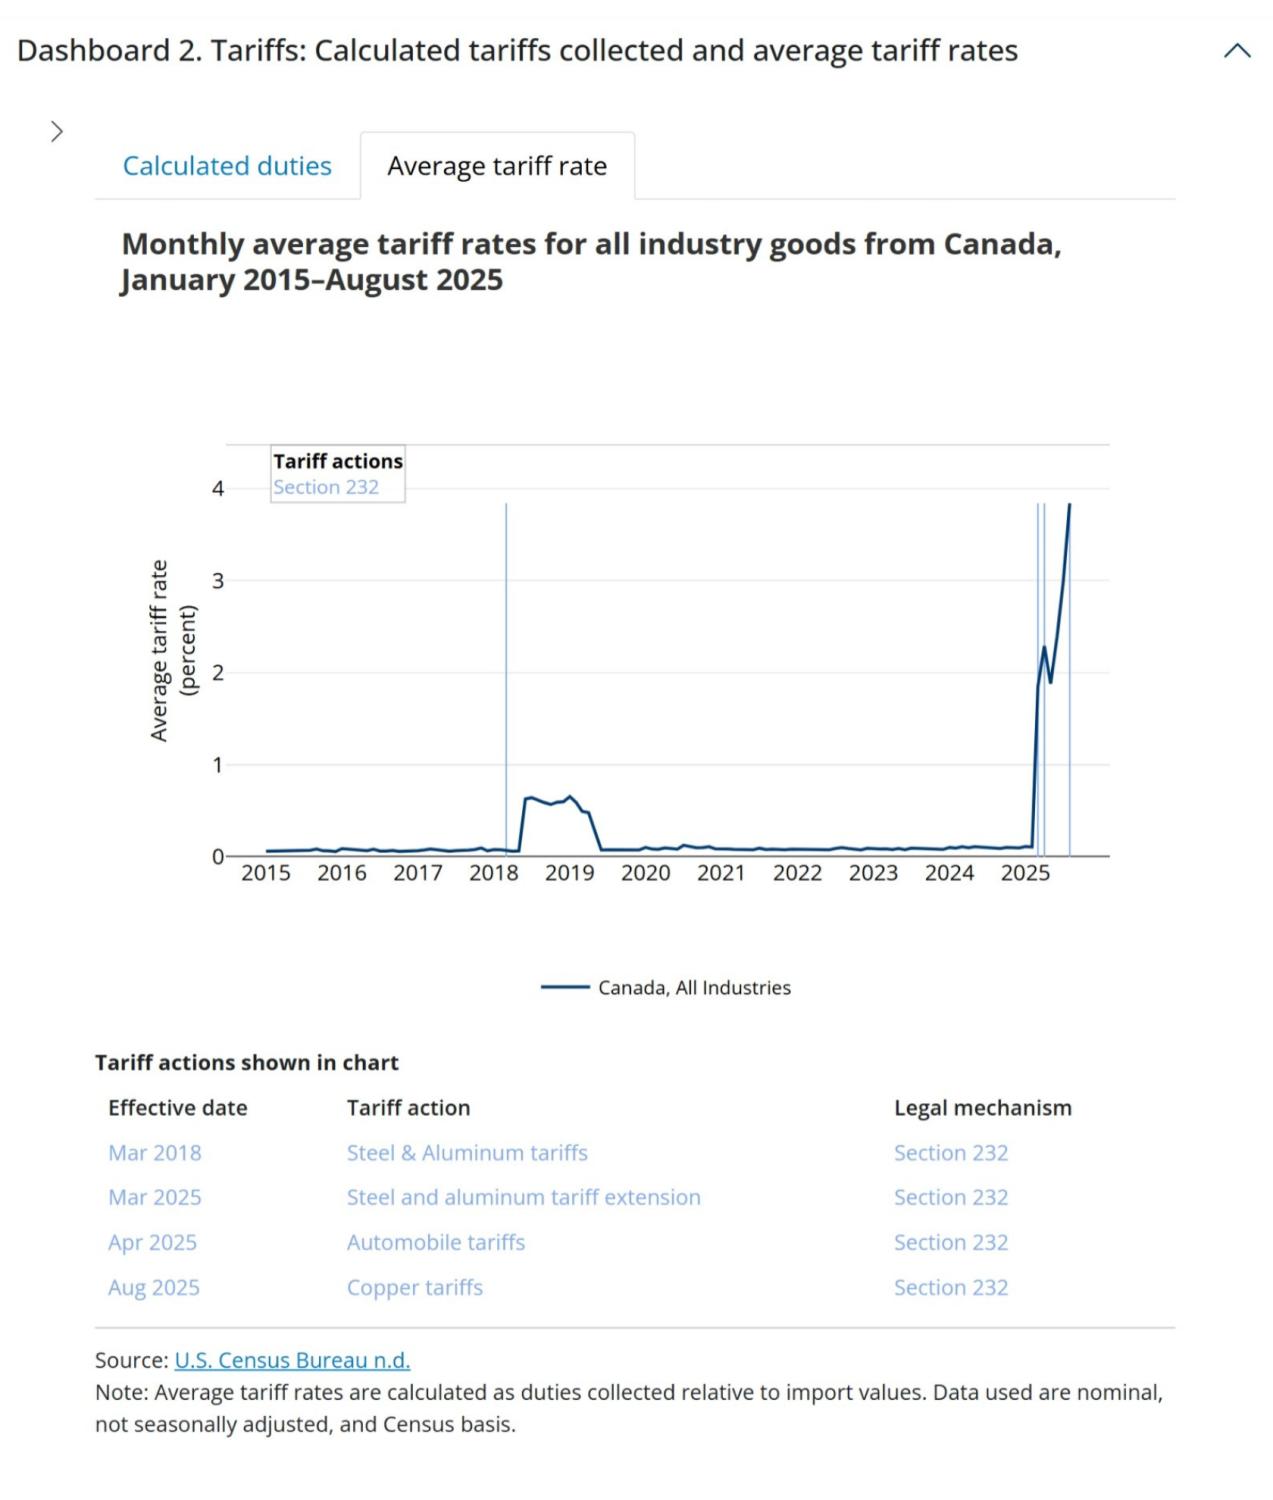
Dashboard 2. Tariffs: The Tariffs dashboard tracks calculated duties on merchandise imports and the associated calculated average tariff rates. Within the Tariffs dashboard, the “Calculated duties” tab tracks the dutiable value of imports multiplied by the applicable duty rate (see FAQ for more details on calculated duty estimates). The “Estimated average tariff rate” tab displays the calculated duties as a share of total imports for a given industry-country pair. When comparing over time, users can select a view, industries, a limited set of trade partners, and the time period. Users can also index calculated duties data to a chosen month. When comparing by year, users can select either industry or country break down and the years of comparison.
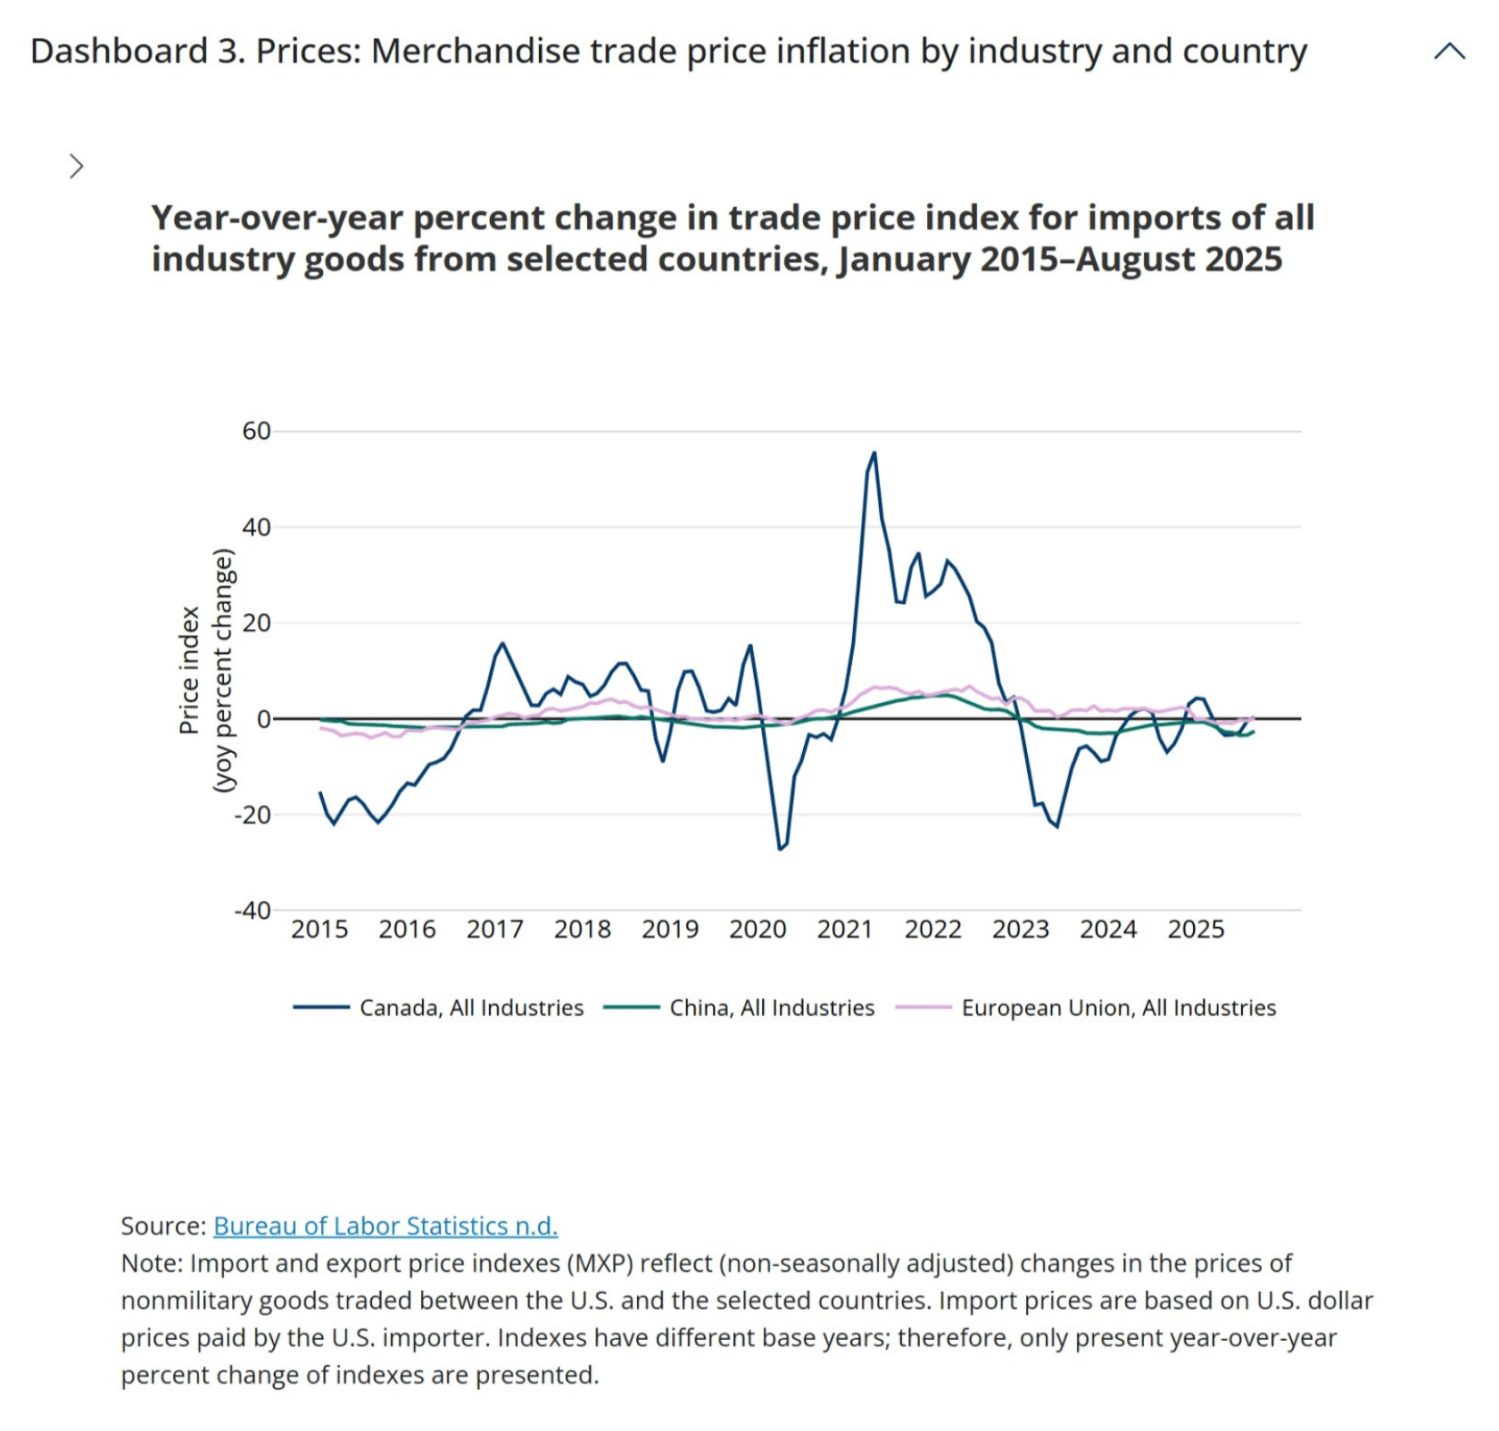
Dashboard 3. Prices: The Prices dashboard tracks the year-over-year percent change in the import and export price indexes (MXP) from the Bureau of Labor Statistics (BLS). Since the price index is presented as a year-over-year percent change, users choose between “over time” or “compare by year” views. The MXP present (non-seasonally adjusted) changes in the prices of most nonmilitary goods traded between the U.S. and the rest of the world. Works of art and selected special miscellaneous imports and exports are excluded. Import prices are based on U.S. dollar prices paid by the U.S. importer. The import and export transaction prices are generally at the foreign port and the U.S. port, respectively, and exclude import duties. Only a more limited set of industries and trade partners are available for this dataset.
Step 2: Customize data view
Click the arrow on the lefthand panel to view (or hide) options for customizing the data visualization shown on the righthand side.
Tip for screenshots: We recommend expanding the figure to full screen by closing the selection panel.
Below is a comprehensive list of all possible customizations. If an option does not appear in the left-hand panel, it is not available for the dashboard and tab that you have selected.
View
Data can be displayed in several formats:
- Over time: Monthly/quarterly (default). Shows raw values from 2015 onwards.
- Over time: Trends. Figure 1 shows 12-month (or 4-quarter) rolling sums to smooth short-term fluctuations. Figure 2 shows 12-month rolling sums for the calculated duties tab and 12-month rolling averages for the average tariff rate tab.
- Over time: Year-over-year. Shows year-over-year percentage change compared to the same month (quarter) in the previous year.
- Compare by year. Shows raw values at monthly (quarterly) intervals across multiple years, with each year shown as a separate line. For selected views in the Trade flows and Prices dashboards, users must choose a single comparison dimension (“Break down by”), such as country or industry. The break down mode chosen allows users to compare multiple selections for that indicator, holding the other indicator fixed.
- Composition of trade. Breaks down the composition of the selected trade flow by industry, country, or end-use category into shares of the total value of the selected trade flow. Shares are the share across the full selected time period. For monthly goods trade by country and industry, users must choose to “break down by” either country or industry. This view is only available for imports and exports in dashboard 1.
Flow
For the Trade flows dashboard, select imports, exports, or balance (exports minus imports). For the Prices dashboard only imports and exports are available.
Industry
Select an industry as defined by the North American Industry Classification System (NAICS), which groups establishments by similar economic activities for goods or services. It employs a six-digit coding system: The first two digits indicate the sector, the third marks the sub-sector, the fourth the industry group, the fifth the NAICS industry, and the sixth the national industry.
The tracker presents NAICS categories disaggregated at levels two and three. Industry breakdowns are available for the “Goods by country and industry” tab of the Trade flows dashboard, the Tariffs dashboard, and the Prices dashboard.
Note: The agriculture industry classification used here follows the Census definition of agriculture, not the USDA/WTO definition.
Trade partner
Select among the available trading partners. For the Trade flows and Tariffs dashboards, the top trading partners from each region are available. The selected trading partners represent over 95 percent of trade. For the Prices dashboard, all countries with available data from BLS are available. Users can find more information about area groupings (such as ASEAN) here.
Start date
Data are available starting in January 2015.
End date
In the Trade flows dashboard, the composition of trade tab allows users to select an end date in order to view the composition during a specific time period. The default is through the most recent data.
Type
The “Goods and/or services by country” tab in the Trade flows dashboard allows users to select goods, services, and/or total trade (goods and services).
Break down by
For compare by year and composition of trade views with multiple dimensions, users must select a break down dimension. Selecting “Industry” allows users to see multiple industries for a single selected country, and selecting “Country” allows users to see multiple countries for a single selected industry. For the Goods and/or services by country tab in the Trade flows dashboard, selecting “Type” when comparing by year allows users to see trade disaggregated into goods, services, and total for a select country, while selecting “Country” allows for the selection of multiple trading partners for either goods, services, or total trade.
Index to
For most over time views, users can index the data series to a specific month. This helps compare series on different scales or track changes relative to a chosen starting point. Dates which have a value of zero are excluded as index date options.
Display tariff actions
When viewing monthly data over time, users can choose to display markers indicating the month in which selected trade policy actions that raised tariffs went into effect. These markers are date indicators only. Once selected, they appear on all charts, regardless of whether the data shown in the figure are actually affected by the tariff actions selected. In other words, the markers do not adjust based on the specific industries, products, or countries included in the data being displayed.
The available policy actions are grouped by the legal authority under which the tariffs were imposed:
- Section 201 of the Trade Act of 1974 allows the president to impose duties on particular industries when surges in imports are found to threaten or harm a U.S. industry.
- Section 301 of the Trade Act of 1974 targets unfair trading practices by specific countries; tariffs apply to selected products from those countries.
- Section 232 of the Trade Expansion Act of 1962 allows the president to restrict imports on specific industries if they are found to threaten or impair national security.
- The International Emergency Economic Powers Act (IEEPA) authorizes the president to regulate imports during a declared emergency; it has been used by the Trump administration to raise tariffs at the country level.
- Bilateral deals are agreements which may include tariff reductions on select goods. These deals are displayed if tariff rate changes have been implemented.
The tracker organizes these actions by legal authority—each is represented by a different color—and the table below the figure lists the included tariff actions. Hover over the top of any marker to view details of the corresponding tariff action.

- For a list of events included in the tracker, click “download tariff actions” in the tracker.
- Other Brookings publications offer more information on trade policy actions:
- For up-to-date tracking of both announcement and implementation dates of U.S. tariff actions, countermeasures, and country-specific agreements, click here.
- For a tracker of the litigation affecting U.S. tariff actions, click here.
Note: The tracker shows the first month in which each selected tariff action took effect but is not a comprehensive list of all tariff updates, carve-outs, or retaliations. To view the full set of actions associated with each event, download the accompanying table. Tariff actions are updated through the most recent month of Census Bureau data.
Applications for the trade tracker
Dashboard 1 applications
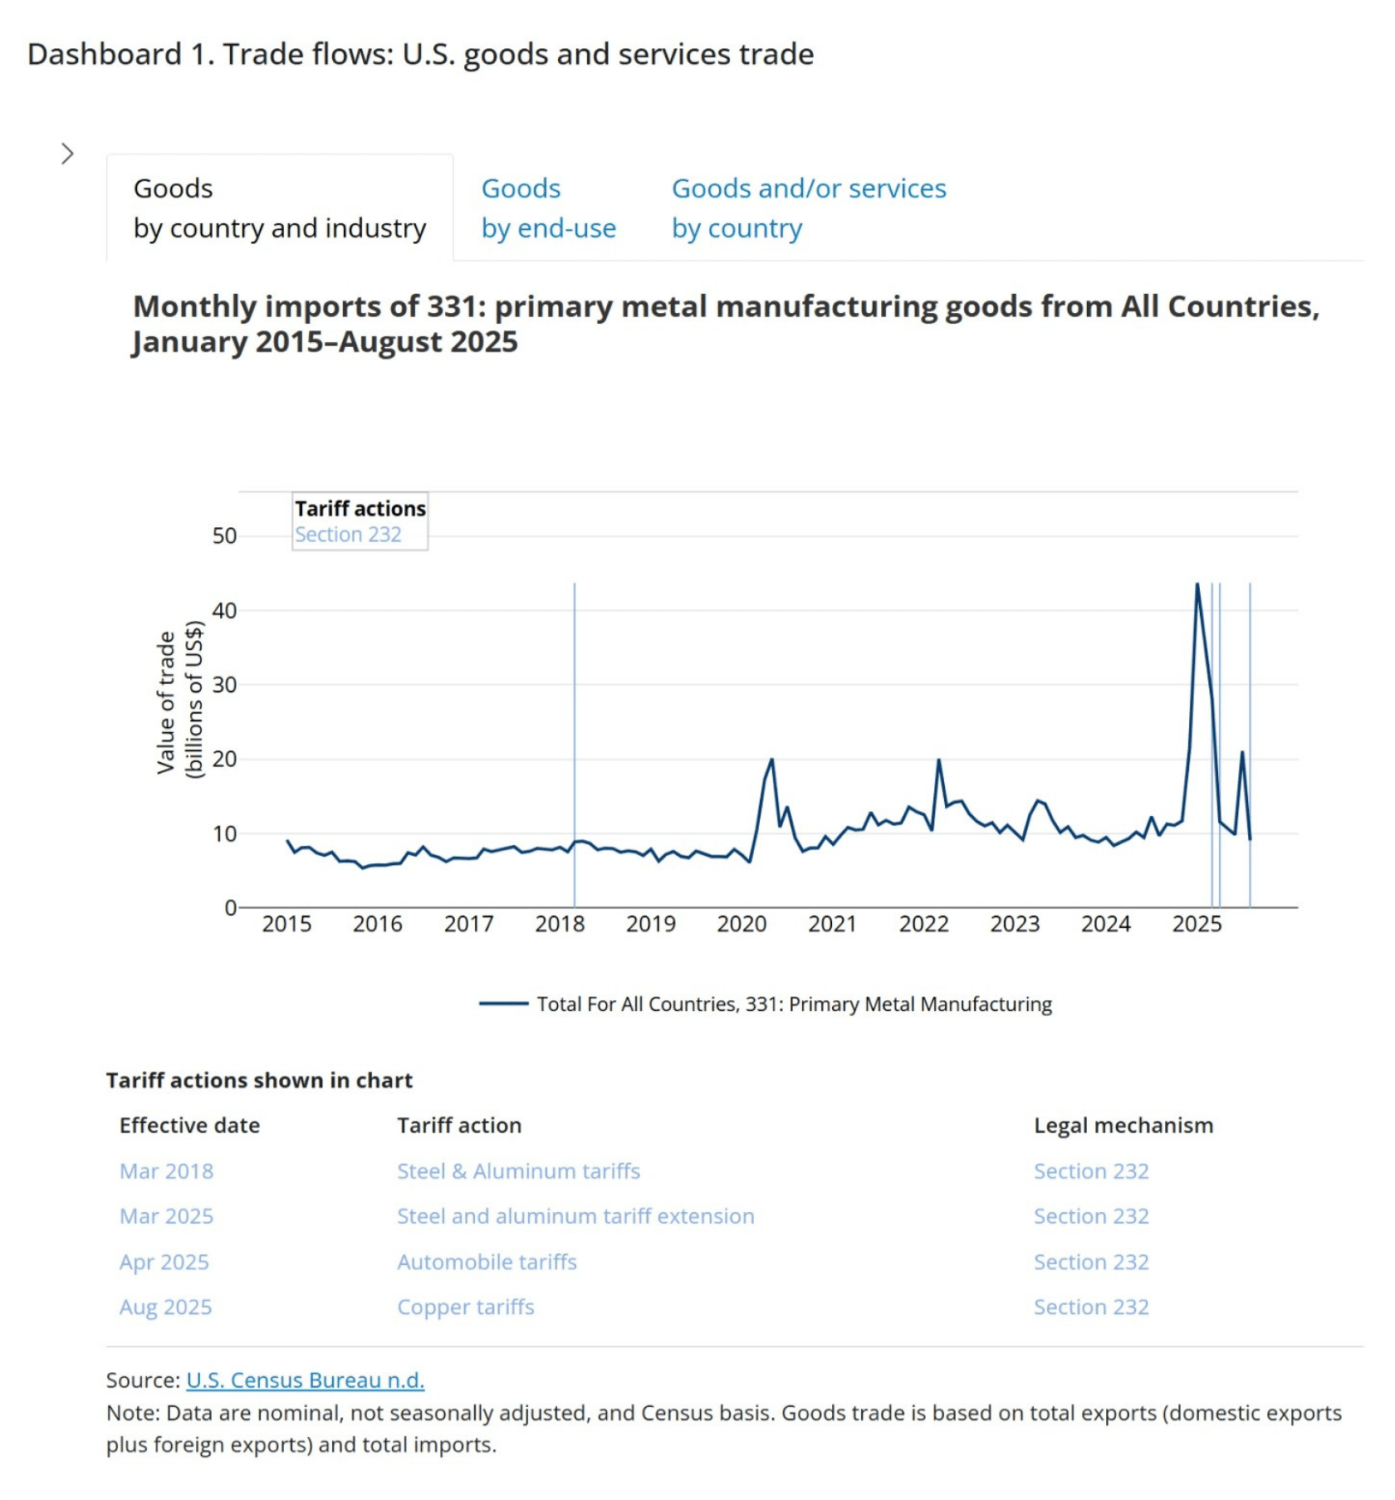
The chart below uses the tariff actions feature to show how trade flows in primary metal manufacturing responded to Section 232 tariff actions covering metal products. Selecting the industry “Primary Metal Manufacturing” for all countries and selecting Section 232 tariff actions reveals a sharp increase in imports in January 2025 to $43.7 billion ahead of the implementation of 232 tariffs on steel and aluminum, more than a four-and-a-half-fold increase from the prior January ($9.5 billion). A similar surge occurred before copper tariffs took effect in August of 2025.
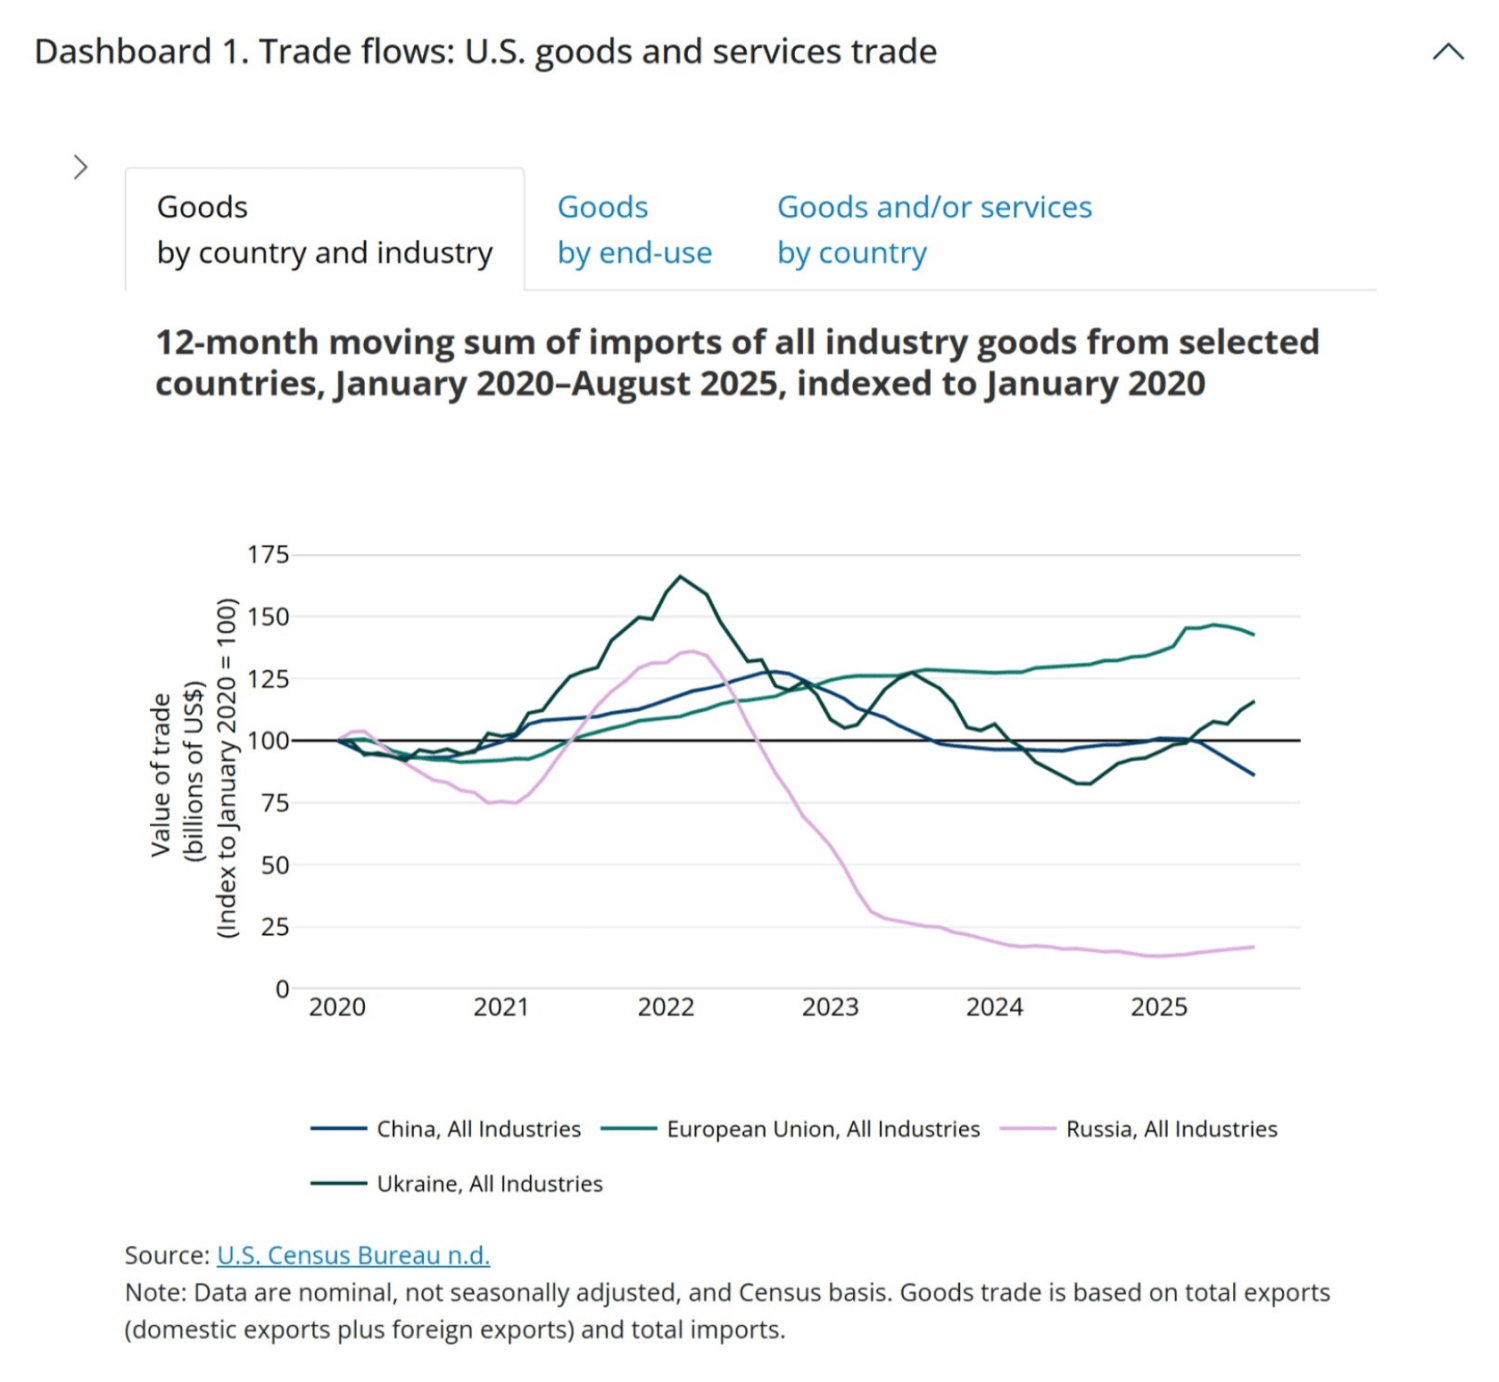
The chart below illustrates how the trends over time view and the indexing feature can be used to compare patterns of trade patterns across countries. It shows 12-month moving sums of imports from China, Russia, the EU, and Ukraine, indexed to January 2020. While imports value from the EU and China far exceeds that of Russia and Ukraine, indexing places them on a comparable scale, making the trends easier to evaluate.
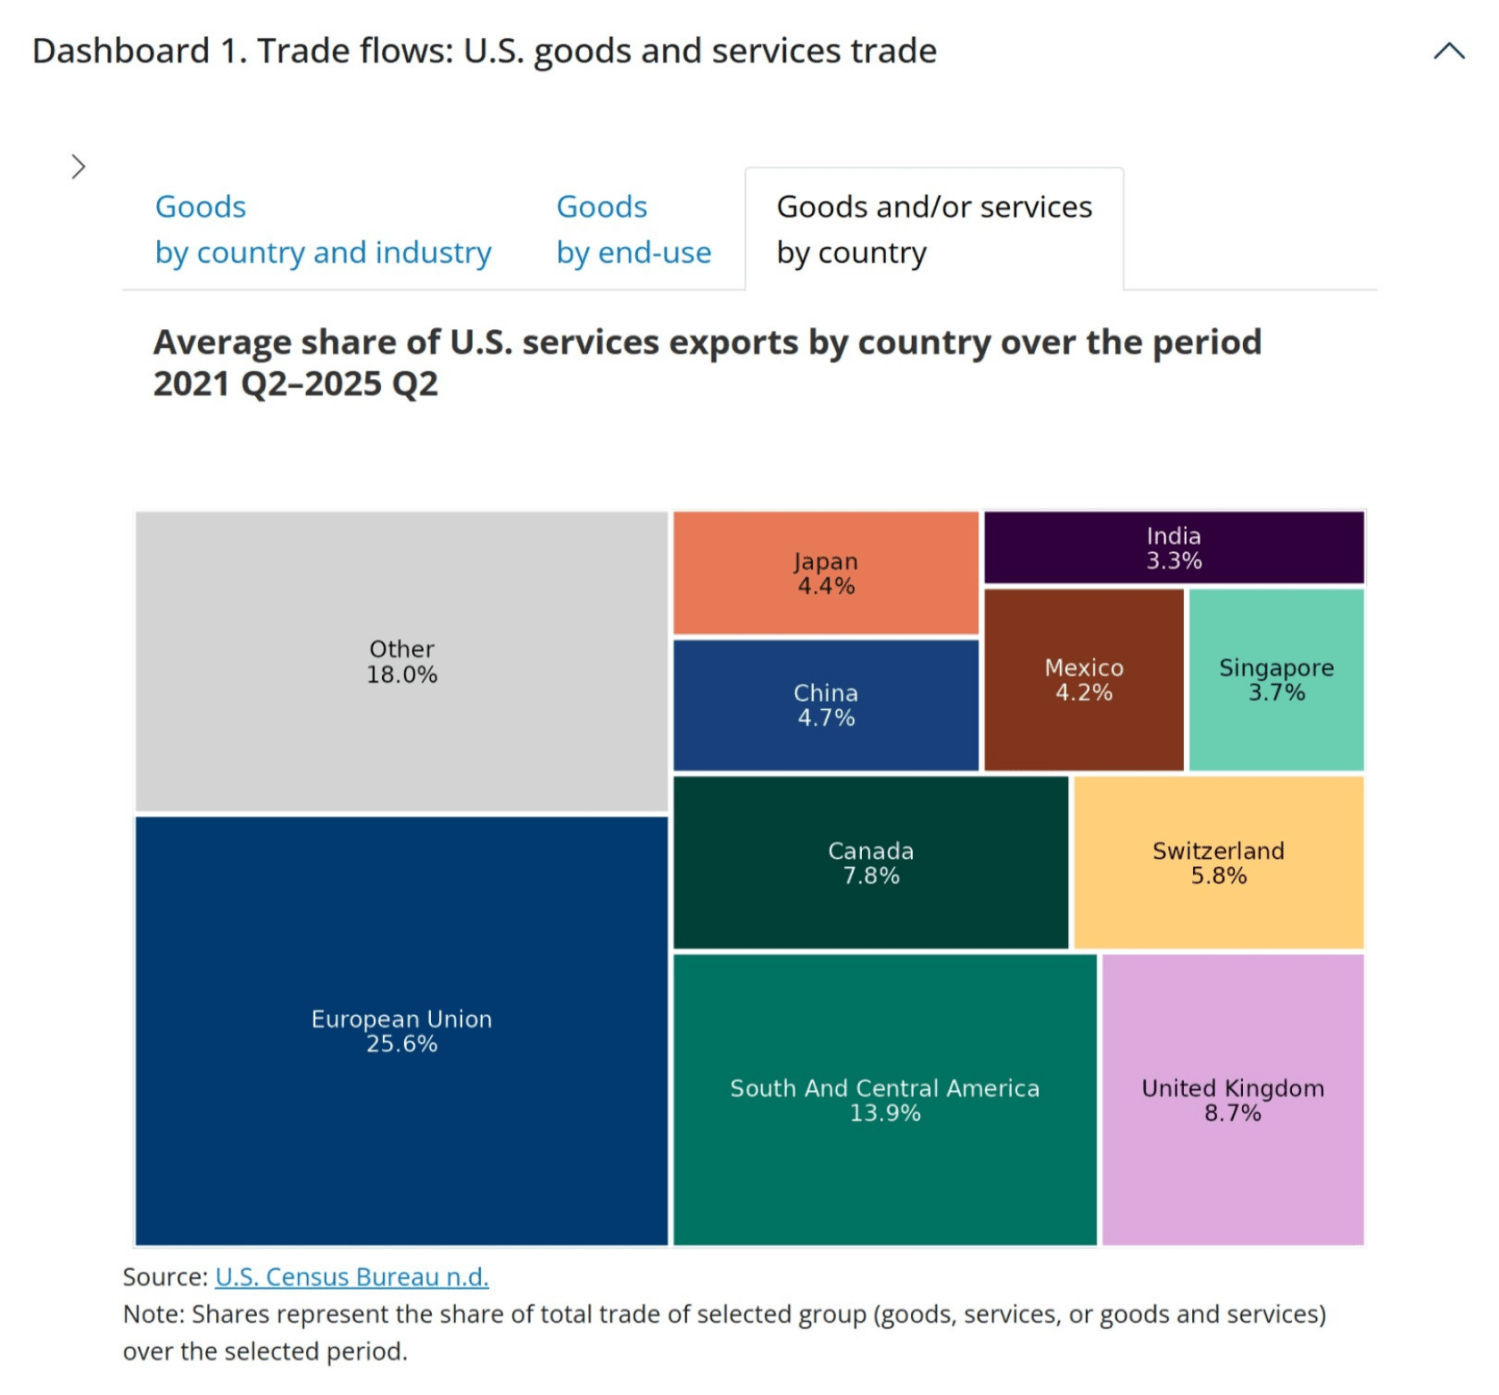
Users can also explore the makeup of trade by industry, country, or principal end-use using the “composition of trade” view option. The treemap below shows the distribution of total U.S. services exports value across partner countries for 2021–2025Q2.
Dashboard 2 applications
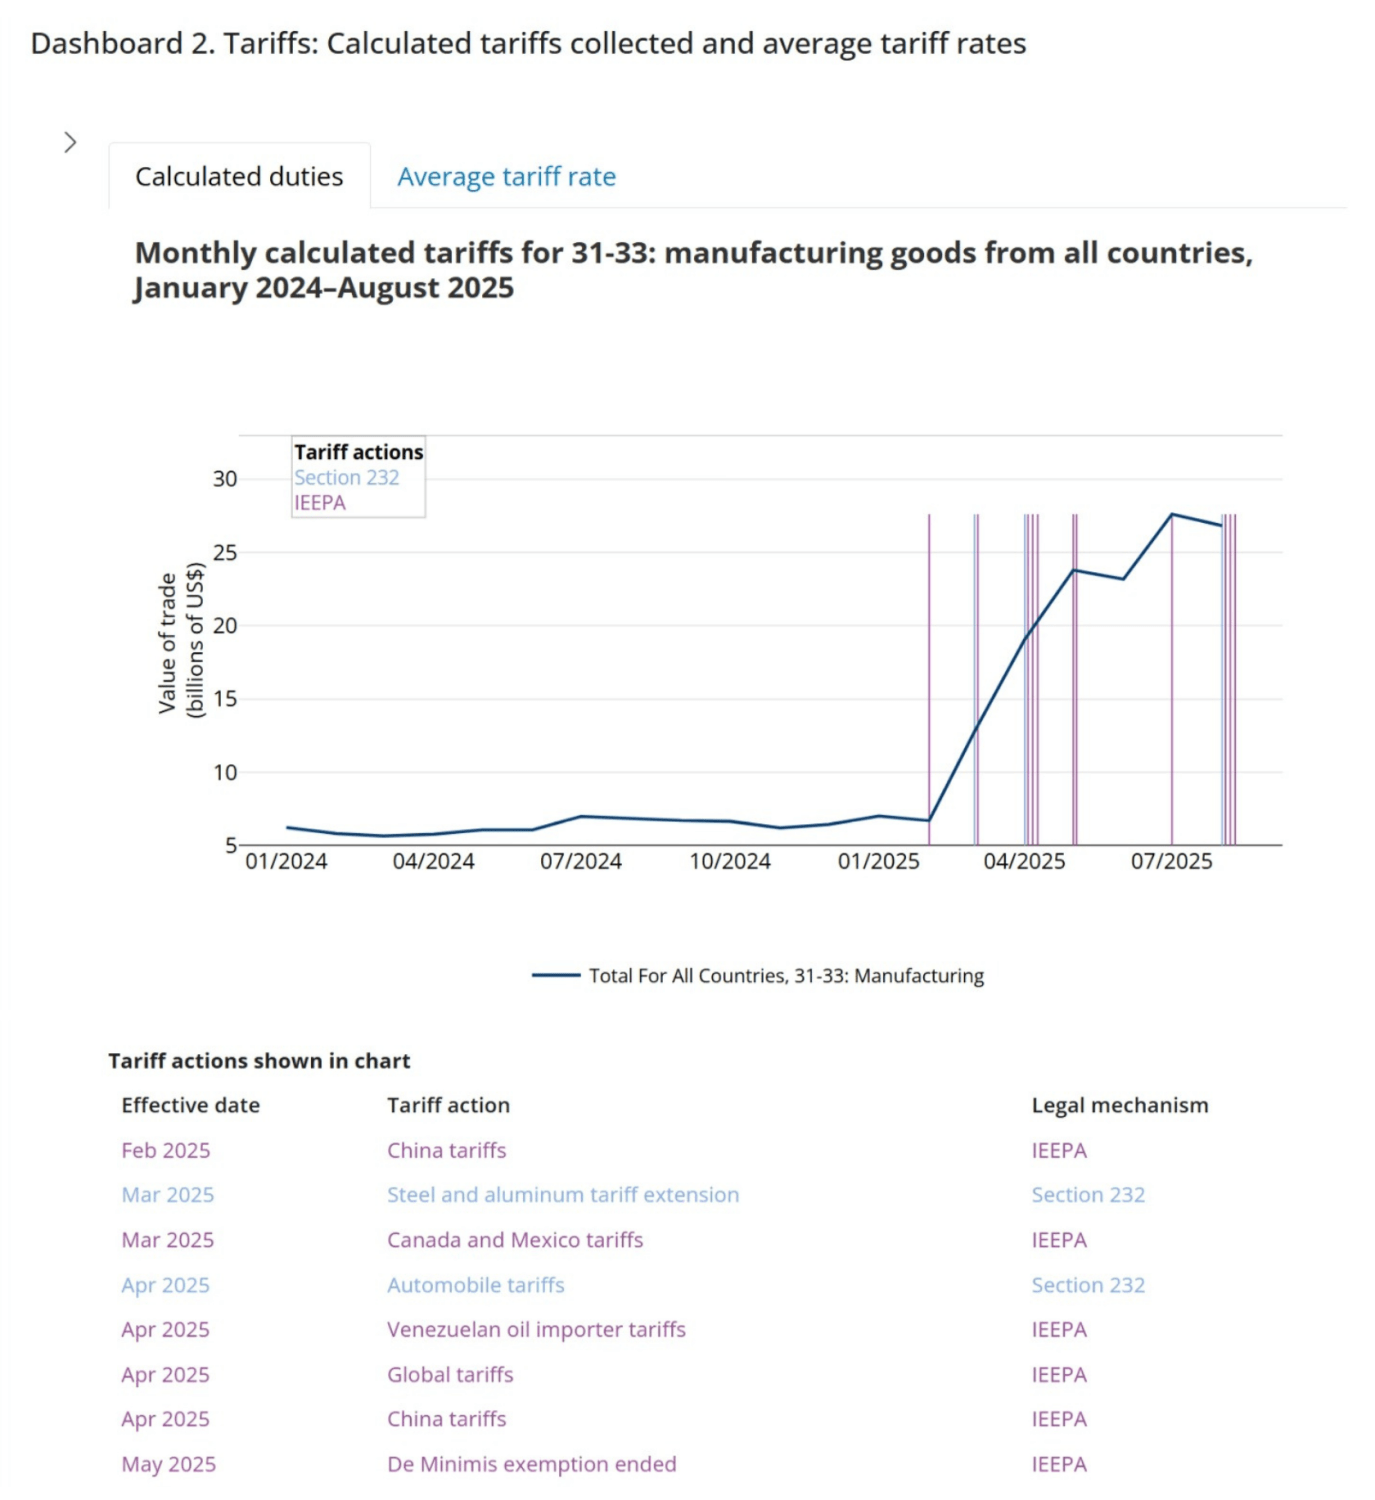
The chart below displays calculated duties, an estimate of actual duties charged. These values are generated by multiplying the applicable tariff rate by the customs value of imports. When the manufacturing industry and all countries are selected, the series highlights the estimated effect of tariff actions on duty collections. The pronounced jump in the data in 2025 reflects the implementation of IEEPA and Section 232 tariffs.
The chart below plots the estimated average tariff rate (ATR), calculated by dividing calculated duties by the customs value of imports. As shown in the figure, Canada’s ATR rises sharply in 2018 when Section 232 tariffs on steel and aluminum were imposed. The ATR drops after Canada was exempted from these tariffs in May 2019 but spikes again in 2025, when tariffs on Canadian imports were raised under IEEPA, Section 232 tariffs on steel and aluminum were reimposed on Canada, and new Section 232 tariffs went into effect for copper and autos.
Dashboard 3 applications
Price indexes in dashboard 3 allow users to compare price volatility across countries and industries. Notably, the percent change in the trade price index for Canada has been much more volatile than for other major partners (such as the EU and China).
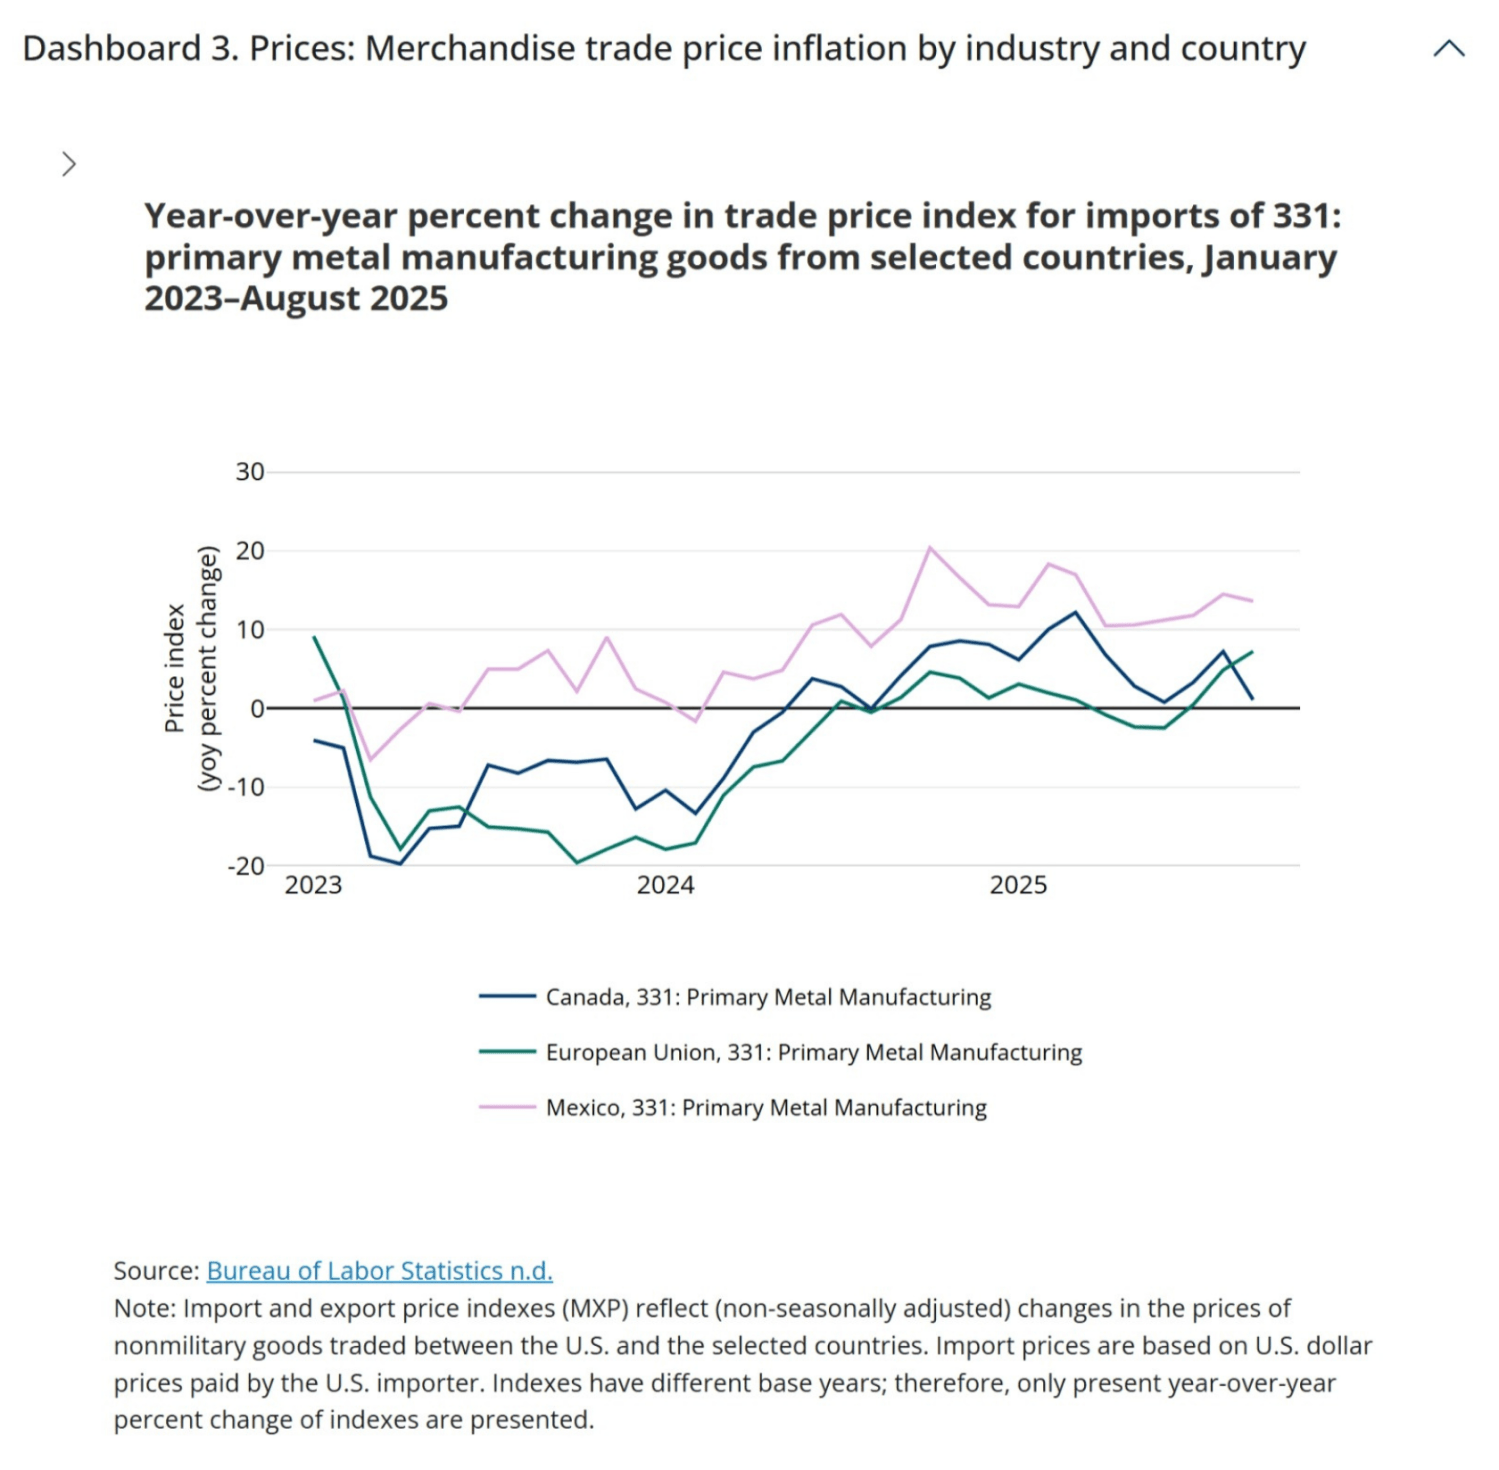
Users can zoom in to view recent changes in import and export price inflation by industry and country. For example, selecting “Primary Metal Manufacturing” for Mexico, Canada, and the EU beginning in January 2023 highlights an uptick in import price inflation in early 2025.
FAQ
How frequently will these data update?
The data will be updated monthly. Updates to dashboards 1 and 2 will follow the International Trade in Goods and Services (FT-900) release. Dashboard 3 will be updated when the BLS Export/Import Price Index is released. The tools make few adjustments to the federally collected data; we calculate year-over-year percent changes and the 12-month and 4-quarter rolling sums. These data are downloadable and can be used for secondary analysis.
Which figures/datasets are seasonally adjusted or nominal?
The dashboard 1 “Goods by end-use” tab is seasonally adjusted and available in both real and nominal terms. All other data are nominal and non-seasonally adjusted.
How are goods on a U.S. Census basis different from a balance of payments (BOP) basis?
As per the U.S. Census Bureau explanation, “goods on a Census basis are adjusted by the U.S. Bureau of Economic Analysis to goods on a BOP basis to bring the data in line with the concepts and definitions used to prepare the international and national accounts. Broadly, the adjustments include changes in ownership that occur without goods passing into or out of the customs territory of the United States. These adjustments are necessary to supplement coverage of the Census basis data, to eliminate duplication of transactions recorded elsewhere in the international accounts, and to value transactions according to a standard definition.”
What is calculated duty?
Calculated duties are the estimated import duties collected. They are calculated by the Census Bureau by multiplying the dutiable value of imports—the Customs value of foreign merchandise imported into the United States that is subject to a duty—with the applicable duty rate(s) as defined by the Harmonized Tariff Schedule of the United States Annotated for Statistical Reporting Purposes (HTSUSA). The Census Bureau notes that the calculated duty may over- or understate the amount of duty paid.
How does the U.S. Census Bureau generate NAICs classified trade data?
As per the U.S. Census Bureau, the statistics are initially collected and compiled in terms of approximately 8,000 commodity classifications in Schedule B, Statistical Classification of Domestic and Foreign Commodities Exported from the United States for exports and the approximately 14,000 classifications in the HTSUSA for imports. The HTSUSA and Schedule B classifications are rearranged and summarized into the NAICS system.
Where can I find a glossary of terms?
Users can find a glossary of U.S. Census international trade related terms here.
How are data revised?
Census revises the prior three years of data annually in June. Additionally, each month, the published FT900 tables have revised estimates for the prior month’s total export and import estimates, as well as exports to Canada. USA Trade Online and the Census API do not include monthly revisions until the annual revisions are posted. This tracker displays data from the Census API which includes revisions through 2024 and represent the current official trade statistics for the United States. For more information click here.
-
Acknowledgements and disclosures
The authors thank Matthew Aks, Jared Bernstein, Sarah Bianchi, John Corrigan, Patricia Kim, Wendy Edelberg, Dozie Ezi-Ashi, William Shpiece, and especially Aviva Aron-Dine and Lauren Bauer for insightful feedback. Tia Cole and Eileen Powell provided excellent research assistance. An earlier version of this tracker was developed by Wendy Edelberg and Riki Matsumoto, with thanks to Lauren Bauer and Robin Brooks for insightful feedback, Eileen Powell for excellent research assistance, and Marie Wilken for production support. This tool is a work in progress. Please contact [email protected] if you have questions or suggestions.
The Brookings Institution is committed to quality, independence, and impact.
We are supported by a diverse array of funders. In line with our values and policies, each Brookings publication represents the sole views of its author(s).


