The Federal Reserve conducts monetary policy by setting a target range for the federal funds rate, the interest rate at which banks borrow and lend to each other overnight. However, the federal funds rate by itself does not directly affect most firms and households in the economy. Instead, monetary policy is transmitted to the broader economy by affecting financial conditions more generally, including the longer-term interest rates at which businesses and households borrow, the exchange value of the dollar, and the prices of key assets such as equities and real estate.
It is thus important to assess how these broader financial conditions are affected by the Fed’s monetary policy decisions. The purpose of this post is to measure that effect and to summarize it with a simple benchmark that should prove useful both for assessing the stance of monetary policy and forecasting economic activity.
The Fed’s financial conditions index
Because the economy depends on a range of financial measures, some researchers have relied on a financial conditions index (FCI) to summarize these effects in a simple manner. Several such measures have become prominent in recent years.1 Here we focus on the most recent one to be released, described in a research note by several staff members at the Federal Reserve Board (Ajello et al., 2023).
The Federal Reserve Board’s FCI is notable because it is derived using the Fed’s principal model of the U.S. economy, known as FRB/US, as well as other models used by Fed staff. The Fed’s FCI summarizes the combined effects on the economy of seven financial variables (the federal funds rate, the ten-year Treasury yield, the mortgage rate, the triple-B corporate bond yield, a broad stock market index, a house price index, and the nominal broad dollar index), using FRB/US to measure the relative importance of each of these variables in determining GDP growth.
One difficulty that researchers have had constructing FCIs is that the economy responds to financial conditions with a lag, with potentially different lags for different financial instruments. Unlike some of the other available FCIs, the Board’s measure takes these lagged effects into account. In particular, the Fed’s FCI accounts not only for the effects of current movements in financial variables, but also the effects of earlier changes in financial variables on current GDP growth, as measured by FRB/US.
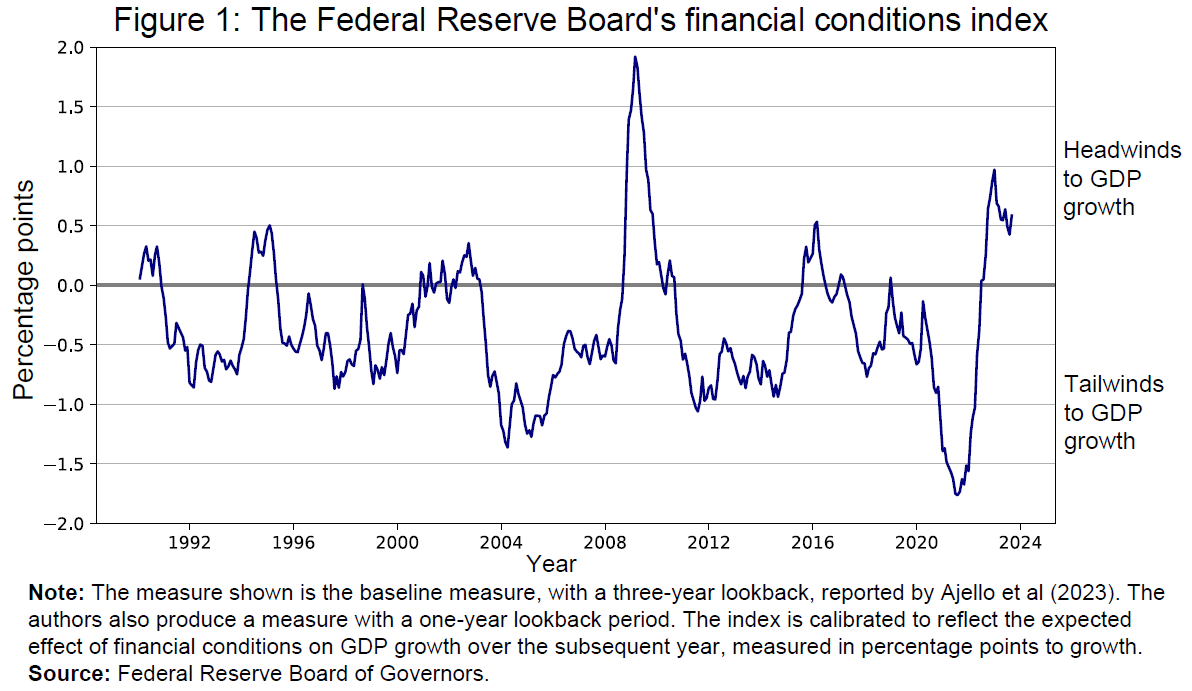
Overall, this measure provides a useful summary of the extent to which financial conditions are influencing economic activity at any point in time, shown in Figure 1. Readings above zero indicate the degree to which current and past changes in financial conditions would be expected to restrain growth over the subsequent year, measured in units of GDP growth. Readings below zero correspondingly indicate the degree of support to growth over the subsequent year.
Mapping monetary policy to financial conditions
The path of the FCI can be influenced by a range of economic and financial market developments, and much of its variation over the sample reflects the influence of factors other than monetary policy. However, hidden within those dynamics, one should expect the level of the federal funds rate and its expected path to have had meaningful effects on the FCI. If that were not the case, then monetary policy would have little traction on the economic system.
To try to measure these effects, we use a novel dataset constructed by Swanson and Jayawickrema (2023), which reports the movements of interest rates over narrow windows of time around key communications from the Federal Reserve (FOMC statements, press conferences, minutes releases, and speeches by the Fed Chair and Vice Chair). By looking at very short periods around Fed announcements, the Swanson-Jayawickrema dataset plausibly captures changes in financial variables that are due to Fed actions and communications. Here we focus on the movements in the two-year Treasury yield, which should be particularly sensitive to shifts in the expected path of the policy rate. We add together the monetary-policy-induced movements in the two-year Treasury yield over each month, which allows us to compare these movements to the Fed’s FCI (which is monthly).
Having a monthly measure of policy-induced changes in the two-year Treasury yield allows us to assess how the Fed’s FCI reacts to monetary policy. Specifically, we estimate a two-variable regression equation (technically, a vector autoregression, or VAR) that includes the FCI, the two-year Treasury yield, and monthly lags of both variables. By itself, the VAR can capture how the two variables move together over time, but it does not allow us to determine which variable is driving which, since both variables respond to each other every month and are also affected by a variety of outside shocks. However, using a high-frequency identification approach that is popular in much academic research and described in Bauer and Swanson (2023), we can estimate the underlying causal relationship running from monetary policy to the FCI.2
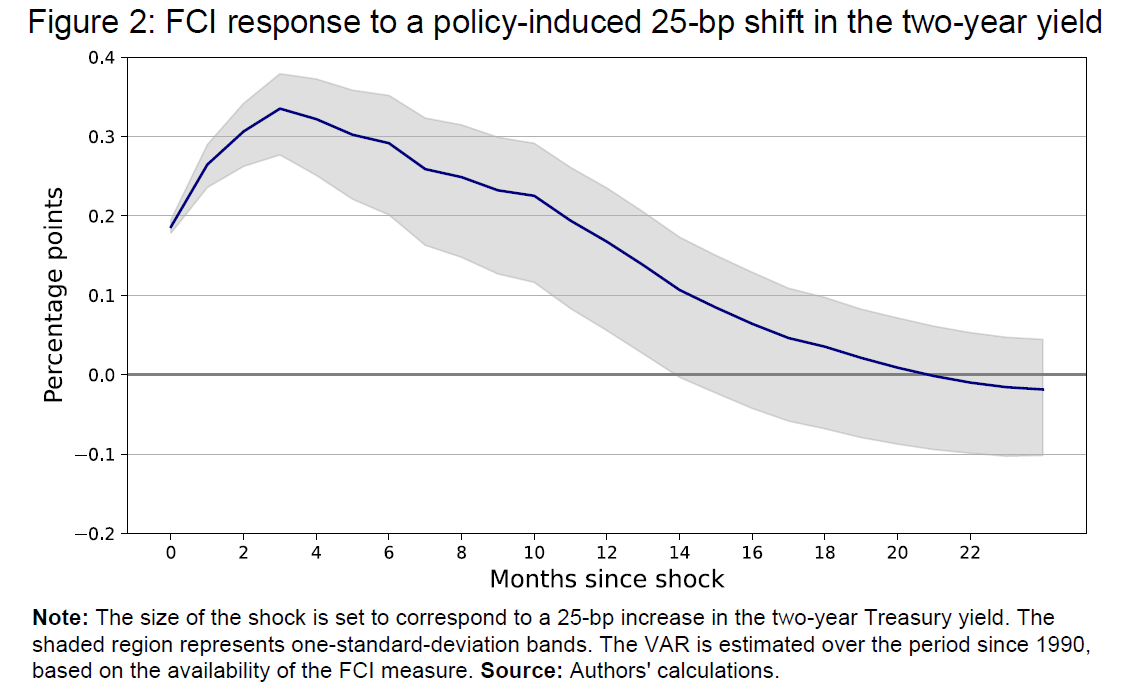
Figure 2 plots our estimated path of the FCI following a policy-induced increase in the two-year yield that we set to 25 basis points. The most important finding is that monetary policy has considerable and significant effects on the FCI. This finding indicates that the Fed has an effective policy instrument, in that setting the policy rate and communicating about its potential path has important effects on financial conditions that should affect the economy over time.
The results allow us to establish a rule of thumb that may be useful for considering the Fed’s FCI. We find that the Fed’s FCI initially tightens by 20 basis points for a 25-basis-point upward shift in the two-year yield induced by Fed communications. (Our methodology implies that these effects are symmetric, so that a downward shift in the yield has the same-sized effect on loosening the FCI.) The peak effect comes about a quarter after the policy news and is 33 basis points in magnitude. Since the FCI measure is calibrated to reflect the effects on GDP growth over the subsequent year, this finding is indicative of the anticipated effects of policy-induced two-year yield changes on the economy, at least through the lens of FRB/US.
Note that the hump-shaped response of the FCI in Figure 2 does not mean that financial markets are responding slowly to Fed policy. Recall that the Board’s FCI measure is based on current and past changes in financial variables to account for the fact that some financial variables take time to affect the economy, and thus the FCI could exhibit delayed dynamics because of the index construction itself.
Financial conditions during the recent tightening cycle
The results from our exercise can be used to assess the evolution of financial conditions during the recent tightening cycle. The Federal Reserve had lowered the target range for the federal funds rate to 0 to 25 basis point in early 2020 in response to the economic damage caused by the Covid crisis. As the economy recovered from that shock and inflation moved sharply higher, the Fed implemented an extensive tightening cycle that increased the federal funds rate by 5.25 percentage points from March 2022 to July 2023. The two-year Treasury yield began increasing in the fourth quarter of 2021 as investors anticipated the policy tightening, and it moved substantially higher over the subsequent two years, reaching levels just above 5 percent. Financial conditions tightened sharply over this period, as one might expect from such a sizable shift in monetary policy prospects.
The exercise above provides an estimate of how monetary policy influenced this change in financial conditions. Specifically, we can measure how the FCI would have been expected to evolve if the move in the two-year yield had been driven entirely by monetary policy communications. Of course, the actual increase in the two-year yield was driven by a variety of economic shocks, including ones that would presumably have different effects on the FCI than the policy news considered in our exercise.
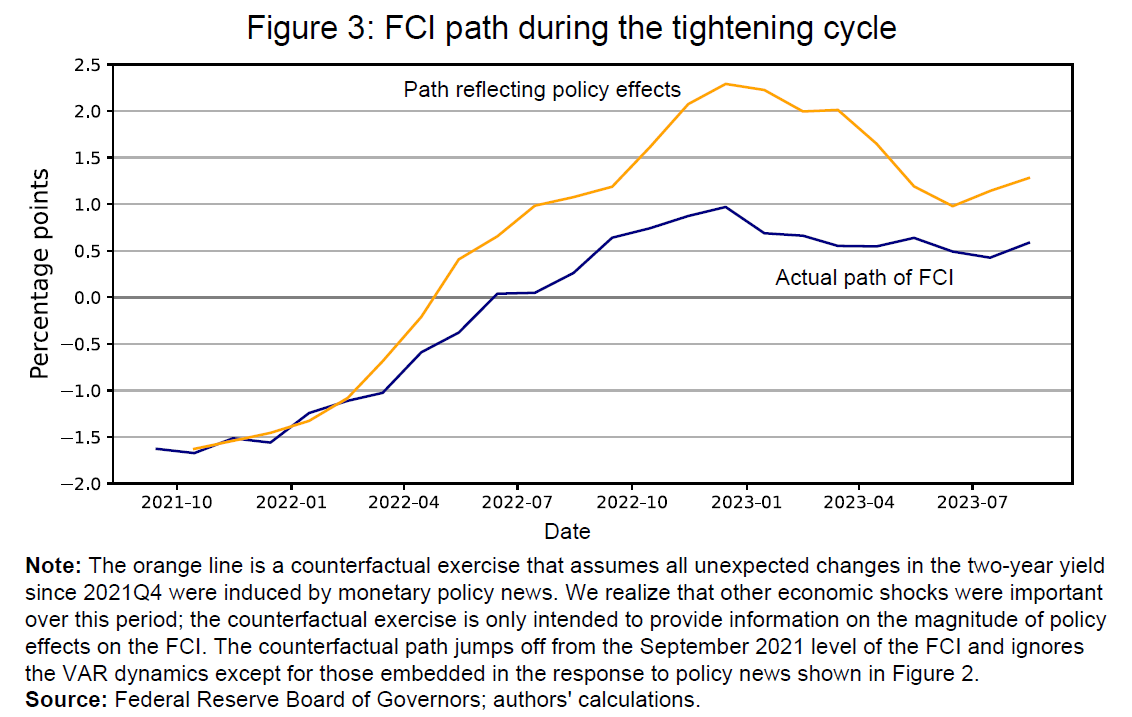
As can be seen in Figure 3, the FCI would have been predicted to increase by about 3.75 percentage points at its peak if it had been driven by monetary policy alone. The peak increase in the actual measure was 2.5 percentage points. That difference likely reflects that a meaningful portion of the movement in the two-year yield came in response to information that caused investors to raise their projected path for growth and inflation—developments that might be expected to generate a smaller amount of FCI tightening relative to a purely policy-induced change in the two-year yield.3
Both the predicted and actual FCIs had come off their peaks as of August (the last observation available for the Fed’s FCI), reflecting that the steepest increases in the two-year yield occurred long enough ago that the associated restraint from financial conditions had been fading through that point.4
Conclusion
Researchers and market participants are increasingly using FCIs in their efforts to forecast the path of economic activity, and those efforts are likely to rely heavily on the new FCI measure produced by Board staff. However, such exercises will typically require an assumption about the evolution of monetary policy. Thus, to fully assess the outlook for the economy and monetary policy prospects, one must have an estimate of how the assumed path of monetary policy will affect the FCI.
This post presents evidence that the Fed’s FCI measure responds significantly to the expected path of monetary policy. Specifically, the FCI moves by 4/5 of any policy-induced shift in the two-year yield, with that effect then building to more than 1 after roughly a quarter.
References
Ajello, Andrea, Michele Cavallo, Giovanni Favara, William Peterman, John Schindler IV, and Nitish Sinha (2023). “A New Index to Measure U.S. Financial Conditions,” FEDS Notes, June 30, 2023, https://www.federalreserve.gov/econres/notes/feds-notes/a-new-index-to-measure-us-financial-conditions-20230630.html.
Bauer, Michael, and Eric Swanson (2023). “A Reassessment of Monetary Policy Surprises and High-Frequency Identification,” NBER Macroeconomics Annual, 37, 87–155.
Gertler, Mark, and Peter Karadi (2015). “Monetary Policy Surprises, Credit Costs, and Economic Activity,” American Economic Journal: Macroeconomics 7, 44–76.
Ramey, Valerie (2016). “Macroeconomic Shocks and Their Propagation,” Handbook of Macroeconomics 2A, 71–162.
Stock, James, and Mark Watson (2012). “Disentangling the Channels of the 2007–09 Recession,” Brookings Papers on Economic Activity, Spring, 81–135.
Stock, James, and Mark Watson (2018). “Identification and Estimation of Dynamic Causal Effects in Macroeconomics Using External Instruments,” Economic Journal 128, 917–948.
Swanson, Eric, and Vishuddhi Jayawickrema (2023). “Speeches by the Fed Chair Are More Important than FOMC Announcements: An Improved High-Frequency Measure of U.S. Monetary Policy Shocks,” unpublished manuscript, University of California, Irvine, https://sites.socsci.uci.edu/~swanson2/papers/hfdat.pdf
Brian Sack was the Director of Global Economics for the D. E. Shaw group through early 2023. He was formerly executive vice president at the Federal Reserve Bank of New York, where he served as the head of the Markets Group and the manager of the System Open Market Account from 2009 to 2012. Eric Swanson is a Professor of Economics at the University of California, Irvine and a former Senior Economist at the Federal Reserve Board and a Senior Research Advisor at the Federal Reserve Bank of San Francisco.
-
Acknowledgements and disclosures
The authors thank Ben Bernanke and David Wessel for very helpful comments and suggestions.
-
Footnotes
- Examples include the Federal Reserve Bank of Chicago’s National Financial Conditions Index, the Bloomberg U.S. Financial Conditions Index, and the Goldman Sachs U.S. Financial Conditions Index.
- Technically, following Bauer and Swanson (2023), we use monetary-policy-induced changes in the two-year Treasury yield as an instrument to identify the causal effects of monetary policy changes in our VAR. Other papers that have used similar measures to identify the effects of monetary policy in a VAR include Stock and Watson (2012, 2018), Gertler and Karadi (2015), and Ramey (2016).
- An increase in the two-year yield associated with stronger growth prospects would tend to affect FCI by less because the growth outlook would support risky asset prices. An increase associated with higher inflation prospects could also affect FCI by less than a policy-induced shift because real interest rates are shifting by less, although we would still expect such increases to tighten FCI meaningfully. Inflation-related news was probably particularly important over this period.
- Financial conditions have likely tightened again since August, including the tightening induced by the recent rise in the term premium. The magnitude of this tightening will become apparent once the Fed updates its measure. Our exercise could be used to determine the policy response (or the policy-induced change in the two-year yield) that would be necessary to offset that tightening.
The Brookings Institution is committed to quality, independence, and impact.
We are supported by a diverse array of funders. In line with our values and policies, each Brookings publication represents the sole views of its author(s).




Commentary
The impact of Federal Reserve policy on the Fed’s financial conditions index
October 18, 2023