


Policymakers have understood for decades that there is a place-based component to poverty, and that poverty reduction requires economic development interventions that do more than just serve individuals or families. Geographically concentrated poverty causes unique harm that goes beyond the individual experience of poverty, worsening all kinds of community outcomes, including for residents of poor neighborhoods who are not poor themselves.
However, we have not yet figured out an effective federal policy response. Even though the share of the U.S. population experiencing poverty was very similar in 2000 and 2020, the number of poor places has grown by 25%, and with it the number of people who are exposed to these harms (Figure 1). While less than 12% of Americans are poor, 44% of Americans live in low-income communities, a plurality (40%) of which are in the South, and a majority (76%) of which are located outside of the urban core (Figures 4 and 5).
Historically, federal researchers have characterized “poverty areas” as those with 20% or more residents below the poverty threshold. The statutory definition of low-income communities (LICs) created for the New Markets Tax Credit begins with the same threshold. However, these places are characterized not just by lower levels of income, but by local economies and built environments that are under-developed because of limited public investment and lack of access to private capital. Changing these economic and environmental conditions can reduce poverty without displacing residents. Therefore, incentivizing investment to solve the capital access challenge has been a core goal of economic and community development policymakers for generations.
Federal, state, and local governments have made many efforts to attract private capital to LICs for economic and community development. Many of these policies and programs focus on housing, such as mortgages under the Community Reinvestment Act (CRA) or the Low-Income Housing Tax Credit (LIHTC). Among the programs intended to support efforts beyond housing, two that have moved significant private capital are the New Markets Tax Credit (NMTC) and the Opportunity Zone (OZ) program. The NMTC (which has a congressional volume cap) has moved $74.7 billion since 2001, while OZs (for which there is no cap) accumulated $89 billion in property just between 2018 and 2022. However, each program is characterized by significant design flaws that reduce its efficacy and efficiency at increasing opportunity in LICs. The current authorizations of these programs end in 2025 and 2026, respectively, so this is the time to take a fresh look at how the federal government can maximize the impact of public policy—particularly through tax incentives—to increase investment in LICs.
This report presents key findings from a qualitative research project to investigate how the design of place-based programs to move capital to LICs can be improved. We scanned the existing literature and conducted additional analysis. We conducted three focus groups and additional individual interviews with practitioners working in LICs who have used the NMTC, OZ funds, or both to learn how these programs function in practice and what the pain points are, and to gain practitioners’ perspectives on the tools they need to achieve the goal of improving conditions in LICs. Our methods are described in more detail in Appendix A.
We then propose a new program design that addresses key weaknesses of existing place-based tax incentives to achieve the goal of moving capital that is new to the market, right-sized, and priced for impact to LICs.
Understanding the New Markets Tax Credit and Opportunity Zones
The ‘what’: Each program’s stated purpose
The NMTC directs capital to real estate projects and businesses in low-income communities by connecting investors with federal tax obligations who can benefit from tax credits and provide capital through community development entities (CDEs), who then find eligible investments. The NMTC program was initially authorized by the Community Renewal Tax Relief Act of 2000, and has been reauthorized several times. The most recent renewal expires on December 31, 2025. Together with the other economic development programs such as Empowerment Zones and Renewal Communities (authorized in the same act), the NMTC was created to revitalize economically distressed communities by incentivizing private investment in businesses and developments that support a range of outcomes including workforce development, business development, and access to health care facilities. The purpose of the NMTC is to lower the risk assumed by private capital for investing in communities that are traditionally viewed as higher risk. The program has been successful at incentivizing the movement of private capital: Through 2023, every $1 in federal investment through the program has generated $8 in private investment, according to the U.S. Treasury Department.
The Opportunity Zones program, authorized by the Tax Cuts and Jobs Act of 2017, was created, as the Internal Revenue Service (IRS) puts it, to “spur economic growth and job creation in low-income communities while providing tax benefits to investors.” The program was designed to attract private investment to distressed communities while avoiding some of the bureaucracy and regulations that have restricted the scope and scale of predecessor economic development tax incentives such as the NMTC.
While the projects eligible for investment are nearly identical in both programs—real estate projects (including development and rehabilitation) and businesses where all the substantial holdings are in the qualified community—the differences in the structure and requirements of each have produced different investment flows. The programs draw from different investor pools: the NMTC from corporate investors (especially banks) with large tax liabilities, and OZs from individual investors with capital gains. Each provides a different type of financing: the NMTC brings deeper financing to a single investment, largely through subsidized debt, while OZs provide larger scale but shallower investments via patient equity capital.
Despite the stated goal of spurring economic growth and job creation, the majority (75%) of the OZ program’s Qualified Opportunity Funds (QOFs) investment is concentrated in real estate, largely residential (about 50%). By comparison, 69% of NMTC investmenthas been directed toward commercial real estate, with the rest financing non-real-estate businesses (27%) and residential real estate (less than 2%). Additionally, the centrality of the incentivized investment to project success differs across the programs, with the NMTC playing a key role in the vast majority of investors’ decisions to invest, while many projects developed with OZ fundingwould likely have proceeded without the investment.
The ‘who’ and ‘how’: Whose money, who moves it, and how
The total annual amount of tax credits to be distributed by the NMTC program is set by Congress and administered by the Community Development Financial Institutions (CDFI) Fund, a division of the Treasury Department that has substantial oversight over the program. The federal tax credit allocation flows through the CDFI Fund to the community development entities (CDEs) with winning applications in the annual allocation round. The CDEs then essentially “sell” tax credits (adding up to 39% of the original investment disbursed over seven years) to investors who make low-interest loans or equity investments, known as qualified low-income community investments (QLICIs), in qualified low-income community businesses (QALICB), which are businesses or real estate projects operating in eligible low-income communities. The tax credit investors are largely banks seeking Community Reinvestment Act (CRA) credit to fulfill their regulatory requirements, earned by providing loans or services to low- and moderate-income community members. The CDEs that manage the local disbursement of the allocations are intermediary organizations with a primary mission of serving low-income communities, and have low-income community representation on their boards, certified by the CDFI Fund. Many CDEs are mission lenders like CDFIs, but other for-profit and nonprofit financial and non-financial institutions that meet the requirements may also be certified. In the last round of NMTC allocations, approximately 200 CDEs competed, and roughly 100 received allocations. A typical NMTC project today also includes a leverage lender who adds further value to the transaction for the QALICB through below-market debt financing.
To create the actual subsidy that brings dollars to the table, New Markets Tax Credits are “sold” to someone with liability (the tax credit investor) for about 77 cents on the dollar. The discount reflects the time-value of money—as the credits are only collectable over a seven-year period—and the taxability of the roughly 33 cent change in basis. However, NMTC programmatic regulations do not allow the literal sale of the tax credits—they are not transferable. To solve this problem, practitioners have devised the complex legal structure shown in Figure 2 to structure NMTC deals through special-purpose investment funds that bring the tax credit investor and leverage lender to the same table.
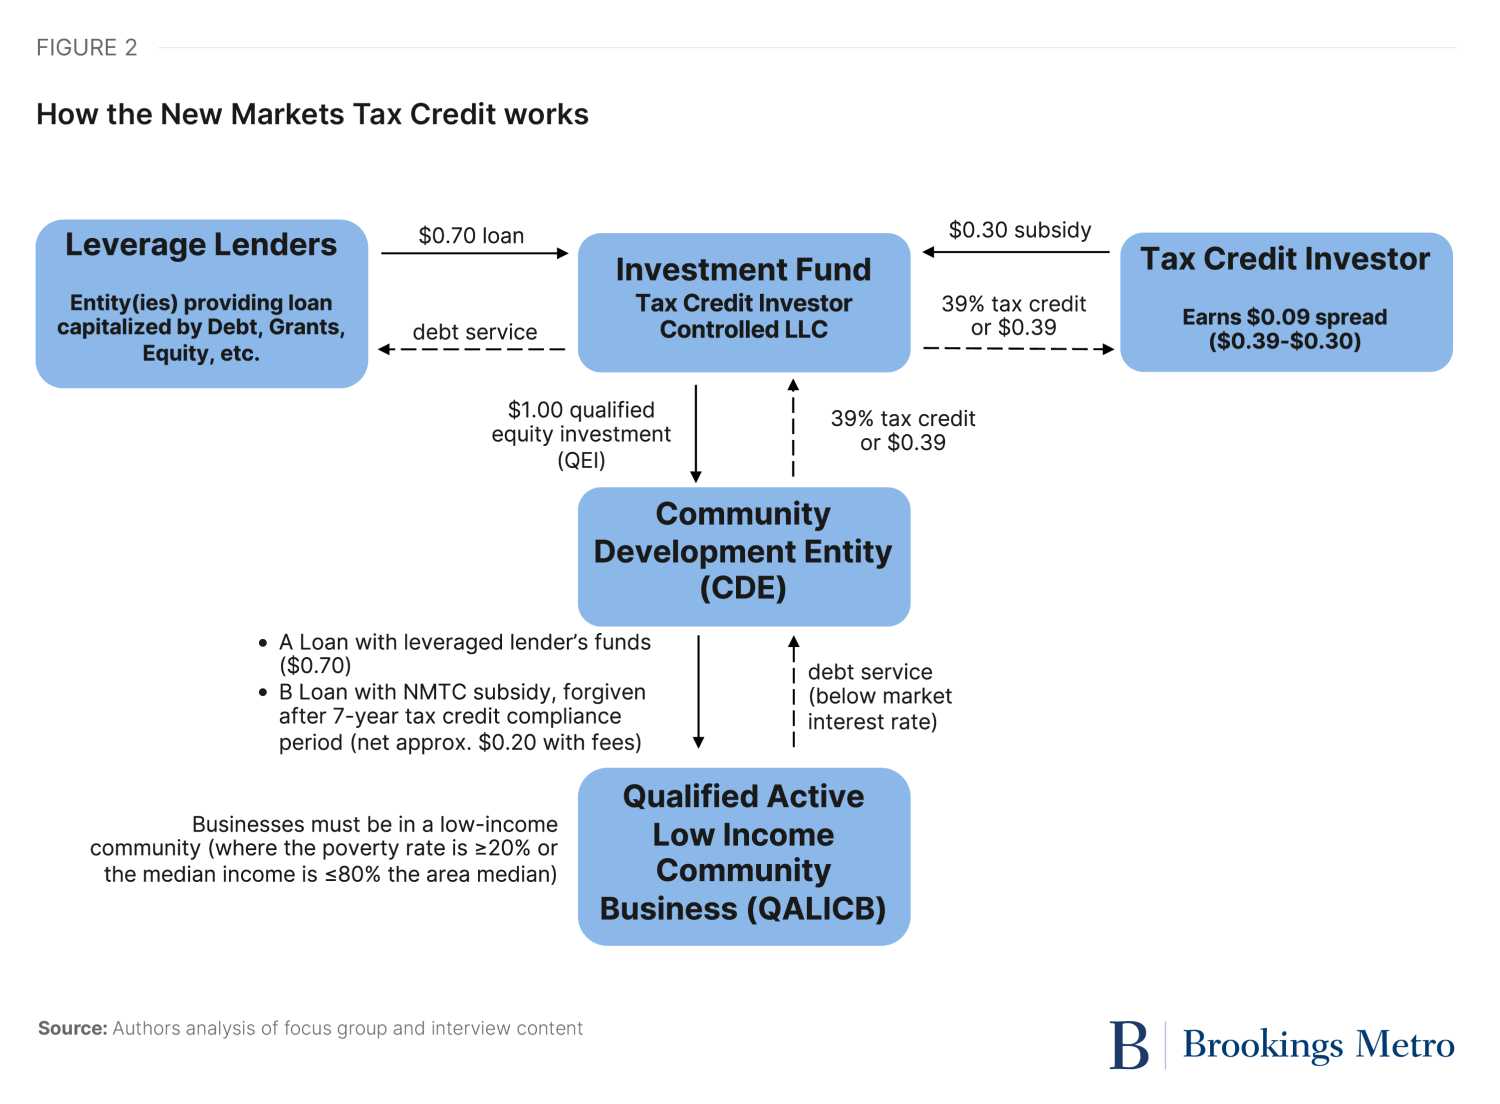
The experience of a for-profit social enterprise real estate developer working to acquire and revitalize shopping centers in low-income urban areas across the country illustrates a typical use of the NMTC program. The developer used the NMTC structure to leverage equity provided by a NMTC investor to attract a loan from a third party, raising the necessary capital to make improvements to a derelict shopping center that the developer acquired in Baltimore. This third party “leverage lender” allowed the developer to benefit from the NMTC structure by paying interest on the loan at well below market rate (less than 1.5%).
Through this transaction, the developer received loans totaling $9.8 million. As is permitted as part of NMTC financing, the developer was reimbursed for $6.9 million of project expenses it incurred and paid for prior to the NMTC closing. The developer donated these reimbursed funds to the leverage lender—a nonprofit that shares a mission with the developer. The leverage lender then used those funds to help source a $6.9 million NMTC loan. This strategy maximized the leverage (debt) in the NMTC structure, enabling the project to qualify for the highest possible amount of tax credits and bring more capital into the project. The NMTC transaction resulted in two benefits for the developer: favorable debt financing for the bulk of the project’s capital stack, and over $1.5 million in direct subsidy that the developer is using to make improvements to the shopping center.
At the end of the seven-year compliance period, the investor will have the option to put its interest to the leverage lender, or the leverage lender can exercise a call option that will allow the NMTC investor and the CDE lender to exit the structure. At the end of this, the leverage lender will be the direct holder of the promissory notes for the loans. The portion of the loans relating to the NMTC investor equity will be forgiven, as there is no repayment obligation for same (once the investor has received its tax credits). Equally important is the fact that the leverage lender will forgive the loan made to the developer. The developer and the leverage lender signed a memorandum of understanding indicating this intent, given that both entities will have achieved the objective of revitalizing the shopping center and strengthening the community in which it is located.
The NMTC allowed us to make improvements necessary to attract a national grocer to a food desert.
A commercial real estate developer
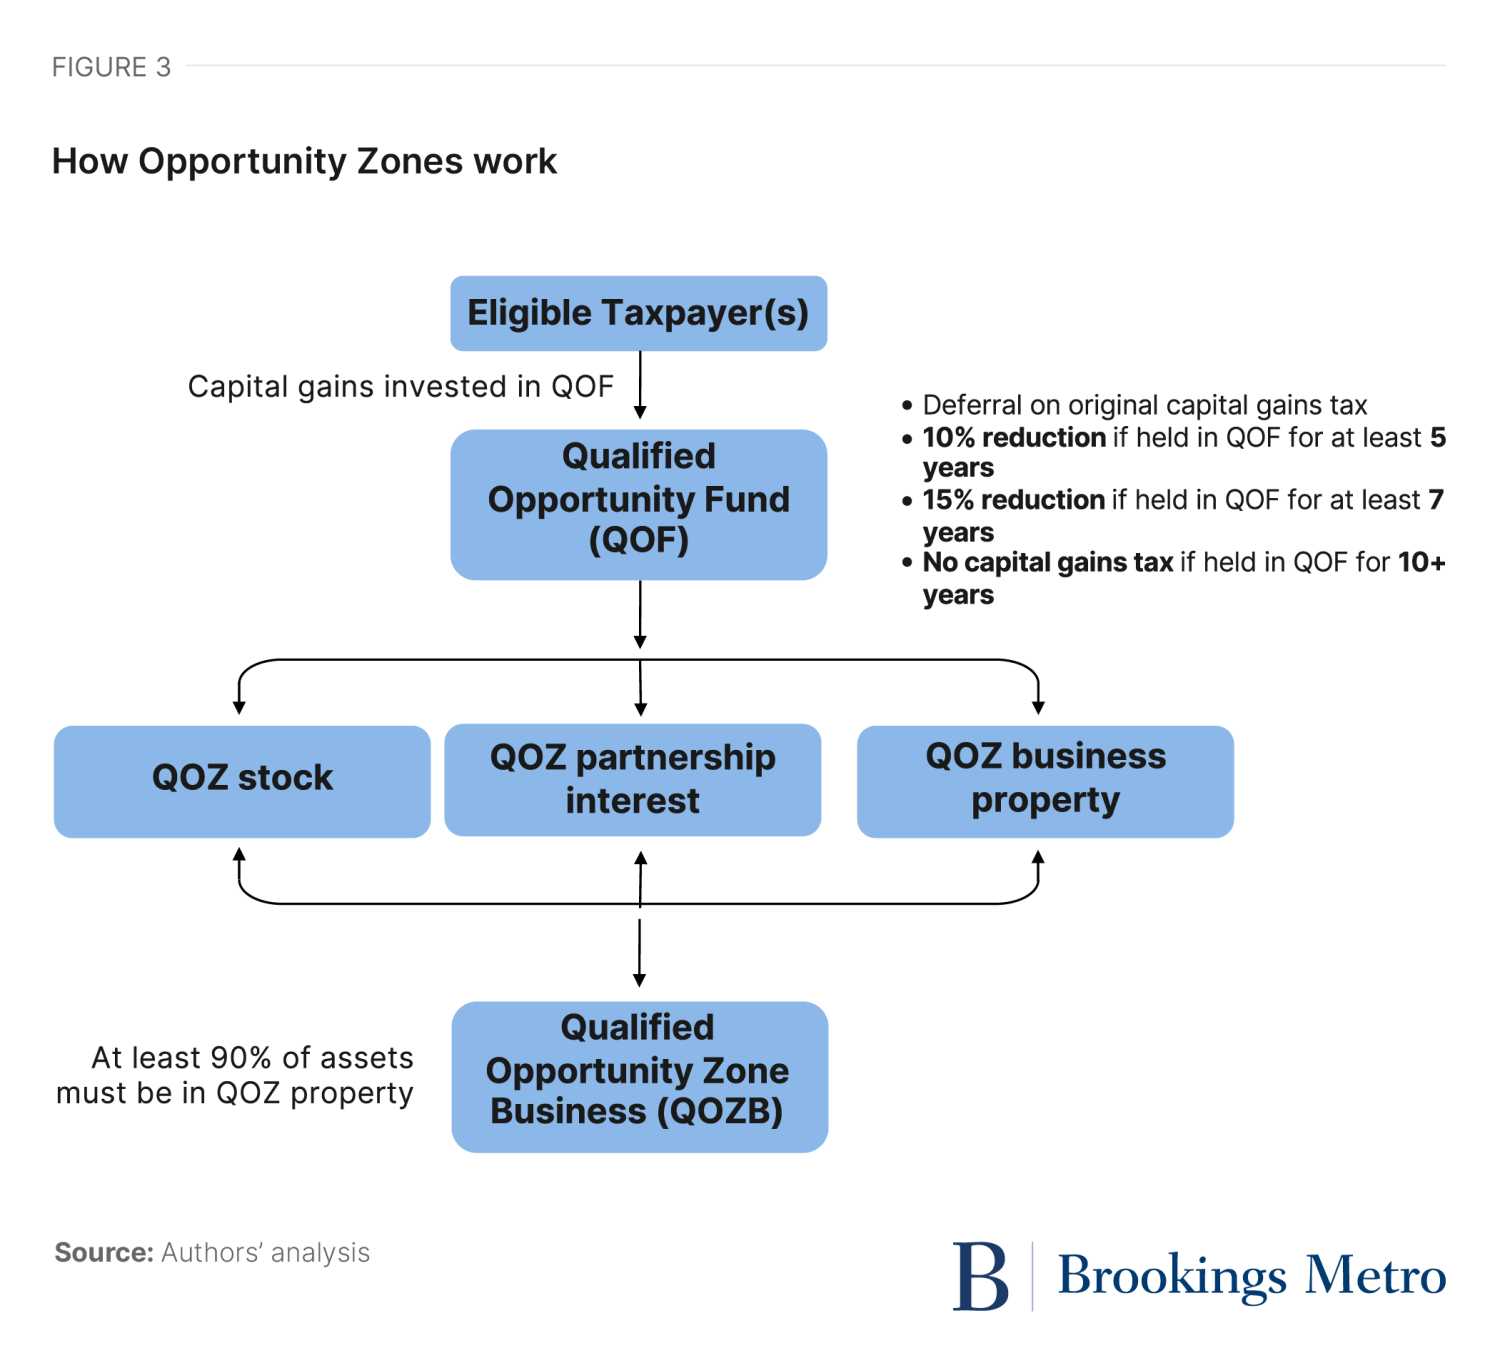
Opportunity Zones were designed to be less bureaucratically intense than NMTC program, incentivizing investment in economically underserved communities by reducing the taxes direct investors owe. In contrast with the NMTC program, there is no limit to the total tax breaks that can be claimed under the OZ program, and there is no federal oversight over investments beyond IRS enforcement.
Figure 3 shows a typical Opportunity Zone structure. Individual taxpayers with newly realized capital gains pool funds in an Opportunity Fund, which is an investment vehicle formed for the purpose of investing in OZs, created by filing a partnership or corporate federal tax return and then maintaining at least 90% of assets in Qualified OZ (QOZ) property. Investors—largely high-net-worth individuals with significant unrealized capital gains—defer capital gains taxes on the initial investment. Ultimately, they pay no tax whatsoever on any gains from the OZ investment provided they leave their money in the fund for 10 years. For real estate, there is also no depreciation recapture if the assets are sold at the 10-year exit, so the program offers a unique and generous protection of a traditionally very attractive tax benefit associated with income-producing real estate for investors.
The experience of a national multifamily housing developer working in an urban area in the Southeast illustrates the typical use of OZs. This developer focuses on providing middle-income, market rate housing to address the housing shortage, which also provides relief from downward demand pressure for naturally occurring affordable housing. With a capital stack comprised of roughly 60% conventional debt and 40% equity (a larger equity share than the 20% that is typical for most real estate developers), this developer’s equity historically largely comes from real estate investment trusts (REITs) managed by the developer, which provide individual investors a way to add real estate to their investment portfolio and bring the generational wealth benefits of real estate without having to having to directly buy and manage the property themselves. When the OZ program debuted, it was immediately an easy match for this developer, who was already working with a fund structure targeting real estate investments in underserved communities.
In the late 2010s, this developer was looking at constructing three multi-family housing developments in three neighborhoods in the same city. Project A was a 259-unit market rate development in a well-established area, with studio asking rents of $1,325. Project B was a $151.8 million two-phase 534-unit development with first floor commercial space in a formerly industrial neighborhood adjacent to a light rail stop. Project B’s studios start at $1,229. Project C was a $24.5 million 104-unit development with 50% of units priced as affordable for residents earning below 80% of the area median income (studios begin at $999), adjacent to a multi-use trail in a historically Black neighborhood that is also home to a small historically Black college.
Only Project A happened without OZ capital, financed using the firm’s REIT equity strategy. It is also possible that Project B could have happened at some point without OZ capital, but the designation of the area attracted investor attention, raised property values (which motivated longtime owners to sell), and catalyzed multiple projects by other developers that provided critical mass to build out a new neighborhood, including a grocer.
Project C was the toughest to get done. To make this development financially viable without additional subsidy, the developer combined OZ and REIT equity, but didn’t take an asset management fee on the OZ fund, and had the property rezoned by the city as a car-free community, which alleviated the financial burden added by parking requirements.
The Opportunity Zone designation gave people the confidence to cross the tracks.
A multi-family housing OZ developer
The ‘where’: Eligible areas
Since 2018, the CDFI Fund has updated the data used to determine LIC eligibility every five years with the new American Community Survey dataset (previously the decennial census was the source for tract-level data).1 The universe of eligibility for the NMTC program is defined by census tracts meeting metrics of need, as defined below. The OZ program takes the same tracts and further narrows eligibility through subjective selection by state governors.
- New Markets Tax Credit tracts are eligible as low-income communities if they meet one of the following criteria:
- A poverty rate of at least 20%, or in the case of a tract not located within a metropolitan area, the median family income for such tract does not exceed 80% of the statewide median family income.
- If located in a metropolitan area, median family income does not exceed 80% of the statewide median family income or metropolitan area median family income, whichever is greater.
- A population under 2,000, contiguous to one or more low-income communities, and within an Empowerment Zone.
- In a “high-migration county” (net out-migration of at least 10% when comparing the latest census to two decades before) and does not exceed 85% of the statewide median family income.
NMTC tracts were designated as “severely distressed” by the CDFI Fund if they met one of the following criteria:
- A poverty rate of at least 30%.
- An unemployment rate at least 1.5 times the national average.
- The median family income does not exceed 60% of the statewide median.
In the CY 2024-25 NMTC application, the CDFI Fund added additional scoring incentives for CDEs that prioritized a portion of their investments in areas characterized by at least one of four items below:
- Deep distress, which increased the criteria for severely distressed to greater than 40% poverty rates; an unemployment rate at least 2.5 times the national average; or the median family income does not exceed 40% of the statewide median for tracts located in non-metropolitan counties, or 40% of statewide or metropolitan area median income for metropolitan counties.
- NMTC Native Areas
- High-migration rural counties
- U.S. Island Areas
- Qualified Opportunity Zone–eligible tracts are low-income communities designated by the same standards as the NMTC. State governors nominated up to 25% of eligible tracts in their state for designation (up to 5% of nominated tracts could be contiguous to low-income community tracts without being eligible themselves), which were certified by the Treasury Department. QOZs were designated once in 2018 and have no provision for revision, as the program is not permanent.
Based on these guidelines, over one-third of all American communities are considered low-income, and one-quarter are severely distressed. The selected tracts the guidelines produced are worse off than the national average by every considered metric (poverty rate, unemployment rate, and median household income) (Table 1). The regional distribution of these high-need areas roughly mirrors that of the United States, with a slightly greater proportion of tracts in the South qualifying for these incentive programs (Figure 4). The NMTC universe of eligibility contains a greater proportion of urban and rural tracts, while the OZ program has designated significantly more rural tracts for eligibility (Figure 5).
While the designation of eligible tracts serves to direct private investment dollars into geographic areas in need of economic revitalization, it does not guarantee funds will go to projects that need it most, or that eligible areas will see any investment at all. Although not required by statute, most CDEs apply a “but-for” test to their projects to ensure their allocation is only going to projects that would not have been able to proceed without the NMTC subsidy, because this is incentivized in the CDFI Fund’s allocation application scoring method. Due to the complexity of NMTC projects, where the allocation only represents a portion of the total funding and an NMTC project may represent only a portion of a larger project, it is difficult to conduct a stringent “but-for” test that accurately estimates the full extent of the NMTC’s role in bringing a project to fruition. However, it is likely that most NMTC projects would not happen without the allocation. On the other hand, the OZ program forgoes this “but-for” consideration altogether in its pursuit of a more navigable and nimble incentive program.
Lessons from the literature
A review of the literature reveals strengths and weaknesses in each program when it comes to the scope and scale of impact on the economic conditions of low-income neighborhoods. These differences largely stem from the way each program is structured and authorized. Evaluations of the NMTC find the program was significant in bringing financing to projects in low-income communities, both directly through the NMTC allocation and by facilitating access to additional advantageous debt and equity financing. While the NMTC legislation did not outline specific goals for the program, the flexibility and reach of the program has contributed to the diversity of outcomes, including growth of the local tax base, job creation, and increase in private investment in the tracts.
Of the $71 billion in NMTC allocation deployed in the first 20 years of the program, 42% went toward real estate businesses and 57% to non-real-estate businesses, with the remaining 1% as loans and investments to other CDEs. Although there is evidence to suggest that NMTC investment results in positive economic outcomes, the reach of the program is limited within a large universe of eligibility; analysis of the CDFI Fund data release through FY 2022 finds that only 11% of all eligible tracts received any investment, and 70% of those tracts saw only one NMTC-funded project. However, a greater proportion of that investment was directed to more distressed tracts than investment flowing through the OZ program.
Due to the absence of reporting requirements written into the OZ program, our understanding of its uptake and impacts is more limited. Access to the confidential tax records necessary to examine OZ investment is restricted to researchers at the Treasury Department or Congress’ Joint Committee on Taxation, as well as scholars co-authoring with them. A Treasury team found that by the end of 2022, $82 billion had been invested across two-thirds of designated OZ tracts. Their analysis also concluded that OZ investment was more likely in tracts that were less distressed and on an upward trajectory, already seeing outside investment prior to the OZ investment.
A 2024 study further concluded that a significant proportion of OZ investment was in projects that likely would have proceeded without the additional incentive and in areas producing a higher rate of return, and thus neither OZ designation nor OZ investment appears to have a significant impact on a community’s economic growth and limited, if any, impact on residents’ economic conditions (employment, earnings, and poverty). Trade groups estimate about half of OZ capital is invested in market rate multifamily housing. While the role of the OZ program in changing economic conditions is debatable, the volume of capital moving through the program is significant because there is no cap on the value of tax benefits that may be claimed.
Key findings from our analysis and practitioner insights
Making capital patient requires subsidizing the time cost of capital, which OZs and the NMTC do in very different ways
Both Opportunity Zones and the NMTC bring new capital to LICs. However, participants in our focus groups and interviews noted that almost all OZ investors are still seeking and obtaining market rate returns for their capital; for example, as much as a 20% return on exit (and then further gaining the step-up basis as an added “sweetener” for the deal). The public benefits obtained by the cost of the program are to make the capital more patient (10 years compared to market-typical five years) and to direct the capital to projects in the designated places. Therefore, while the OZ program may make it easier to raise equity, the capital cost is the same as it is outside of an OZ, and while 100% of the public’s foregone tax revenue provided to the fund structure is available as working capital, all of the foregone revenue ultimately accrues to the investors—none remains with the project. In addition, a 1% to 2% annual management fee (10% to 20% of basis after 10 years if no loss; more if assets appreciate) goes to the fund manager.
In contrast, the NMTC provides both direct subsidy that remains with the QALICB and lower-cost debt to those same LIC projects and businesses. Participants in our focus groups and interviews reported that typically about 50% of the public’s foregone tax revenue reaches the project as subsidy. The other 50% goes to the tax credit investor, CDEs, consultants, lawyers, and accountants who provide the capital, find and move the project through the pipeline, and navigate program requirements. It is important to note that this does not take into account the additional value that QALICBs receive in the form of cheap debt. Opportunity Zones temporarily relocate capital, while the NMTC both permanently relocates and subsidizes capital.
Transaction costs affect investment size
The NMTC has a rigorous cyclical application process that tends to prioritize deals that create jobs and services for LIC residents. However, as depicted in Figures 2 and 3, the NMTC program is more structurally complex than the OZ program. The more streamlined and less regulated structure of OZs makes it an easier process to navigate. Smaller deals ($500,000 or even smaller in some instances) are just as possible as projects that cost $100 million or more, and the ease of execution has resulted in far more dollars incentivized to flow into LICs annually.2
While CDEs have successfully used the NMTC to make small investments, on average, NMTC projects are large. The average project investment over FY 2002 to FY 2022 was $8,301,495, with a median investment of $5,258,298. Figure 6 shows the size distribution of NMTC investments. While comparable data are not publicly available for QOFs, the limited data available suggest a flourishing of much smaller project sizes alongside some very large plays; most recently, Novogradac reported that the median amount raised by single-asset QOFs in their tracking is $3.5 million.
In reality, absorbing capital at that scale is extremely challenging for a typical enterprise or real estate project in a LIC, and simply enabling more $1 million-scale bets would be transformative in and of itself. This is a key point for rural areas. While the existing literature on rural community development emphasizes complexity, lack of administrative capacity, varying geographic definitions, and cash flow to support loans or reimbursement-based grants as challenges for rural areas, a structural bias toward large project sizes due to high transaction costs is also a problem for serving communities with smaller populations and where very small businesses are a larger share of the economy.
[Small business owners] typically don’t undertake large financings and they don’t have teams to do this. They’re doing it in their five to nine because their nine to five they’re spending actually operating their business. And they also have to have a project that’s large enough to undertake up to $4 million worth of capital…Even a million dollars for a small business is a lot of capital to undertake.
A CDE focus group member focused on minority-owned small businesses
A similar range of tracts are eligible for each program, but program mechanics result in different program emphases within this range
Opportunity Zones were first designated in 2018, using 2011-15 American Community Survey (ACS) data. While both OZs and the NMTC use a 20% household poverty threshold to define eligibility, in the case of Opportunity Zones, Congress limited the designation to only 25% of eligible tracts per state. Thus, as shown in Table 2, the OZ universe is one-quarter (25%) the size of the NMTC universe. However, each program has other caveats to eligibility that further reshape their geography. For example, because certain contiguous tracts could be designated as OZs, 3% of OZs ultimately selected were not actually LICs and would thus be ineligible for the NMTC. A majority of NMTC tracts are “severely distressed” (64%). An even larger majority (73%) of OZ tracts met the severely distressed criteria using 2015 data.
These universes are not stable over time—the economic conditions within these tracts can change in just a few years. In 2023, the CDFI Fund released updated eligibility criteria for the NMTC based on the 2016-20 ACS 5-Year Estimates. Notably, 9,950 tracts, or 29%, that were previously classified as LICs became ineligible because their poverty or unemployment rates improved—sometimes dramatically. By 2016-20, these tracts had an average poverty rate of 12.4%—9.9 percentage points lower than the average of the tracts that remained eligible for the NMTC.
This same dynamic is visible with Opportunity Zones. A similar share (27% of designated OZs) “graduated” beyond the low-income threshold per the 2016-20 ACS. However, the OZ program does not have the same provision for updating eligible tracts, so these “graduated” tracts continue to be eligible for OZ investment. This shift demonstrates how hyperlocal household economic conditions can change rapidly over a five-year period, due to one or more likely a combination of factors including macroeconomic conditions, local capital inflows (whether through the NMTC, OZ, or otherwise), changing economic circumstances of individual households, and changes in the residential population.
However, these shifts are so large that given everything we know about the persistence of poverty, it is not likely that these all represent real economic transformations. Instead, this volatility reveals the serious limitation of relying exclusively on the census to create a policy geography for economic development. Census block group geographies vary in spatial size, use major economic development assets such as commercial corridors and industrial areas as borders rather than centers, and change every 10 years, making them a highly imprecise way to target investment. Further, ACS data have very large margins of error, particularly in rural communities. The reality is that local decisionmakers probably know better than a statistical bureau in Washington how to define the pockets of persistent poverty in communities.
However, one thing that is clear is that the NMTC and OZs are not the most powerful forces reducing concentrated poverty. For example, we found that only 5% of 2020’s “graduating” tracts ever saw an NMTC investment before “graduating.” Clearly, other forces play a much larger role in moving those particular tracts on a positive trajectory.
This finding is not evidence that the NMTC and OZ programs are not impactful. In the case of the NMTC, due to both allocation criteria promoted by the CDFI Fund and the missions that inspire CDFIs, CDEs, and QALICBs, a majority of NMTC investments are in severely distressed tracts—the ones furthest from “graduating.” Our analysis confirms this finding over time. We found that 57% of all projects with NMTC allocation investment between FY 2002 and FY 2022 were in tracts that were classified as severely distressed using 2011-15 data, and 60% were in tracts that were severely distressed using 2016-20 data. However, because of the complexity involved in accessing the program, NMTC investment is also hyper-concentrated in a relatively small number of census tracts lucky enough to be served by high-capacity entities that can bring investment to them. Of all census tracts eligible at any point in the last 10 years, only 10% have gotten any NMTC investment (12% for severely distressed tracts in that group), meaning that even with extra targeting, most severely distressed tracts are not being served.
On the other hand, a study of NMTC and OZ investment data by Treasury Department economists with access to confidential tax records found that two-thirds (67%) of designated OZ tracts saw OZ investment over the period from 2018 to 2022. The same study found that at both the time of designation and during investment, OZ census tracts appear to be those already on an upward trajectory, and that OZ investment was more likely in tracts that were already seeing more outside investment. However, because there is no mediating local entity such as a CDE and QALICB advancing projects for investment and no reporting requirements, there is no way of knowing what the projects were, and therefore how much, if any, of this publicly subsidized investment has produced social benefits.
Opportunity Zone investors are motivated to invest to earn market rate returns while reducing tax liabilities. These investors are not necessarily motivated by a mission to invest in “impactful” projects in low-income communities—rather, the structure requires projects that are physically located in low-income communities yet still able to generate significant returns. However, early findings from OZ observation indicate what the market wants or knows how to do and what low-income communities need may differ. Many of the distressed communities targeted by OZs lack the capacity to meaningfully engage with high-net-worth OZ investors, who also largely lack the cultural competency and networks that could bridge this gap to connect investors with locally desired projects. This issue is exacerbated by the fact that the flexibility of OZ project type permits investment in projects that do not contribute to the program’s purpose of uplifting disinvested communities. There is no federally specified role for community input in OZ projects.
In short, the NMTC and OZs share very similar baseline geographies and aggregate trends. However, a closer look reveals varying dynamics in the functional reality of where and how investment flows via each program.
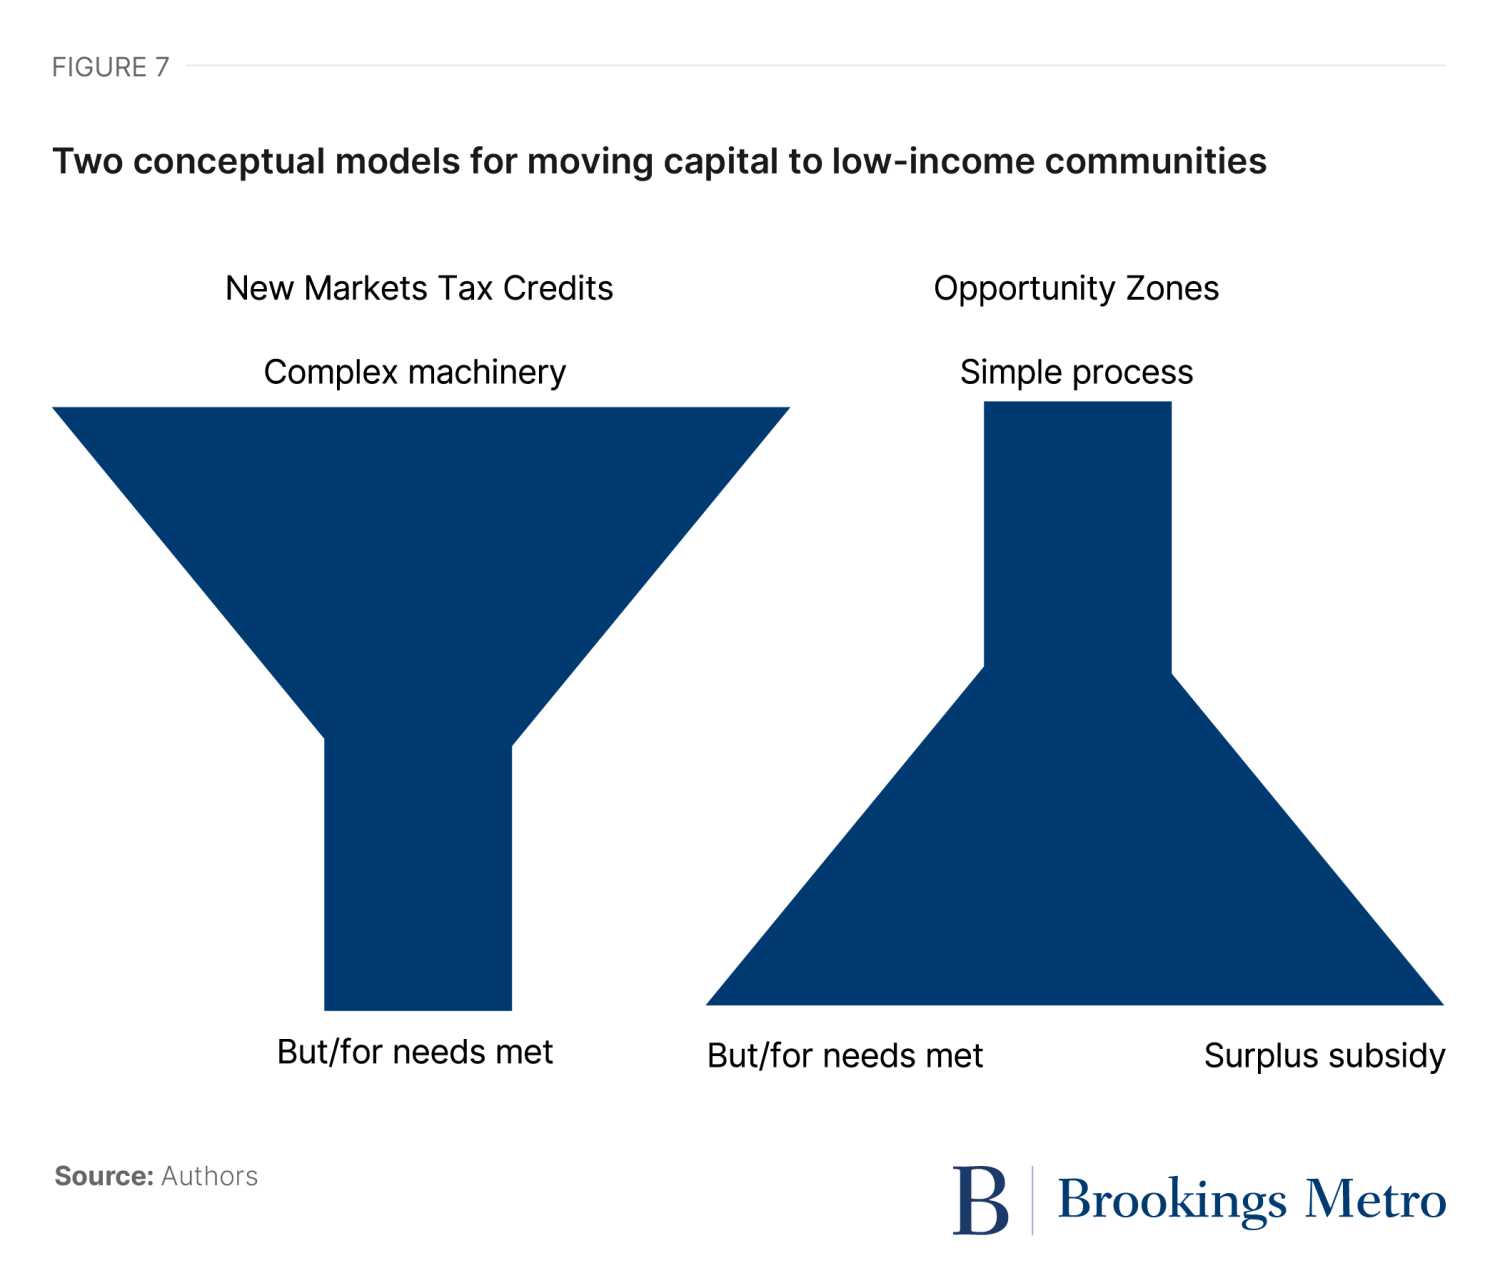
What emerges are two alternative approaches for bringing capital to LICs, summarized in Figure 7. Each approach has pros and cons. New Markets Tax Credits enable projects with social and economic benefits that in most cases likely would not happen but for the NMTC subsidy. However, the program’s overhead is so complex that most communities can’t access the credits, and the value delivered to society is less than the top-line aggregate cost of the program would suggest to the average person. Meanwhile, Opportunity Zones have very efficiently unlocked enormous amounts of capital and moved them to LICs. However, while there is no way to know for sure how much, it is reasonable to infer that a nontrivial amount of publicly subsidized dollars is going to projects that either do not need the subsidy, offer no or very limited community benefit, or even do harm.
The ideal place-based tax incentive program: Transparently empower community investment funds
Our focus groups and review of the literature revealed that while the NMTC and OZ programs are far from perfect, each has put some good ideas to work. If disentangled from bad ideas, the ideal place-based investment program would combine elements of both. Summarized from the review above, the core challenges are:
- Excessive complexity leading to high overhead.
- Limited benefit to low-income communities relative to taxpayer cost.
- Meaningful capital flows have not reached many eligible communities.
These challenges can be inverted into a set of design principles to shape a better place-based investing program. At a high level, the design principles are:
- Efficiently move capital to LICs with low overhead.
- Specify a mechanism for substantive local input in geographic targeting and project selection.
- Expansively mobilize capital from diverse sources to scale program impact.
The sections below present a proposal for a new program that Congress could establish. However, these same design principles and proposed ideas could be used to reform the existing programs, or this new program could be introduced as a pilot to operate alongside the existing programs for testing.
The ‘what’: Flexibly braid diverse sources of capital
The projects that low-income communities need require three elements in their capital stack: patient debt, patient equity, and immediate subsidy. Practitioners report that in general, raising capital for projects in low-income communities is very challenging, but like a magnet attracting other magnets, if they have one of these forms of capital the others become easier to find. What is needed is a tool that can braid diverse capital sources efficiently and flexibly.
We propose that Congress create “community investment funds.” The community investment fund (CIF) is an investment vehicle that can deploy any combination of capital that it chooses: ordinary dollars, capital gains, NMTC allocations, CRA-compliant bank loans, or philanthropic investments. The CIFs should:
- Be certified by the CDFI Fund as CDEs.
- Allow investments of up to $50,000 per year, per person.
- Allow unlimited investments of pretax capital gains, with a step-up in basis of 10% after five years, 15% after seven years, and 20% after 10 years.
- Encourage program-related investments from charitable foundations.
- Encourage equity-equivalent investments from banks, universities, and other organizations.
- Accumulate returns as long as investments remain in the CIF.
- Transfer funds from one CIF to other CIFs without penalty.
- Be required to deploy capital within five years of investment.
- Distribute funds and any gains after 10 years tax-free.
Congress could also structure CIFs so that those that make investments in more deeply distressed neighborhoods or rural areas, or those that engage larger numbers of small-dollar investors, receive priority in competing for NMTC allocations or allocation bonuses.
Currently, under IRS code section 4944(c), philanthropic foundations can only make program-related investments (PRIs) that meet a “charitable purpose” test. Congress should specify that when a foundation makes a loan to a CIF, it is a PRI for purposes of the IRS code and does not jeopardize the carrying out of the exempt purposes of a private foundation.
One absolutely critical caveat is that in order to comply with securities law, to enable CIFs Congress must expand the definition of “accredited investor” to the existing definition plus anyone who is not investing more than 10% of their net worth (excluding home equity) annually in securities, as already proposed by Sen. Tim Scott (R-S.C.) in the Empowering Main Street in America Act of 2024. While the current accredited investor definition exists to protect individuals from risks they are not prepared to evaluate (which is a worthy goal), only 18.5% of American households are accredited investors. That leaves most Americans limited in their wealth-building options. Capped participation in CIFs is a reasonable way to engage every American in both strengthening their own personal wealth and strengthening their community.
In this design, for an ordinary person investing, for example, $1,000 of after-tax income, the CIF functions like a Roth Individual Retirement Account (IRA), except that you can take distributions from it after 10 years instead of only in old age. The CIF also functions as a Qualified Opportunity Fund, in which pretax capital gains flow in, and then the taxes that would have been owed on the gains are deferred for 10 years while invested in a LIC, gradually stepped-up in basis, and any additional growth during that time is tax-free. Additionally, the CIF is a CDE that can optionally compete for and receive NMTC allocations.
Finally, project eligibility for any tax incentive program that is focused on moving capital to low-income communities needs guardrails. The current NMTC guardrails baked into the allocation process are more than sufficient. However, this is not the case for Opportunity Zones (currently, the OZ law only prohibits investments in a list of sin businesses lifted from the NMTC law). While we have only partial systematic evidence of what OZ funds are investing in, practitioners report notable activity in real estate products that have dubious or even negative community economic development impacts, including data centers and self-storage facilities. Any reauthorized or new federal program in this arena should be designed to disincentivize or outright prohibit public subsidy for such investments. For CIFs, we propose the same statutory eligible projects as the NMTC.
The ‘who’ and ‘how’: Leverage existing mechanisms with a mission to serve low-income communities
Regardless of the exact legislative language, the functional purpose of programs like the NMTC and OZs is to move capital to places where the market alone is not going to allocate it. Incentivizing market actors to change their behavior costs money, and is one way to achieve this outcome. A low-cost complimentary strategy is to empower communities themselves with the ability to aggregate capital. While existing programs like the NMTC and the CRA emphasize the federal role in community economic development as providing subsidy or mandate to divert capital allocations to LICs, this overlooks a potentially more vast and impactful role that costs the taxpayer nothing: increasing the total capital allocations available, especially to LICs, by bringing more participants into capital markets. A key novelty of the OZ program was to mobilize “new” capital by incentivizing investors to put unrealized capital gains to work.
Receiving an incentive is a benefit. While proponents may argue that the primary beneficiaries of the OZ program are the low-income communities to which capital flowed, this is a disputed point. The undisputed impact of the program is that investors with capital gains received an incentive from the public. Given that 90% of realized long-term capital gains accrue to the top 20% of households, this begs the question of whether there is any other capital currently on the sidelines that is more proximate to the needs of low-income communities and could be mobilized to do this work. The proposed CIFs will have the power to engage three new sources at scale:
- Philanthropic dollars. Through the steady drip of compounding, the aggregate dollars held in the endowments of private foundations has doubled between just 2013 and 2023, and now exceeds $1.4 trillion. While foundations are required to distribute 5% of their capital each year, in recent years this has been far from sufficient to prevent this capital from piling up. If foundations were required to put an additional 5% to work through program-related investments, that roughly $80 billion per year would immediately dwarf either the NMTC or OZ program. However, any such new requirement should be paired with a simple, replicable legal mechanism for making PRIs.
- Banks with Community Reinvestment Act compliance needs and other organizations aiming to achieve corporate social responsibility (CSR) investing goals. Banks and other organizations engage in Equity Equivalent Investments (EQ2s) primarily to support community development initiatives while achieving strategic financial and social impact objectives. EQ2s are structured to be subordinated loans with fixed interest rates. They function similarly to equity by absorbing losses before senior debt, and they are ultimately repayable—offering a balance between risk and return. While EQ2s have typically been made in CDFIs, CIFs could offer another option. Because CIF investments will channel capital to disinvested areas, they should be recognized favorably during a bank’s CRA evaluations. Beyond regulatory compliance, EQ2s align with broader CSR and impact investing goals. By investing in CIFs, organizations could have an additional way of demonstrating a commitment to social responsibility and contributing to placed-based economic development.
- People living in low-income communities. Residents of LICs have proximity to the needs of their neighborhoods; if they like a project, that is a positive sign, though not a foolproof test. This proximity is a form of value inherent to their participation and should be captured in program design. While traditional investment structures and federal programs position these individuals as having negligible resources, in a low-income community with a poverty rate of, say, 25%, that means that 75% of residents are above the poverty line. In addition, early innovators in the community capital space have demonstrated that LIC residents want a tangible way to grow wealth and strengthen their neighborhoods, and are able to make low- to moderate-dollar investments that thicken capital stacks. Aggregating smaller-dollar sources is inherently more complex. However, Regulation Crowdfunding allows companies to raise capital from a broad base of investors, and fintech innovations in crowdfunding make it technically possible. CIFs can reduce the administrative overhead of aggregation and leverage these tools for the benefit of unaccredited investors residing in disinvested neighborhoods.
Each CIF would be required to have an investment policy statement to attract investors, explaining what kind of projects they will do. These thesis documents should be collected by the CDFI Fund as part of the certification process. These existing Treasury regulations guiding the requirements to become a CDE make sense for CIFs:
- Have a mission to serve low-income communities.
- Have a board of directors of at least three people.
- Existing accountability rules from the CDFI Fund should also apply to CIFs, such as that board members must live, run a business, or run a nonprofit in the target area.
- All investments are subject to board approval, and boards have a fiduciary duty.
- Annual reporting requirements:
- Board meeting minutes sent to CDFI Fund
- List of projects by category
- Costs by category (acquisition, materials, labor, etc.)
- Housing units
- Affordable housing units by band
- Retail, health care services, local job creating enterprises, etc.
- Optional additional reporting that makes you more competitive for future NMTC applications
Getting the “Goldilocks” level of reporting requirements is a challenging part of effective federal program design. While practitioners report that the NMTC causes “brain damage,” the complete lack of any reporting for OZ funds has left the public in the dark about how public incentives are being used. This new design proposes modest universal annual reporting requirements. Then, rather than additional onerous certification or reporting requirements, Congress should instead give the CDFI Fund teeth to randomly audit CIFs to make sure that the boards are implementing the mission and actually doing their fiduciary duty. The penalties for failing an audit should be draconian.
The ‘where’: A transparent, locally targeted universe of low-income communities
Local market-makers (both practitioners and policy) have excellent knowledge about where which federal programs are most needed—if they understand the mechanics of the federal program. They need to be able to override what the census says in at least some cases, especially given the poor quality of census data in areas with lower response rates and sample sizes, including rural areas, and the odd boundary demarcations of many census tracts. While this opens a program’s design up to abuse, as what arguably occurredwith Opportunity Zones, that issue can be compensated for with substantive public input and transparency in the designation process for eligible investment areas, as described below.
The general policy design principle is to be broad in the initial aperture of eligibility in order to give agency to local decisionmakers, and then narrower later in order filter out fraud. Currently, OZs do the former and the NMTC overdoes the latter. The ideal program would do both at the right size.
We propose a map selected by local market-makers through a transparent process guided by public design principles, proactive soliciting of public input, and multiple “checks” from local nonprofit organizations up through statewide officials before they are finally submitted to Treasury by a state-level executive. The Opportunity Zone selection process in North Carolina is one example that could be used to specify this model. State submissions for Treasury review should include written justification for the inclusion of any tract outside of designated LICs that references existing public economic development plans. In addition, off-campus university students should be removed from the universe of eligibility. Then, given the odd local quirks of census data and boundary delineations, states could be able to select certain LIC-adjacent neighborhoods or industrial areas (up to a cap on additional land area and/or population outside designated LICs). This “adjacent area” selection (rather than “whole adjacent tract” selection) coupled with a rigorous pre-approval public feedback process diminishes the potential for incidental inclusion of high-income areas and helps eliminate the biggest consistent complaint about both NMTC and OZ boundaries today.
LMI [low- and moderate-income] is fine for a lot of situations, but the LMI definition [misses] recently revitalized tracts, industrial districts with low household counts, and other tracts that seem to miss the spirit of the law. I’d like to see any newly designated zones align more closely with existing regional development plans [e.g., Councils of Government, Workforce Development Councils, and EDA].
An OZ interview participant
Finally, the roughly 30% churn in eligibility in both LICs and OZs within five years shows that where these programs should be targeted truly does change over time. Therefore, these designations should not be permanent, and they should be revisited every five years (the cadence at which tract-level ACS estimates are available).
Conclusion
Community investment funds will broaden the pipeline for both New Markets Tax Credits and OZs, while also solving their problems. The ultimate vision should be for CIFs to become an essential component of both programs, perhaps even replacing them if proven successful. And while there is a special urgency to enabling the flow of community capital to disinvested communities, if proven, there may well be demand for these kinds of investment vehicles in all kinds of American neighborhoods.
Take, for example, this scenario: The year is 2030, and the Joplin Memorial Hall in rural Missouri, which was the home of almost 100 years of community events and performances, has now been vacant for 10 years, after the roof partially collapsed and a 2022 bond issue to renovate the building failed. Local community leaders have come together to form the “Our MOJO Community Investment Fund,” raising $2.5 million from the community, with individual investments in the fund ranging from four $250,000 capital gains investors to dozens of small-dollar investors investing between $500 and $50,000. The fund balance was further boosted by a $500,000 program-related investment from the J.P. Humphreys Foundation. With this equity in place, and a vision to restore the hall for revenue-generating events, a bar and restaurant gathering space oriented to serving veterans, a creative business incubator, and 10 housing units for veterans receiving supportive services on an adjacent vacant parcel, the MOJO Fund was a winning contender for a $3.5 million New Markets Tax Credit allocation for the hall renovation as well as conventional construction loans for both the hall and the housing. Investors get a 6% return, and the community gets economic, cultural, and civic revitalization.
A dream like this cannot become reality if New Markets Tax Credits and Opportunity Zones are the only tools available. A smaller-dollar NMTC deal through a fund could only offer cheap debt. Attempted as a conventional OZ deal, four OZ investors coming in at $250,000 would not have been sufficient to complete the fund raise. However, by unlocking community capital, Joplin could be empowered to help itself make this dream come true.
Appendix A: Methodology
We convened three 90-minute virtual focus groups over July to October 2024, supplemented with six interviews with individuals who were unable to make the focus group. Participants were recruited through diverse outreach pathways, including: relationships with members of the research team; recommendations from the New Markets Tax Credit Coalition; and connections from other researchers and practitioners in the field. Participants were intentionally selected to represent diverse experiences working on mission-driven projects in urban, suburban, rural, and Native lands contexts in regions across the United States using NMTC or OZ financing. Some participants had experience using both programs. We attempted to recruit participants from Puerto Rico, but encountered difficulties connecting with practitioners who were both free to share their experiences on behalf of clients and comfortable participating in an English-language group setting.
The first focus group was composed of four practitioners who had used NMTC allocations to finance and complete real estate development deals, located mainly on the East Coast and Midwest in midsized and large cities. One interview was completed in conjunction with this focus group with a developer working in urban areas on the East Coast. The second focus group was composed of four practitioners from CDEs who had received NMTC allocations. Some of the participants had been part of early-round allocation applications, and all had won multiple allocations and had lost in at least one round of allocations. Participants represented CDEs working in urban and rural areas in the Midwest, the West Coast, and a large national CDE, and had experiences financing both real estate development as well as businesses. Four additional individual interviews supplemented the focus group with interviewees representing CDEs operating in urban and rural contexts nationally, and in the West Coast and South.
The third and final focus group was composed of four participants who had recruited investors to an Opportunity Fund, used as part of their capital stack in residential and commercial real estate developments in the Pacific Northwest, Mid-Atlantic, and West Coast. Two of four participants had also used the NMTC. This focus group was supplemented by one interview with a developer and fund manager operating in multiple markets across the country, one interview with a fund manager focusing on a predominantly rural state in the South, and one interview with a fund manager focusing on small businesses in a different Southern state (with a broader mix of urban and rural areas).
We also contacted the NMTC program administrator of the CDFI Fund and requested an interview, ultimately obtaining only written responses to a set of submitted questions.
-
Acknowledgements and disclosures
The authors thank the 18 practitioners who contributed time to participate in focus groups to help us understand these programs. In addition, the authors thank David Wessel for his review of earlier versions of this report. Any errors or omissions remaining are those of the authors.
-
Footnotes
- The most recent update, using the 2016-20 tract-level data took effect September 1, 2023, with a one-year transition period. QLICIs closed prior to September 1, 2023 must use the universe of eligibility designated by the 2011-15 ACS, while QLICIs closed after August 31, 2024 must use the 2016-20 ACS data.
- See Figure 5 in Coyne, D. and C. Johnson (2023). “Use of the Opportunity Zone Tax Incentive: What the Data Tell Us.” Washington, DC: Office of Tax Analysis, US Department of the Treasury. Available online at: https://home.treasury.gov/system/files/131/WP-123.pdf
The Brookings Institution is committed to quality, independence, and impact.
We are supported by a diverse array of funders. In line with our values and policies, each Brookings publication represents the sole views of its author(s).