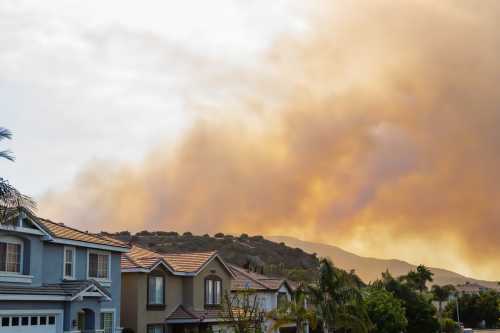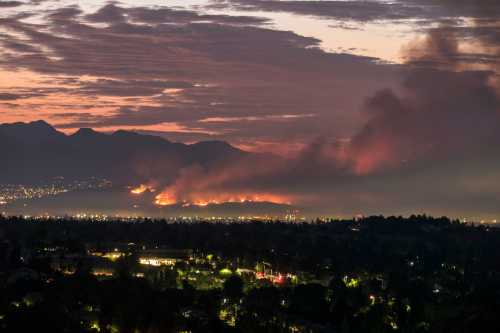
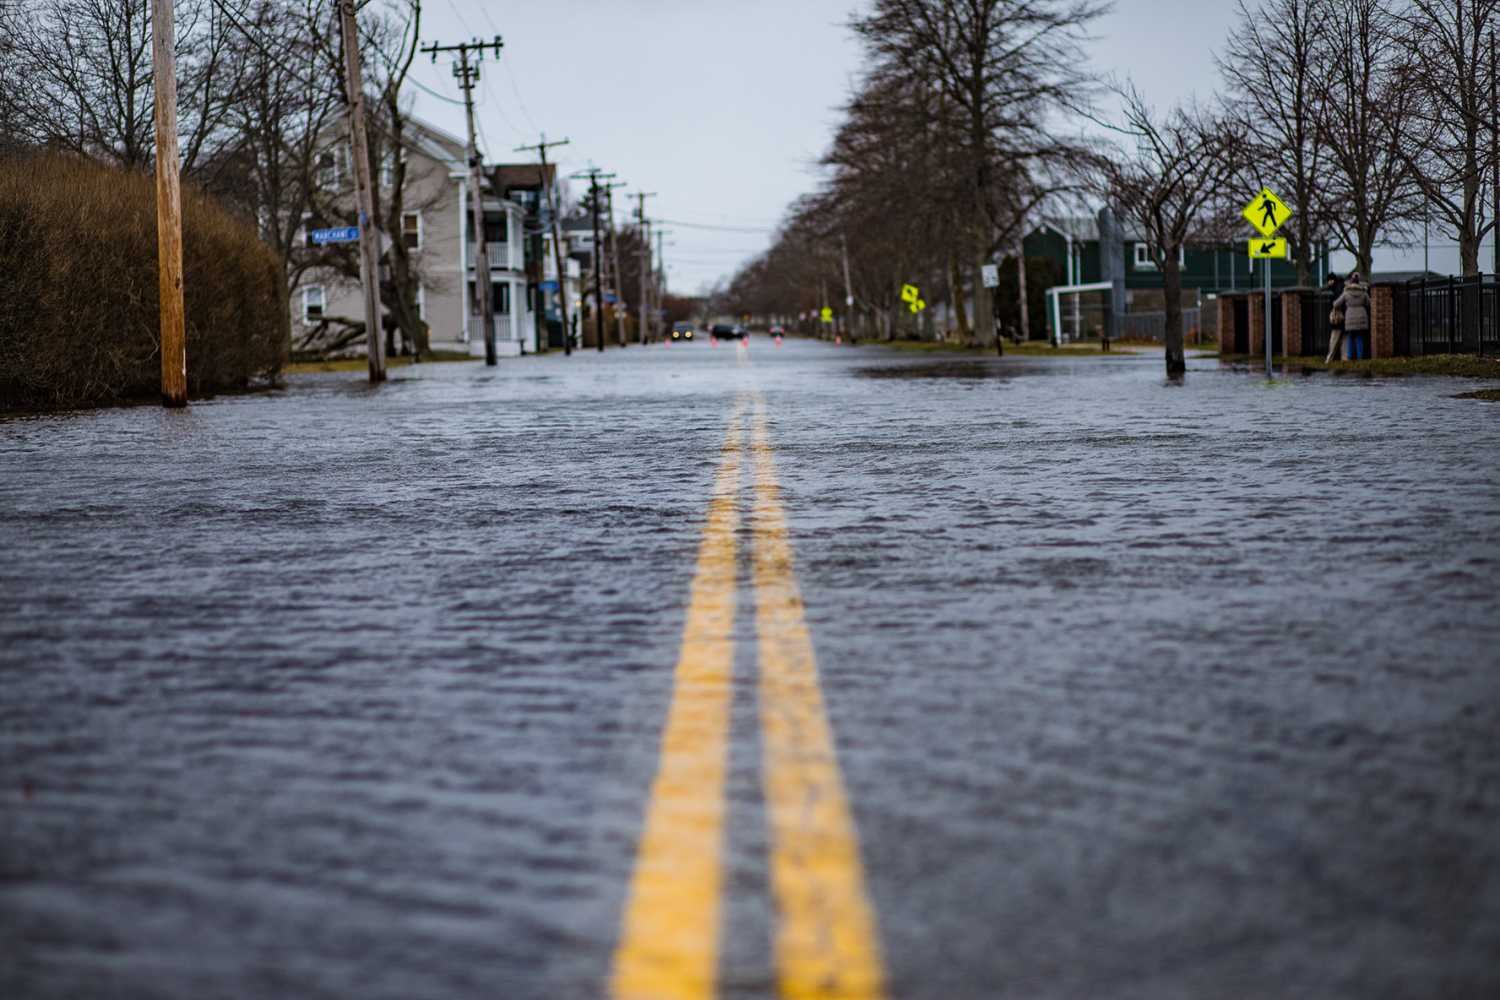
Earlier this year, we hit a milestone that should get everyone’s attention: July 2024 marked the first full 12-month period in which global temperatures averaged 1.64 degrees Celsius (2.7 degrees Fahrenheit) above pre-industrial-era temperatures. For the U.S., the temperature increase has brought a more unstable climate with frequent and increasingly compounding disasters, from hurricanes and flooding to extreme heat.
While climate change is caused by greenhouse gas emissions warming the atmosphere, many of the growing impacts of climate change are social and economic. For the most vulnerable communities, these alarming impacts aren’t a future problem—they’re being felt now, and innovative policy is desperately needed to ensure that they do not undermine progress in social and racial justice. To develop effective climate adaptation policy, including targeting investments to the communities that need them most, policymakers—both lawmakers and executives—need empirical tools to understand the distribution of climate risks, vulnerability, and resilience by race, ethnicity, and place.
But national, state, and local policymakers, while broadly aware of the need for adaptation in vulnerable communities, lack the information to make the most informed choices, especially about opportunities for alignment: how and where to invest scarce public resources in ways that can reduce climate vulnerabilities while furthering racial equity and economic mobility. While tools do exist to identify vulnerable groups and communities, none communicate climate action as a tool for racial justice. New empirical tools are needed for local governance that can expand how climate action is communicated for a variety of racial groups. This includes highlighting the role that disasters, heatwaves, and other climate-related risks play in amplifying barriers to racial progress, and illustrating how policymakers can align investments in climate action with goals for inclusive economic development.
Tracking racial gaps in climate vulnerability and resilience could help do this. Put simply, “vulnerability” refers to the exposure and sensitivity of communities and households to risks before an extreme event occurs. Social factors such as low household wealth and income, and environmental ones such as aging housing, can make households more vulnerable to disasters and climate extremes. “Resilience,” meanwhile, refers to the capacity of a community, infrastructure, or individual to prepare for, cope with, and recover from an extreme event. Measuring racial gaps in both could provide another policy tool to assess racial progress alongside other metrics.
To help meet this challenge, this report explores a new concept: “the climate vulnerability gap,” an empirical tool to gauge racial progress in climate policy and action. The report explores this concept by linking the U.S. Climate Vulnerability Index, created by the Environmental Defense Fund and Texas A&M University, with Census Bureau demographic data from the American Community Survey. The preliminary evidence in this report shows:
- Significant gaps in climate vulnerability by race and ethnicity exist, including at the national, regional, state, and city levels, regardless of regional differences in hazards or the demographic makeup of places. While this is a relative measure of vulnerability, the gaps are substantial, indicating an increased likelihood that extreme weather will generate financial distress, loss of assets, or dangerous health impacts in those communities.
- Rather than exposure to extreme climate events, these gaps are driven primarily by racial differences in underlying social vulnerability, such as health risks and housing insecurity—indicating the large role that these factors play in amplifying climate risk for nonwhite communities.
- Despite the race-based gaps in vulnerability, they are averages only; there are also many Black- and/or Latino or Hispanic-majority cities and towns (meaning that residents identifying as Black or Latino or Hispanic alone or in combination represent the majority demographic) where climate vulnerability is lower than the regional average. These relatively less vulnerable communities are spread across the U.S., but are concentrated in Washington, D.C., Virginia, Maryland, Michigan, and Northern California.
The remainder of this report presents these findings in more detail and demonstrates the potential benefits of adopting intersectional measures of climate impacts and risks such as this, including helping inform local and state planning for adaptation and resilience.
BOX 1: Explainer: Hazards, exposure, vulnerability, and resilience
Climate change researchers use specific definitions of hazards, exposure, vulnerability, and resilience to describe climate risks and impacts. These definitions enable scientists and decisionmakers to disentangle the physical impacts of climate change, such as sea level rise, from the environmental and social factors that intersect with, amplify, or dampen these impacts. These terms are also used throughout this analysis, and are defined as such:
“Hazards” refer to naturally occurring disasters such as hurricanes, floods, and heatwaves. Hazards vary by region, meaning that the types of climate risks a city or town faces also vary. In Louisiana, for example, hydrological hazards such as hurricanes and heatwaves pose the highest risks, while in Massachusetts, where many neighborhoods are low-lying, coastal settlements, sea level rise and flooding pose the greatest risks. Importantly, a “hazard” only describes a physical potential for risk, while a “disaster” describes the damages to communities or places that are caused by a hazard.
“Exposure” builds on the concept of hazards by describing the population and resources in an area that are at risk of adverse impacts from natural hazards. Exposure aims to capture the risk that hazards pose to communities through measurable outcomes such as disaster losses and damages.
“Climate vulnerability” refers to the likelihood that exposed people, buildings, or communities will suffer adverse impacts from hazards. Vulnerability captures the range of social and environmental factors that amplify or dampen the impact of hazards. For example, a neighborhood can be exposed and not vulnerable: Houses in Boston floodplains that are exposed to sea level rise are less vulnerable in neighborhoods with sea walls or raised housing. Vulnerability also captures underlying social factors—such as rates of heart disease, poverty, or unemployment—that can result in disaster impacts being more severe than would otherwise be the case. For example, residents in the Lafayette, La. metro area—where poverty rates are 18.9%—are likely to be more vulnerable to a hazards compared to the Boston-Cambridge-Newton metro area, where poverty rates are 9%.
“Resilience” refers to the capacity of a system (both naturally occurring, like an ecosystem, and human made, like a neighborhood or a city) to adapt and respond to hazards. The concept overlaps with vulnerability, with many of the same social and environmental factors (such as wealth and health) mediating household resilience, and the exposure of the built environment mediating physical resilience. More difficult-to-measure factors, such as responsive local government and strong engagement with civic organizations, are also associated with higher resilience, with both helping communities recover more quickly after a disaster occurs.
Finally, the “climate vulnerability gap,” which is introduced as a new metric in this analysis, combines data on climate vulnerability with census data on the racial makeup of places. The climate vulnerability gap measures the difference between racial groups in climate vulnerability, capturing both exposure to hazards and susceptibility to adverse outcomes from those hazards for racial groups nationally and within regions and metro areas.
Climate risks are highly correlated with race and ethnicity, and policymakers need empirical tools to understand and address these relationships
Much like their use in other domains, researchers have used indexes to try to capture how a complex array of social and environmental factors produces the climate risks and impacts that different communities face. U.S. policymakers, both at the state and federal level, are already using several notable indexes on climate risks to inform policy development.
The Federal Emergency Management Agency’s (FEMA) National Risk Index (NRI), for example, measures climate risks as a function of three broad categories: expected annual loss (EAL) from disasters and extreme events; social vulnerability; and community resilience. Climate risk is calculated for each census tract as EAL times vulnerability divided by resilience, which produces a relative ranking of risk for each census tract. This index is important because it helps identify and prioritize communities for federal investments in climate resilience. For example, the NRI was recently used as a criterion to designate Community Disaster Resilience Zones, a FEMA designation intended to crowd in private climate finance and philanthropic funding to bolster local disaster resilience. While the NRI provides a highly disaggregated picture of risk, it has been critiqued for being biased by property values. Alongside loss of life, commercial and private real estate are used to estimate expected losses, and these have been found to drive a large portion of the climate risk score. This means that dense commercial corridors and high-income neighborhoods often score higher for climate risk despite having lower levels of social vulnerability.
The Environmental Defense Fund’s recently released U.S. Climate Vulnerability Index (CVI) overcomes some of this bias, presenting a more balanced analysis of disaster losses alongside a large suite of social vulnerability data. In total, the index incorporates 184 datasets, with data available at the national, state, Environmental Protection Agency region, county, and census tract levels. The CVI provides two broad categories of vulnerability: 1) climate baseline, which captures underlying social and physical vulnerabilities; and 2) climate impacts measured by actual exposure, which includes the loss and damage from extreme events and their frequency. In this way, the CVI breaks down climate vulnerability into social vulnerability and exposure to extreme events, enabling analysis that can distinguish whether greater social vulnerability or greater exposure (or both) is driving climate vulnerability across different regions.
Other notable U.S. indexes include Headwater Economics’ Rural Capacity Index, the University of South Carolina’s Baseline Resilience Indicators for Communities (which are used to inform the NRI’s resilience estimates at the county level), and the Climate and Economic Justice Screening Tool, which is also used in federal policy to identify historically marginalized neighborhoods (and was developed based on a California model).
Since the U.S. already has several measures of climate impacts and vulnerabilities, what’s the motivation for tracking race-based gaps in climate vulnerability? While it’s true that efforts to measure climate vulnerability have improved, the existing tools omit crucial measures, obscuring the risks communities face as well as the opportunities for effective, well-targeted, and equitable climate action. These include:
- None of the above-mentioned indexes explicitly show how climate risks and social vulnerabilities vary by race and ethnicity. While the racial makeup of a place is frequently presented alongside other data, no tool allows for reporting on differences by race and ethnicity. While geographic variation does capture race-based differences, this framing incentivizes somewhat of a neutral interpretation of the data, leaving out a key piece of the policy puzzle. Disparities in climate vulnerability are connected to a long history of racially biased policies. Persistent segregation in housing and communities, created and perpetuated to an important degree by public policy, has led to the concentration of Black and Latino or Hispanic communities in areas that are now overexposed to climate-related disasters and environmental pollutants. Similarly biased policies—including in mortgage lending, real estate valuation and sales, and taxation—have also constrained the ability of nonwhite families to build intergenerational wealth. This has left many Black and Latino or Hispanic communities more vulnerable to climate impacts, so that when a disaster occurs, there’s a higher chance that it will cause longer-term damages.
- Most tools do not have the level of disaggregation necessary to reflect uneven climate impacts and risks. Climate impacts are highly localized, with the types of disasters varying geographically and mediated by local differences across and between cities, towns, and neighborhoods. Factors such as urban density, green space, and proximity to hospitals all shape vulnerability in highly localized ways, and even census-tract-level indexes can obscure these differences.
- The existing tools manage to overemphasize exposure and vulnerability and underemphasize resilience and adaptive capacity. While it’s crucial to understand vulnerability and exposure and the extent to which they produce unequal climate risks, resilience needs to be a core component of the future policy conversation. Rather than the inverse of vulnerability, resilience is about the capacity of a community, infrastructure, or individual to cope with and respond to an extreme event. While a vulnerability lens can identify deficits, resilience is good for identifying opportunities. An index of resilience could help identify which communities are best prepared for climate change and why. These insights can be scaled up to inform broader climate action in ways that treat vulnerable communities as leaders and innovators—agents with a vital role. A resilience lens is particularly important for Black- and Latino or Hispanic-majority communities, which are frequently depicted as vulnerable to climate change, yet without evidence and stories highlighting their capacity to be drivers of climate action.
Indexes and policy metrics are important tools. They play a large role in helping policymakers understand risks and allocate public resources to communities that most need them. They have real consequences for access to federal funding, and signal investment needs to the private sector. But the indexes most widely used in the U.S. are lacking in key ways, and in particular, do a poor job of capturing variation by race and ethnicity. In sum, an index with no breakdown by race and ethnicity makes it difficult to design climate policy that advances equity and justice. A better understanding of how resilience and vulnerability vary by race and ethnicity could improve climate equity through more targeted investments in adaptation.
BOX 2: Measuring the climate vulnerability gap
This analysis combines data from the CVI with demographic data, including racial makeup down to the census tract level, from the most recent American Community Survey. The CVI measures climate vulnerability on a scale from zero to 1, with higher scores indicating greater vulnerability to climate impacts. Most of the 70,000-plus census tracts fall within the range of 0.3 to 0.7, with a mean score of 0.5. Importantly, this is a relative measure, meaning that differences in climate vulnerability are indicative only, and don’t represent actual differences in outcomes such as measuring post-disaster asset losses. As an index based on aggregated data across over 180 datasets, the CVI is likely to contain some errors, and results should be interpreted cautiously.
Gaps in climate vulnerability are calculated as the difference between average vulnerability at the census tract level for Black- and/or Latino or Hispanic-majority tracts, compared to the average across all tracts within a given region (for example, nationally, or within a state, region, or metro area). Black- and/or Latino or Hispanic-majority is used as a place-based category to reflect the ways that climate risks and impacts intersect with social inequities in places rather than around households. Black- and/or Latino or Hispanic-majority areas are census tracts, cities, or towns where over 50% of the population self-identifies as Black or Latino or Hispanic (alone or in combination). Three distinct categories are used in the analysis: 1) Black-majority; 2) Latino or Hispanic-majority; and 3) Black- and Latino or Hispanic-majority, where neither Black nor Latino or Hispanic residents compose the majority alone, but in combination represent the largest racial group in the area. The third category is particularly common, but often missed, representing some of the nation’s big cities, including New York, Los Angeles, and Washington, D.C. States and metro areas where Black- and/or Latino or Hispanic-majority census tracts represented less than 1% of all tracts were excluded from the analysis.
While the Black- and/or Latino or Hispanic-majority classification does not comprehensively capture the climate impacts and risks for all Black and Latino or Hispanic Americans (and while these populations are not monolithic within a given unit of geography), it summarizes how risks vary by places that are characterized as nonwhite. Many of these cities, towns, and census tracts have been historically impacted by racially biased policies such as redlining, which have left legacy effects that shape social and climate vulnerabilities today.
Black and Latino or Hispanic communities are less exposed to climate extremes, but substantially more vulnerable to climate impacts nationally and across most states and regions
The remainder of this report analyzes the CVI in combination with census data on race and ethnicity. This analysis demonstrates the ways in which existing data can be used to measure and track how climate vulnerability intersects with race-based inequities.
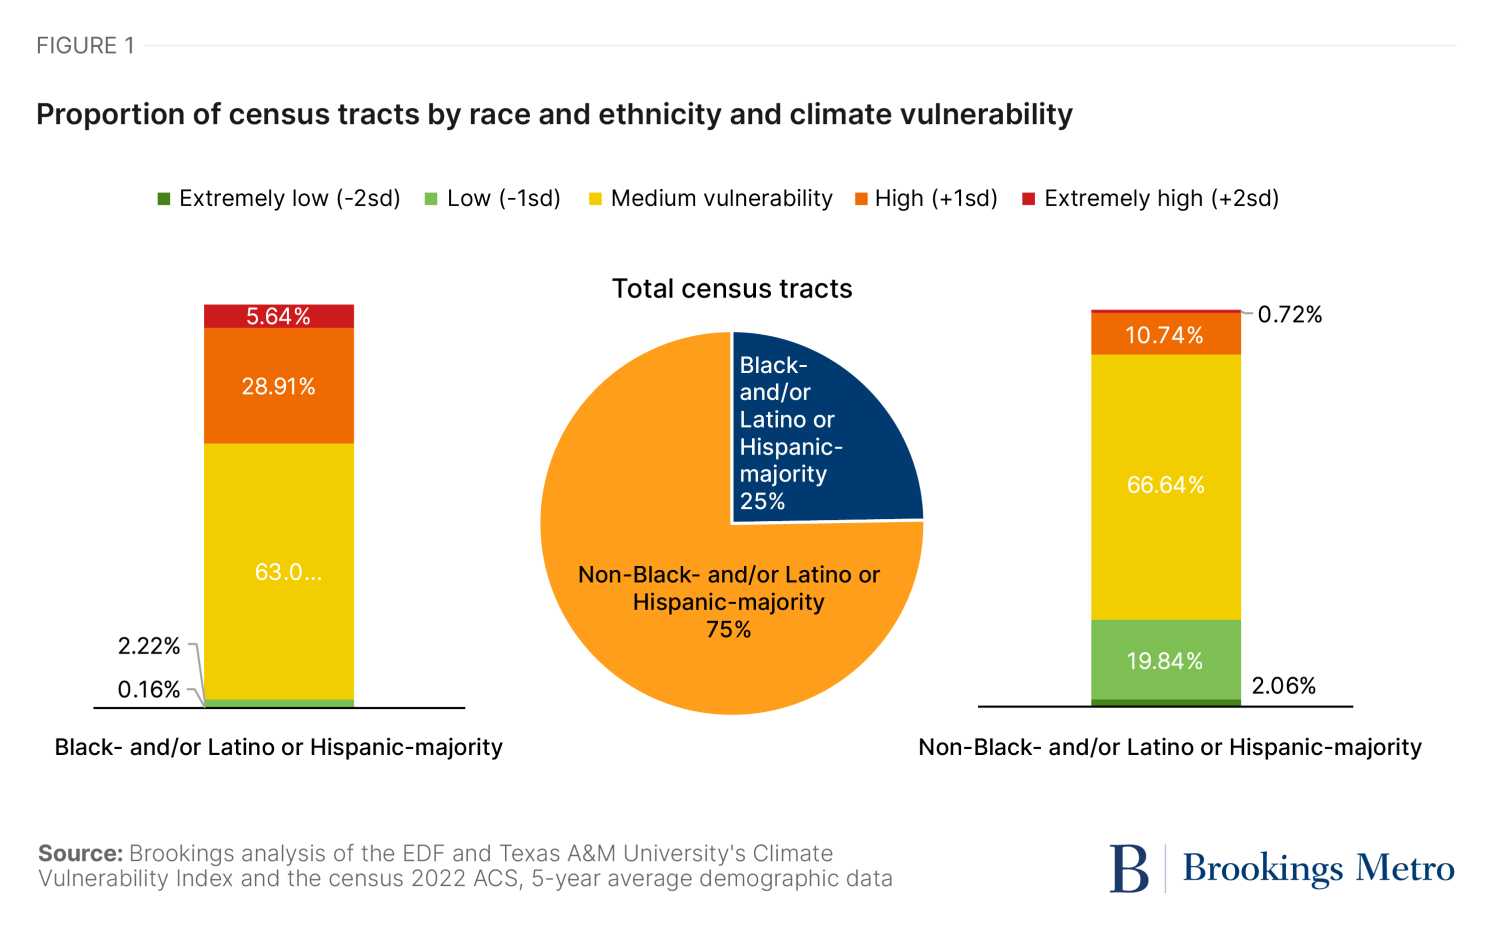
Figure 1 shows that Black- and Latino or Hispanic-majority communities are substantially more vulnerable to climate change than the national average. While only 24.7% of all U.S. census tracts are Black- and/or Latino or Hispanic-majority, 34.6% of these are highly or extremely vulnerable to climate impacts (defined as one and two standard deviations from the national mean of 0.5). By comparison, only 11.5% of non-Black or Latino or Hispanic-majority census tracts are highly or extremely vulnerable. Moreover, only 2.4% of Black- and/or Latino or Hispanic-majority tracts have low or extremely low vulnerability, compared to 21.9% of non-Black and Latino or Hispanic-majority tracts.
At the national level, Black-majority census tracts score 14.4% higher on the vulnerability index than the national baseline, and 19.8% higher compared to census tracts with less than 1% Black residents. The difference is less severe in Latino or Hispanic-majority census tracts, with climate vulnerability an average of 8% higher compared to the national baseline, and only 0.9% higher than in census tracts with less than 1% Latino or Hispanic residents.
However, because exposure to direct climate impacts varies regionally, national estimates can be misleading. These national disparities, while useful at highlighting different levels of vulnerability in the aggregate, may reflect the fact that Black and Latino or Hispanic Americans are more likely to reside in areas with greater exposure to disasters and climate extremes, including the nation’s South. However, Figure 2 shows that even across regions, Black- and Latino or Hispanic-majority areas are, on average, more vulnerable compared to white-majority census tracks.
Figure 2 shows the percentage difference of climate vulnerability scores from the regional average for Black-majority, Latino or Hispanic-majority, and white-majority census tracts. The regional average score is shown in parenthesis next to the region’s name. Across all regions, white-majority tracts score 2.3% to 5.3% lower on the vulnerability index compared to the regional baseline, while in the Midwest and Northeast, Black-majority census tracks are on average 15% and 13.1%, respectively, more vulnerable than the baseline.

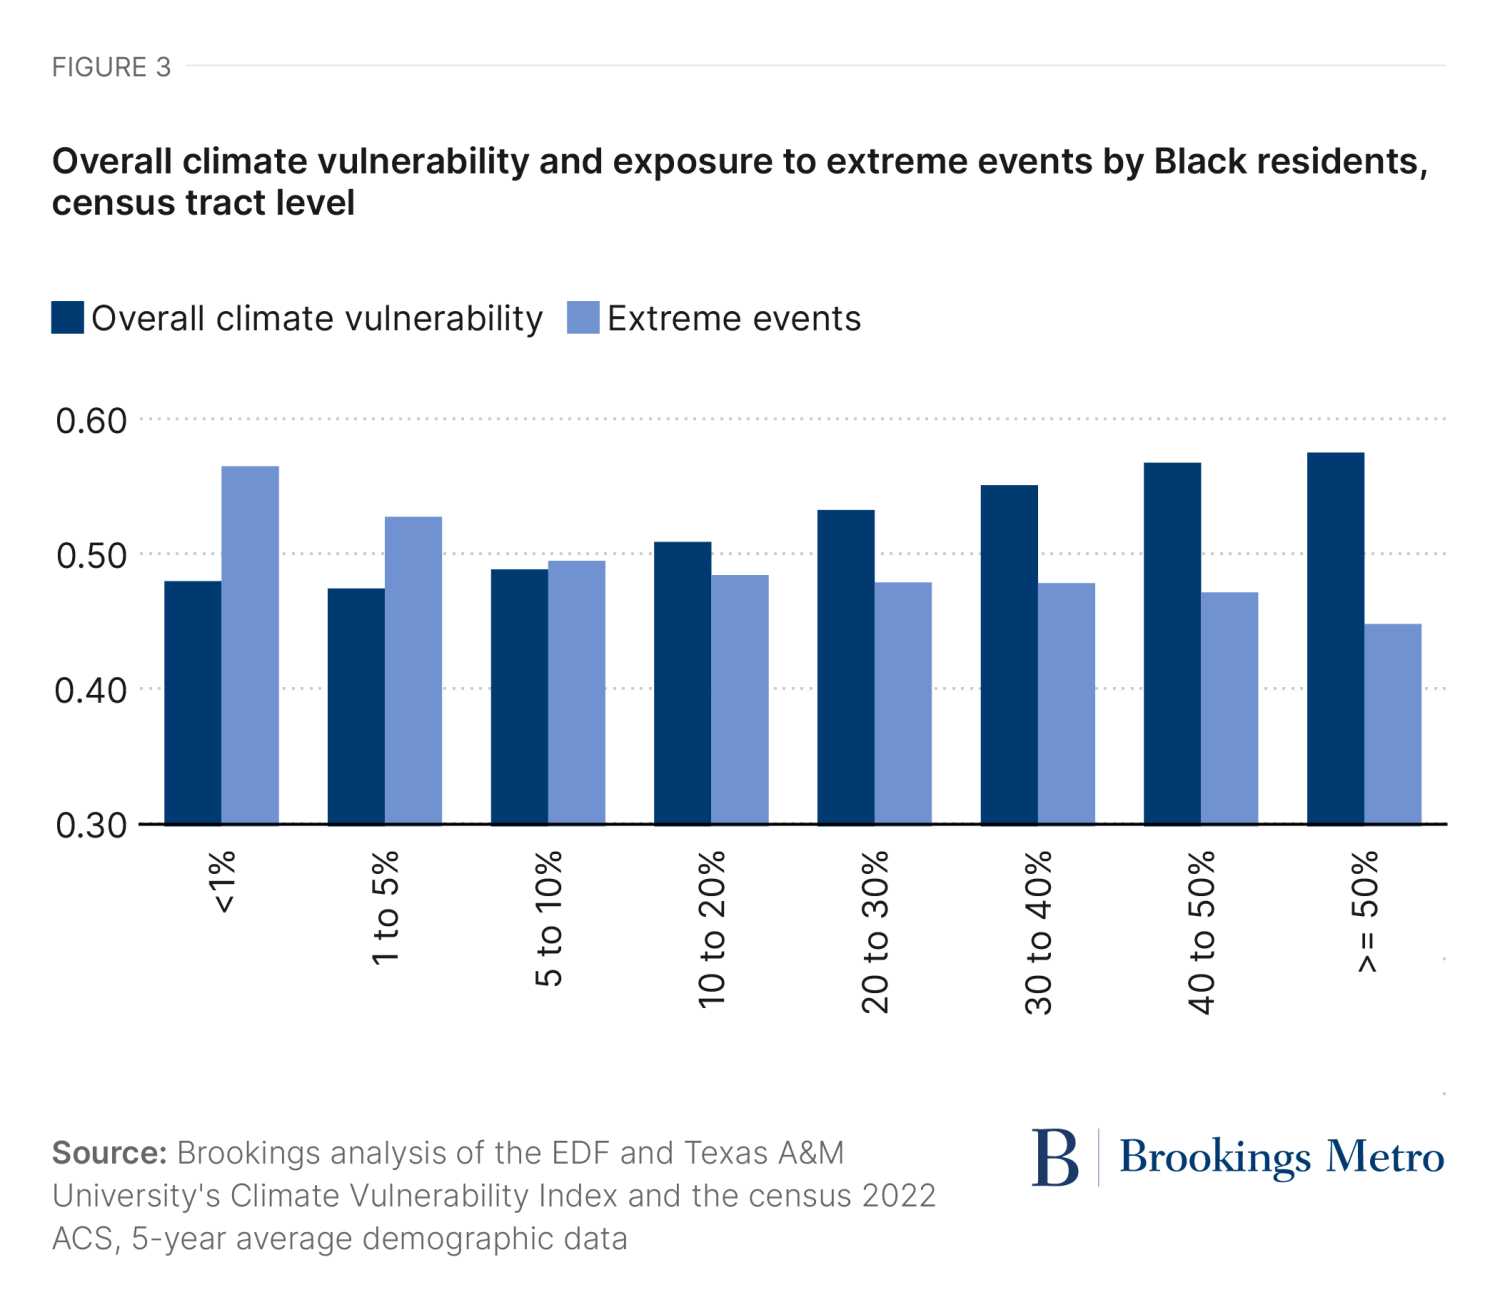
In fact, despite that Black and Latino or Hispanic Americans are more likely to live in areas with high disaster risks, climate vulnerability in Black- and/or Latino or Hispanic-majority census tracts is driven more by social vulnerability rather than exposure to extreme events. Figure 3, for example, shows the rates of overall climate vulnerability and exposure to extreme events for census tracts by the proportion of Black residents. While overall vulnerability is greater in census tracts with a larger proportion of Black residents, exposure to extreme events is lower. In other words, Black Americans are made more vulnerable to climate change not because they face greater hazards than other Americans, but because they have greater social vulnerabilities rooted in place that amplify the impacts of climate change. This finding illustrates the ways that underlying racial disparities, such as those in wealth and health, are driving vulnerability, rather than greater exposure to disasters themselves.
Climate vulnerability gaps are greatest in the Northeast
To provide an indication of how inequitably distributed climate risks are by race and ethnicity, this report presents a new metric to track climate equity: the climate vulnerability gap, which measures the difference in climate vulnerability between Black- and/or Latino or Hispanic-majority census tracts compared to the average for all tracts within a given region or city. Rather than depicting the average rate of climate vulnerability, this metric demonstrates how average vulnerability varies by race and ethnicity. In so doing, the metric illustrates the relationship between climate impacts and racial inequities, and can be used alongside other indicators of climate risks as well as racial progress.
Figure 4 shows the vulnerability gap for U.S. states, comparing the average level of vulnerability for all census tracts in the state to census tracts where Black and/or Latino or Hispanic residents comprise the majority. While almost all states have a positive gap (meaning that climate vulnerability is, on average, higher for Black- and/or Latino or Hispanic-majority census tracts in that state), the gap is greatest in Northeast and Midwest states. This includes Wisconsin, Massachusetts, Rhode Island, Pennsylvania, Kansas, Michigan, Indiana, and New Jersey.
While climate vulnerability is lower for residents in these states on average (and especially compared to the Southeast), these results indicate that lower climate vulnerability is not the case for all residents across those states. For residents living in Black- and/or Latino or Hispanic-majority neighborhoods, climate vulnerability is substantially higher than the state average.
Conversely, in states in the South, where exposure to extreme events is on average greater, climate vulnerability is also distributed more equitably across census tracts. It may be the case that in these states, exposure to extreme events is driving vulnerability more than social factors, meaning that residents face similar levels of vulnerability irrespective of factors such as higher wealth and income. However, average vulnerability for Black- and/or Latino or Hispanic-majority tracts is still higher in these states compared to the state average.

Climate vulnerability gaps can also be measured within cities. In this case, the metric presents the average difference in vulnerability between Black- and/or Latino or Hispanic-majority tracts across a metro area compared to the average for all tracts in the city. Figure 5 shows that like the state-level estimates, differences in climate vulnerability become increasingly more inequitable in cities in the Northeast and Midwest. For example, metro areas across the North—including Boston-Cambridge-Newton, Mass.-N.H.; Grand Rapids, Mich., and Minneapolis-Saint Paul-Bloomington, Minn.-Wis.—have a highly unequal distribution of climate vulnerability. In these cities, average vulnerability for Black- and Latino or Hispanic-majority tracts is between 17% and 18% higher than the city baseline. In these cities, Black -and/or Latino or Hispanic-majority census tracts face substantially higher climate risks than the rest of the city.

To visualize within-city race-based disparities in vulnerability, Figure 6 plots the average climate vulnerability score (y-axis) and the average score for Black- and/or Latino or Hispanic-majority census tracts (x-axis) within the 200 largest metro areas. The 45-degree line shows an equitable distribution across all levels of vulnerability, meaning that average vulnerability for Black- and/or Latino or Hispanic-majority areas at that line is equal to the city average. Metro areas below the line have an inequitable distribution of climate vulnerabilities, meaning that Black- and/or Latino or Hispanic-majority census tracts within the city are more vulnerable than the average. Moreover, the top right quadrant represents metro areas where vulnerability is higher than the national average, and the bottom left quadrant represents metro areas where vulnerability is lower than the national average. The bubbles are scaled by population and colored to show the proportion of Black and Latino or Hispanic residents residing in the metro area.
The graph shows that in only seven of the 200 largest cities is average vulnerability lower for Black- and/or Latino or Hispanic-majority census tracts than the metro area average. Most of these metro areas have less than 30% Black and/or Latino or Hispanic residents in total. On average, metro areas where Black and/or Latino or Hispanic residents comprise the majority are also more vulnerable to climate change, indicated by the cluster of metro areas (shaded in grey) in the top right quadrant of the figure.

Many Black- and Latino or Hispanic-majority cities and towns have low climate vulnerability
Our research has consistently highlighted where and how Black and Latino or Hispanic communities are thriving across the U.S., including for business ownership, entrepreneurship, life expectancy, and well-being. Similarly, there are Black and Latino or Hispanic communities that are less vulnerable to climate impacts than others. Deeper future research analyzing these cities, towns, and neighborhoods could shed light on the factors that help make these communities less vulnerable and potentially more resilient—setting an agenda to learn from and scale up these successes.
These cities and towns exist across the U.S., but most are concentrated in areas less exposed to climate disasters, including Northwest Detroit, New England, the Washington, D.C. metro area, and Northern California. Table 1 provide summary statistics separately for the least vulnerable Black- and/or Latino or Hispanic-majority cities and towns.1 Low-vulnerability Black-majority cities are clustered in Maryland, Michigan, and New York, with eight of the 10 places with the lowest vulnerability in Maryland, including Calverton, Bensville, and Woodmore. The Black-majority town with the lowest rate of climate vulnerability is Lathrup Village, in Northwest Detroit. For Latino or Hispanic-majority cities and towns, low-vulnerability census tracts are clustered around Northern California and the San Francisco metro area, including Aromas, Alum Rock, and Hollister. However, the list also features Key Biscayne, Fla. and Gervais, Ore.

While most of these cities and towns are in regions with less exposure to climate disasters, they also share comparatively higher median household incomes, lower poverty rates, and higher rates of homeownership. All of these variables are correlates of other social and environmental factors that predict longer life expectancies and higher well-being. Table 2 demonstrates the importance of these social predictors in estimating climate vulnerability in addition to exposure to disasters. The table presents low-vulnerability Black- and/or Latino or Hispanic-majority places in high-vulnerability regions (the South and Southwest). Despite being in regions with higher disaster risks, these cities and towns all share higher rates of income and homeownership, which can provide a type of safety net after a disaster occurs.

Policy and research should work toward a more comprehensive picture of climate resilience—not just vulnerability
This report has introduced the concept of the climate vulnerability gap as a metric to track how climate impacts and risks intersect with racial inequities in place. This metric can help policymakers identify and reduce racial inequities in climate impacts and risks in a parallel way to how racialized gaps in wealth, well-being, business ownership, and health are used periodically to assess progress on racial justice. These types of metrics will be crucial to help policymakers, especially at the local level, tackle climate inequities in ways that also advance inclusive local economic development.
This analysis shows that climate vulnerability gaps by race are significant, including across most states and metro areas. While the hazards that different communities and regions face vary, for most Black- and Latino or Hispanic-majority cities, towns, and neighborhoods, climate vulnerability is driven more by racial differences in underlying social vulnerability than exposure to hazards. Finally, the analysis in this report demonstrates that the experience of Black- and Latino or Hispanic-majority communities is not monolithic, and despite these vulnerability gaps, there are numerous metro areas where Black- and Latino or Hispanic-majority neighborhoods are substantially less vulnerable than the city and regional averages. This finding provides an important corrective to the notion of communities of color as monolithically more at risk of climate impacts. Future research should seek to understand the factors that are driving lower vulnerability in these cities and neighborhoods, and how they align or differ from factors in other U.S. cities and towns.
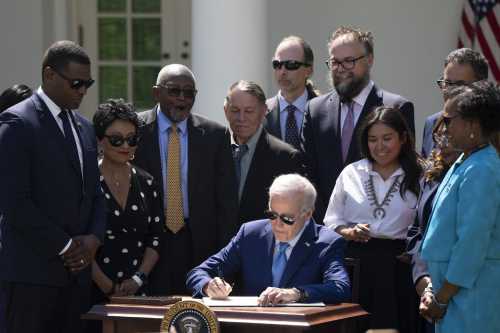
However, a key part of the climate policy puzzle is missing: resilience. By overemphasizing vulnerabilities, researchers and policymakers can miss the successes occurring within communities, and the lessons that they can hold to scale up climate action. Alongside efforts to measure vulnerabilities, a climate resilience index that is sensitive to differences in resilience by race and place could better identify and learn from diverse communities that are already successfully responding to climate impacts. Recent steps nationally are promising. Last year, the Biden-Harris administration released the first-ever National Climate Resilience Framework, and there have also been guidance documents, including by the Office of Management and Budget, explaining how to incorporate climate resilience into infrastructure investments. These documents signal a greater recognition by national policymakers and program leaders of the importance of resilience across federal government functions and as a goal for state and local policymakers.
The incoming Congress should look to build upon bipartisan climate successes from the Biden-Harris administration’s time in office, most notably the Inflation Reduction Act (IRA), to legislate a national plan for climate resilience. What the IRA did successfully, in addition to setting substantial incentives for decarbonization, was to ignite a focus on justice and equity in national climate policy, helping to ensure that vulnerable groups are provided additional support to adapt to climate change. Legislation on resilience is the most necessary area to capitalize on and redouble these efforts. For now, researchers need to start laying the empirical groundwork for a policy architecture to invest in and strengthen resilience.
Author
-
Footnotes
- These cities correspond to the “census-designated places” geography, representing unincorporated places that are locally recognized. Alongside cities such as Chicago, the category also includes much smaller towns with populations of less than 100.
The Brookings Institution is committed to quality, independence, and impact.
We are supported by a diverse array of funders. In line with our values and policies, each Brookings publication represents the sole views of its author(s).