
In recent years one of the most often heard quotes from Dr. King has been:
“I have a dream that my four little children will one day live in a nation where they will not be judged by the color of their skin but by the content of their character.”
Some parties focus only on the second part of the quote, using it as support for color-blind policies—including ending affirmative action. Perhaps less discussed is whether the dream has come to fruition.
While only 2% of the adult U.S. population holds a doctorate, those that do wield considerable influence on education, from early childhood through postsecondary studies. About 10% of public school principals hold a doctorate as do more than half of superintendents. On college and university campuses, who teaches students especially matters–research shows that students of color benefit from having a professor, law school instructor, or teaching assistant “like me”, with associated improvements in student performance and persistence in educational attainment. Outside of education, racial match affects health outcomes for children and their families, with Black patients reporting longer and more participatory appointments from a same-race doctor.
Yet the racial composition of those earning doctorates looks very different from the racial composition of the general population, raising questions of whether the benefits of racial representation in doctorate-level professions can be realized. Here I focus on whether American doctoral programs have yet achieved rough racial and ethnic parity. (For a report that university faculty have not reached parity, see “Faculties So White” in Inside Higher Ed)
The short answer is “no.” Figure 1 shows the shares of doctorates (among Americans) going to different groups relative to the same group’s share in the resident population (age 25 and over). If the relative share is 100, then the group has parity.
Before going into detail, some caveats are in order. Discussions of diversity in universities center on the term “underrepresented minorities,” abbreviated here as URMs. This usually means Black, Hispanic, and Native Americans, and excludes Asian-Americans even though they are also a minority. Historically, no multiracial data was collected, although sometimes it is now. These groups are all so broad that treating them as homogenous often makes little sense. Not only is there heterogeneity within a group, there is also considerable heterogeneity across time—particularly because of changes in immigration patterns. The data counts doctorates for American citizens and permanent residents, excluding those studying on a student visa. And while I am using the official government data, that data is surely imperfect.
So, with these caveats in mind, we should be looking for large differences between groups and for large changes over time; small differences might not signify much. As you can see in Figure 1, the differences are not small, unfortunately.
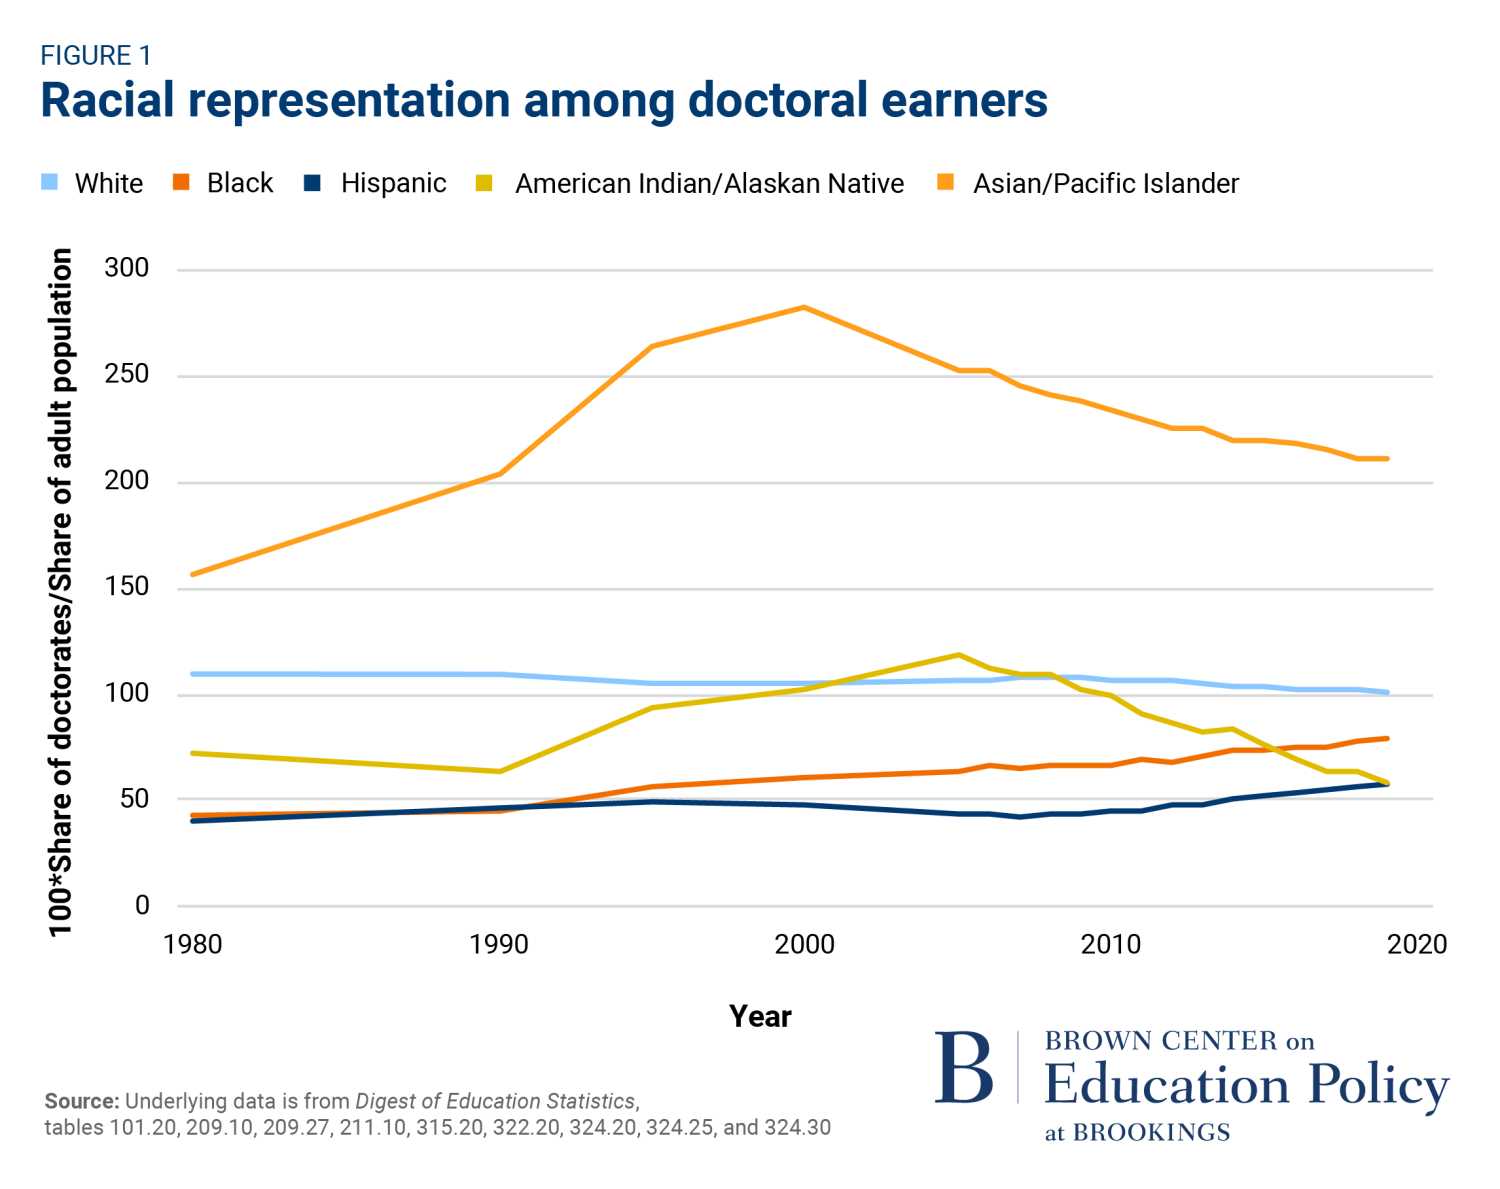
Remembering that a score of 100 means parity, the unsurprising result is that the relative share of doctorates going to the white majority group (in blue) has been consistently just over parity for decades. Asian-Americans earn doctorates at a rate much higher than their share in the population (i.e., they are clearly not underrepresented among doctoral earners).
What about URMs?
Decades back, Native Americans (yellow line) received only three quarters of the number of doctorates one might expect. That rate improved greatly over time, even meeting parity for about a decade, and then fell back to half the number needed for parity by 2020. Native Americans make up a small fraction of the U.S. population, which means that small numbers might lead to some data inaccuracies but not a factor of two.
Hispanics (navy blue line) receive far less than a parity share of doctorates. There has been some small, slow improvement with the Hispanic ratio going from about two fifths to about three fifths of the parity rate.
Decades back, Black doctoral earners (dark orange line) also amounted to only about two fifths of parity. There has been significant but incomplete improvement in the share of doctorates awarded to Black people, now at about four fifths of what one might expect.
So, both Black and Hispanic Americans receive well below their share of doctorates, but the share is increasing. We can ask: “How long will it take for URM groups to reach parity, given historical rates of improvement?” As a rough calculation, the Black share rose from 43% to 79% in 39 years—a rate of almost 1 percentage point a year—with a remaining gap of 21 percentage points. Thus, if we assume similar trends in doctoral attainment and in demographic growth in the coming years, the answer is another 22 years for Black doctorates. The same calculation among Hispanics suggests it would take 90 years to reach parity. These outcomes cut against arguments for abandoning affirmative action today.
I turn now to a more focused look at doctorates that are most relevant for the nation’s research mission and for staffing universities. In Figure 2, I focus on research doctorates—i.e., professional degrees like Juris Doctors and Doctors of Medicine are excluded. I show the distribution across STEM fields (science technology, engineering, and math), education, social sciences, the humanities, and all others, with the proviso that the government counts economics and psychology degrees here as social sciences even though many degrees in these fields are officially classified as STEM. (I have omitted Native Americans because the numbers are so small.)
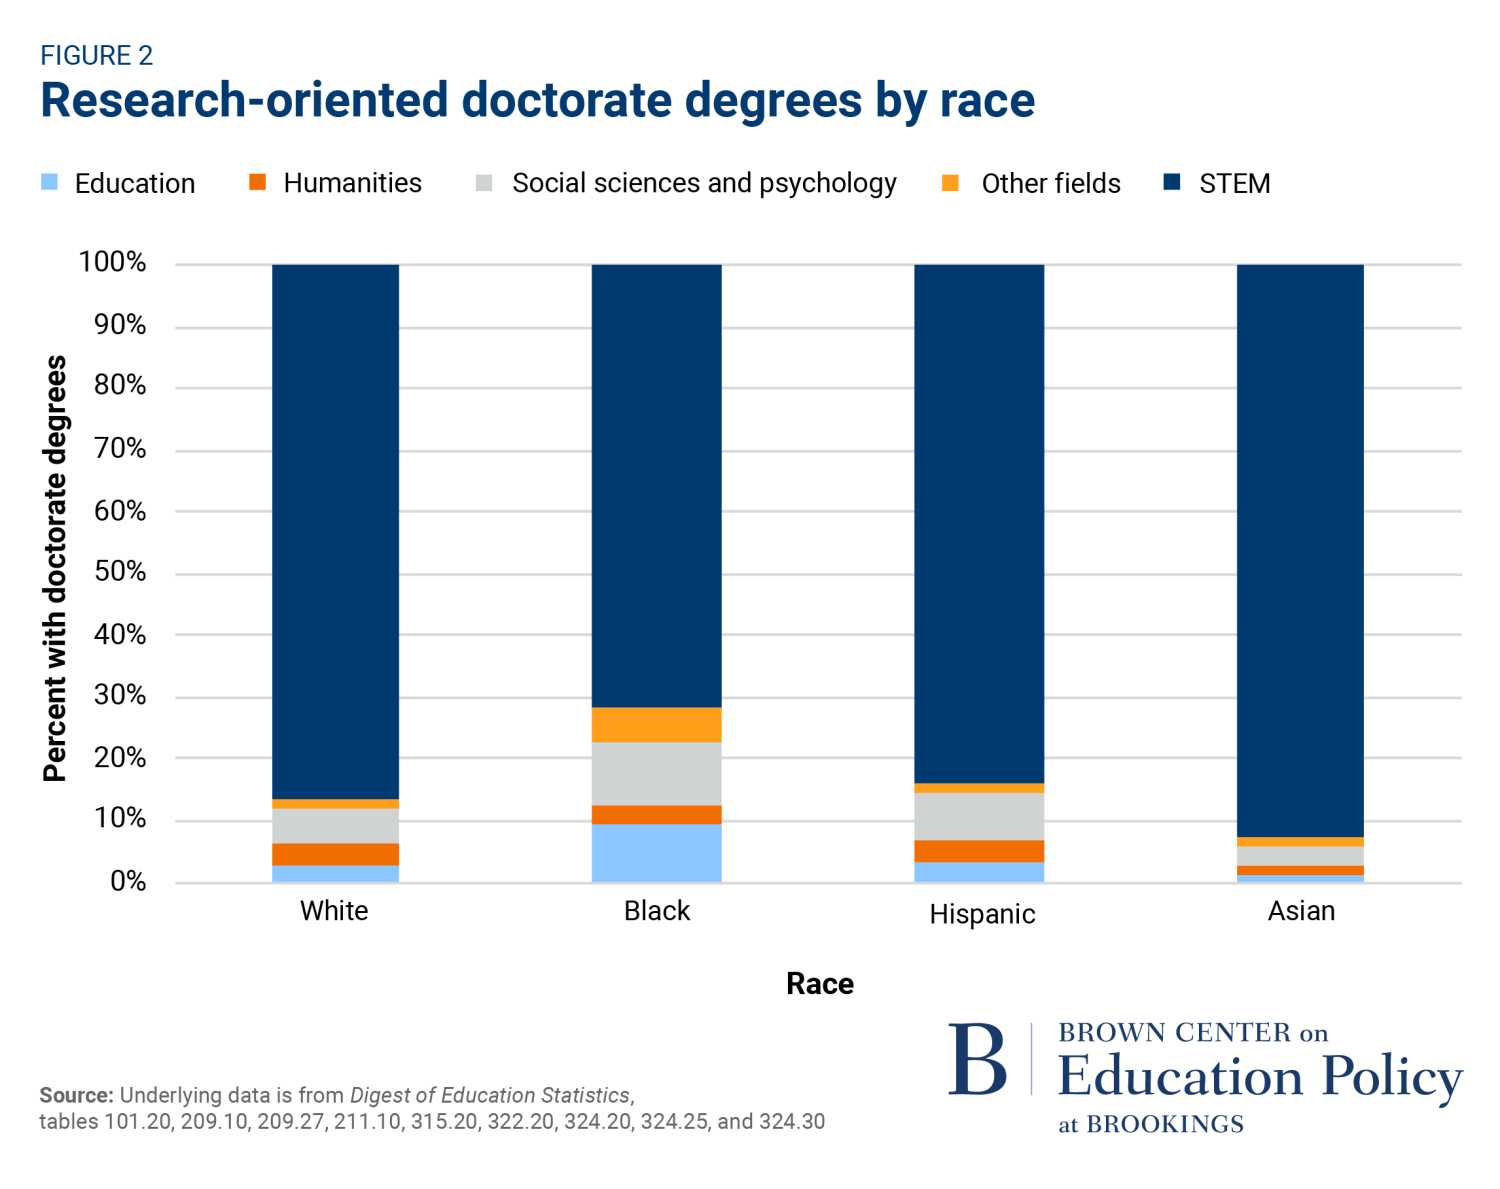
Two related facts about URM doctorates stand out in Figure 2. Black research doctorates are much less likely to be in STEM fields than is true for other groups. In particular, Black research doctorates are disproportionately in education. Black doctoral candidates earn about 16% of the research doctorates in education and about 16% of the research doctorates in STEM fields. Compare this to the fields chosen by Asian candidates, who earn only 5% of the degrees in education but more than half of the STEM degrees.
URM doctoral degrees are particularly sparse in social science fields, a pattern that also holds in my discipline, economics. The American Economic Association’s Committee on the Status of Minority Groups in the Economics Profession (CSMGEP) reports that in the most recent year only 12% of STEM doctorates awarded to Americans went to URMs. In the most recent year on record, out of the 1,219 economics doctorates awarded in the United States, two went to Native Americans. And five went to Black women.
One explanation for the dearth of URM doctorates is the “pipeline.” The claim is that it is difficult to recruit URM doctoral students because there are few URM students earning bachelor’s degrees. There is some truth to this: In the most recent data, URMs received 21% of STEM bachelor’s degrees and make up about 29% of the adult population, yet they receive just 12% of STEM doctorates. In other words, it is true that URM bachelor’s degrees are below their population share, but URM doctoral degrees are much lower. Much progress has been made on URM bachelor’s degree attainment in recent decades, but only some of this progress has carried over into doctoral degree attainment.
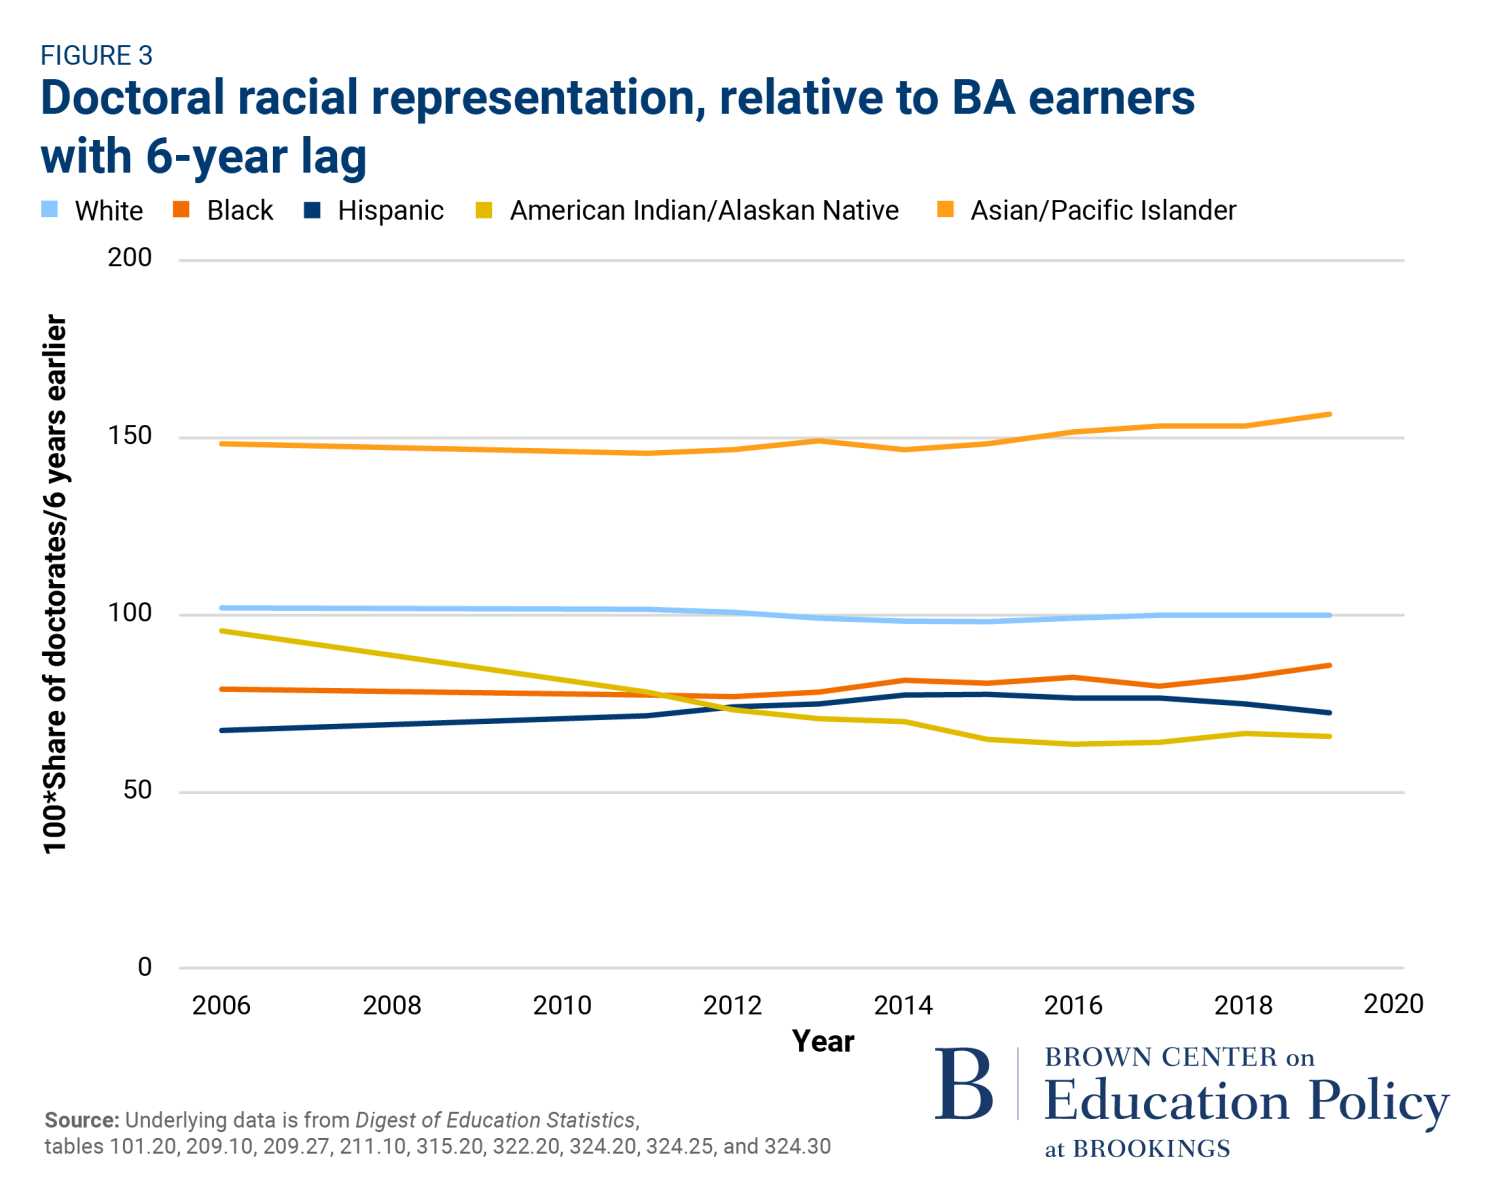
One explanation sometimes offered for low representation numbers is that it takes time for the pipeline to grow. The idea is that as there are more minority undergraduate degrees, then more doctoral degrees will be earned too, but with a bit of a lag. However, there continues to be greater attrition along the path from undergraduate to doctorate for URMs than for others. In Figure 3, I show the ratio of doctorates to bachelor’s degrees granted 6 years earlier, using 6 years as roughly the time it takes to earn a doctorate (time-to-degree varies considerably across disciplines, and of course not all doctoral candidates proceed directly from college to a graduate degree). If the pipeline argument explained all, then the data in Figure 3 would be along the 100-point horizontal line. The URM data is below that line—and upward progress is difficult to discern. The downward sloping trendline for American Indians is especially discouraging and should raise alarms for higher education institutions serving native student populations. This means that improvements in the pipeline will not mechanically bring us to doctoral parity.
We need to stop blaming the pipeline, as it’s evident that representation in the pipeline is not the primary bottleneck in doctoral degree completion, but it’s attracting racially diverse individuals into doctoral programs. However, there are interventions and policies that can increase doctoral diversity. Money and attention matter. Larger fellowship packages and financial support significantly increased Black applications and enrollment in one education doctoral program. At the City University of New York (CUNY), administrators focus on exposing undergraduates to graduate school opportunity and providing them with application preparation support and access to research opportunities to develop their potential graduate interests. Focusing on education doctorates, “Grow Your Own” programs focus on building the diversity of prospective school leaders through coordinated pathways and mentorship. In economics, the American Economic Association has long run a successful summer training program to help undergraduates prepare for graduate admissions and for graduate school.
The representation of underrepresented minority groups at the doctoral level has improved—indeed, it has improved substantially. However, representation remains well below parity in the population and there seems to be little reason to believe “benign neglect” will resolve the issue. Regardless of any future Supreme Court decisions, affirmative steps to attract underrepresented groups into programs at the highest levels of education—especially in STEM areas—continue to be needed.
Related Content


Author

The Brookings Institution is committed to quality, independence, and impact.
We are supported by a diverse array of funders. In line with our values and policies, each Brookings publication represents the sole views of its author(s).


