
Government-funded food assistance and cash transfers serve as crucial tools for alleviating poverty and inequality, with millions of families across the U.S. relying on social safety net programs to help meet their basic needs. State and federal policies interact to determine eligibility and benefit levels, resulting in 51 distinct safety nets in each of the states and District of Columbia. Here we characterize the evolution of the safety net for single-parent families over time—from 2001 through 2022—and across states. To see the data for yourself, visit our new State Safety Net Interactive.
Data on safety net expenditures conflate need and program design. If we see high per-capita spending in a state, it might be because its safety net policies are generous, or it might be because there is a high poverty rate in the state. Increases in spending during recessions might arise because states change their program rules or because more families are facing hardship and qualify for existing programs.
To isolate the generosity of safety net program rules, we calculate the benefits theoretically available to a fixed group of single-parent families if they lived in different states and years and fully accessed the programs for which they were eligible. This approach (detailed in the data appendix) allows us to effectively hold constant earnings and demographic factors that influence safety net eligibility so that we can assess how safety net policy itself has evolved. We aggregate average values of food and cash benefits available to this fixed group of single-parent families into an index of generosity reported in 2022 dollars. When the index rises or falls, it is because of changes in state or federal program rules.
Explore the State Safety Net Interactive
We describe the index as representing eligibility and benefits available to a “typical” or average single-parent family, but it is important to note the index does not reflect actual benefits received by any particular family. Family characteristics in each state and year vary, so actual benefit eligibility differs from what is suggested by the index. In addition, there is incomplete take-up: Not all families access programs for which they are eligible, but the index describes safety net benefits available according to program rules.
Our analysis focuses on five key safety net programs: Temporary Assistance for Needy Families (TANF), the Earned Income Tax Credit (EITC) at the federal and state levels, the refundable portion of the Child Tax Credit (CTC), and the Supplemental Nutrition Assistance Program (SNAP). These programs totaled more than $170 billion per year in federal spending as of 2019.1 Spending on these programs increased substantially during the COVID-19 pandemic: For example, SNAP spending more than doubled from around $60 billion in 2019 to around $127 billion in 2021. SNAP is a food assistance program; the others provide cash transfers. SNAP, the Federal EITC, and the CTC are entirely federally funded, while TANF is jointly funded, and state EITCs rely on state funds.
Figure 1 shows the safety net generosity indices over time for the U.S., reflecting the average benefits that a constant group of single families could receive if they participated in the safety net programs to the full extent possible. The index determines benefit amounts according to state and federal rules given earnings and family structure and takes into account interactions across programs.
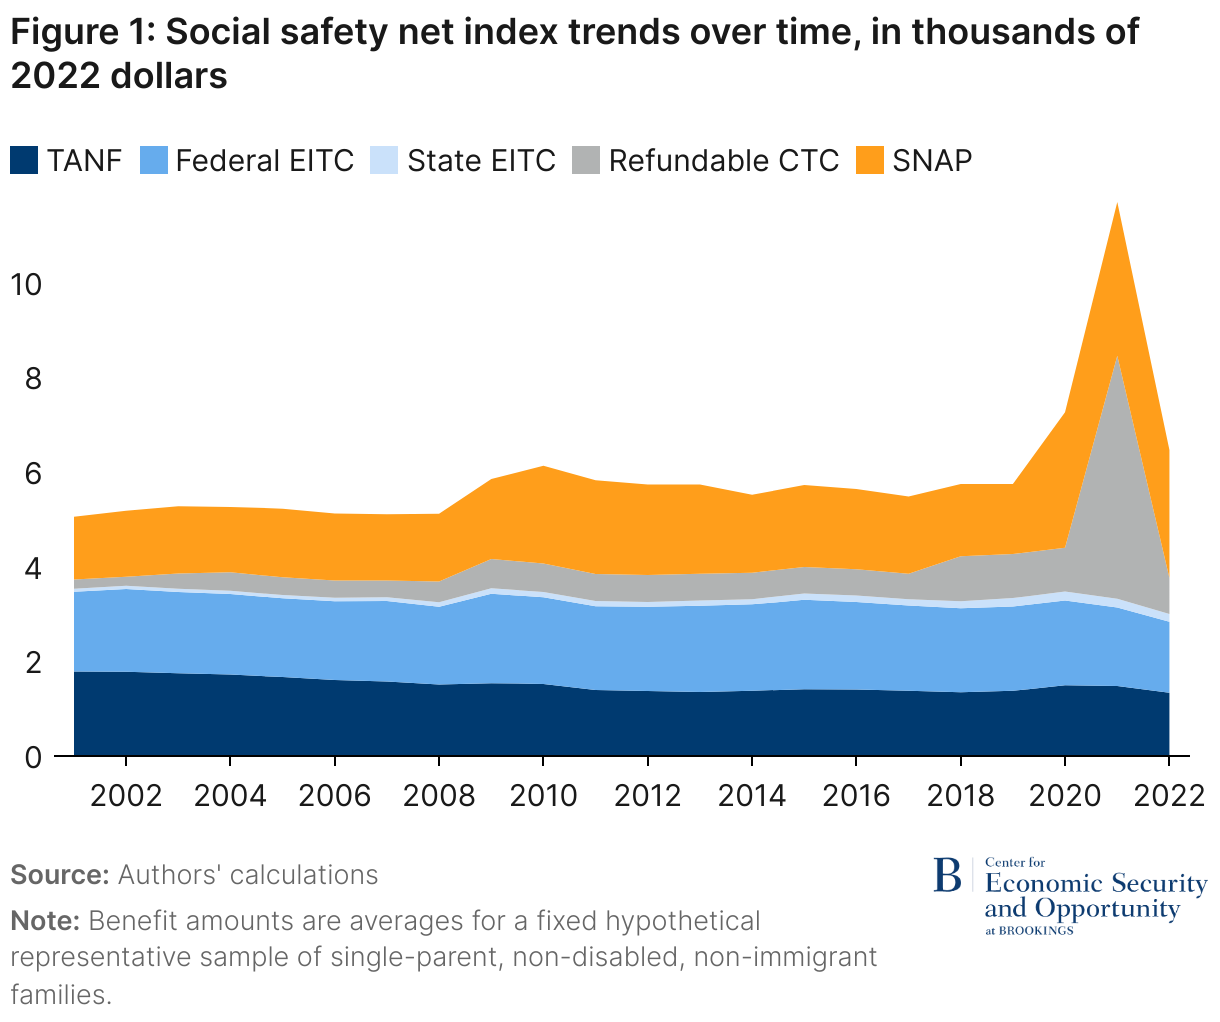
Prior to the COVID-19 pandemic, the largest jump in safety net generosity occurred during the Great Recession, primarily driven by SNAP, federal EITC, and CTC rule changes. As of 2019, the combined generosity index had increased by about 14% since 2001. Of all programs, the dollar amount of the refundable CTC had increased the most, followed by SNAP. TANF was the only program with a decrease in real benefit value over the 2001-2019 period.
COVID-19 prompted an unprecedented spike in benefits. The combined cash and food generosity index more than doubled between 2019 and 2021—from $5,748 to $11,704. This jump was predominantly due to temporary SNAP and CTC increases. By 2022, the CTC expansion had expired and SNAP benefits declined, although they remained above their 2019 level.2
Below, we describe each of the safety net programs included in our analysis and highlight key policy changes.
Temporary Assistance for Needy Families (TANF)
TANF, the Clinton-era reincarnation of traditional cash welfare, provides cash assistance to very low-income families with children. It is jointly funded by states and the federal government, with the federal government contributing $16.5 billion annually to the program in the form of block grants. States have flexibility in how they use these funds, and only about 23% of TANF spending was allocated to cash transfers in 2021. (TANF block grant funds can also be used to support job training programs, child care, or a variety of other programs, and these other uses are not included in the index of TANF generosity.)
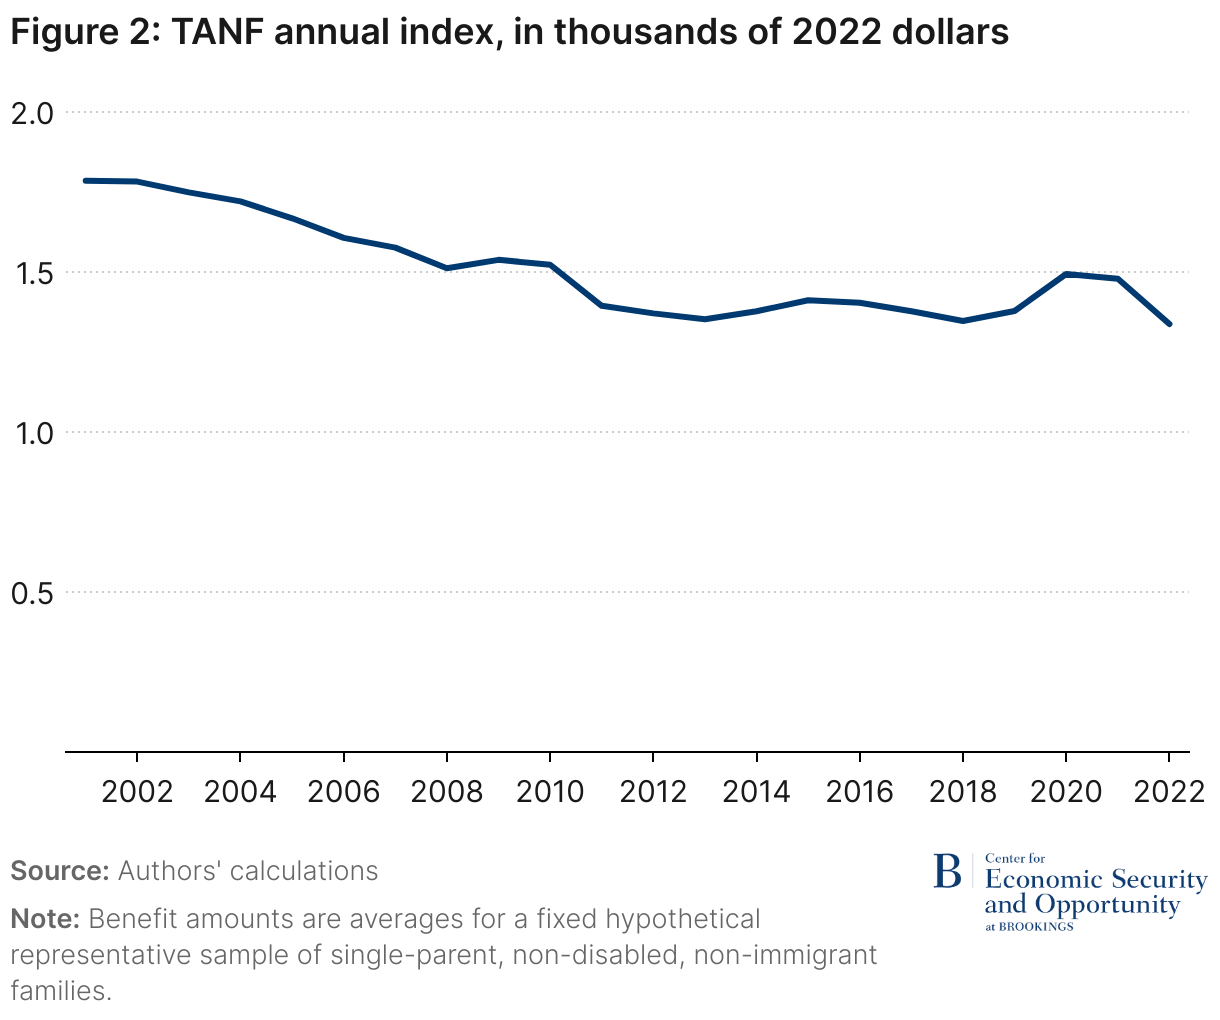
The TANF generosity index varies significantly across states. In 2019, it ranged from $363 (Mississippi) to $3,379 (Wyoming). TANF is especially important for single-parent families with little or no earnings, so the lowest-income families face substantial disparities based on their state of residence.
From the national perspective, the inflation-adjusted value of the TANF benefit index has generally been in decline since 2001 (Figure 2). However, from 2018 to 2021, TANF benefits increased by 10% because some states changed their program rules to increase generosity. (Information on the complex benefit rules in 2022 is not yet available, so we carried forward pre-existing rules. This results in an apparently eroded real value of benefits in 2022 given the unexpectedly high inflation; the true decline may be less steep.)
Federal Earned Income Tax Credit (EITC)
The federal EITC is the largest cash transfer program in the U.S. EITC benefits depend on a number of factors including marital status, number of dependents, and income. The tax credit is refundable, meaning that recipients can claim benefits that more than offset income taxes owed. In other words, those with modest earnings often receive substantial “cash back” when they file income taxes, and in this way the program plays an important part in the safety net. Those without any earnings are not eligible for the EITC, meaning it doesn’t reach the poorest families. Figure 3 shows the EITC generosity index for single-parent families over time.
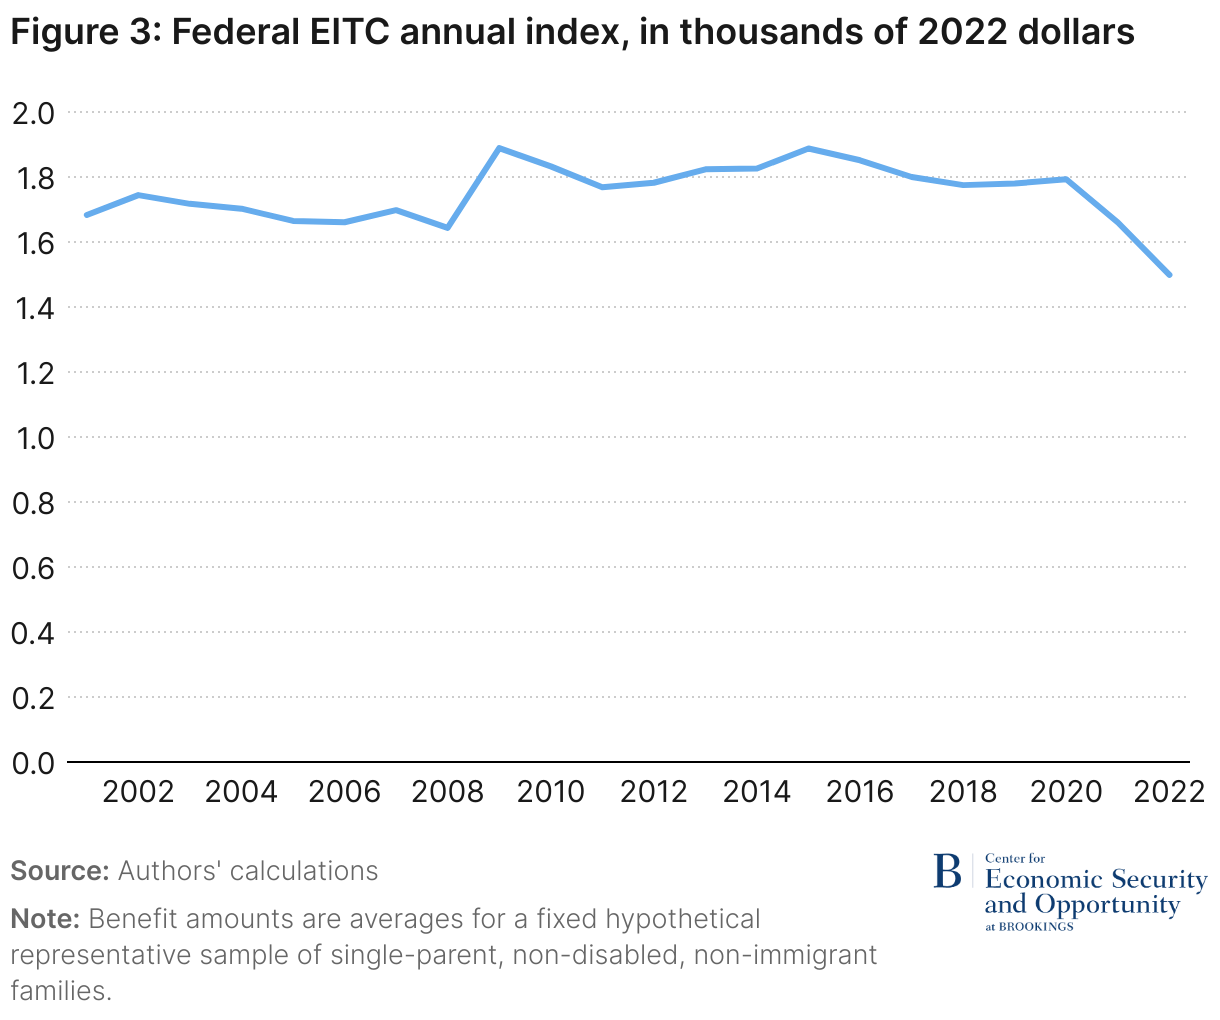
Federal EITC generosity for single-parent families has generally remained stable since 2001, except for a 2009 expansion which boosted the maximum credit from $5,028 to $5,657 for families with three or more children. The index of federal EITC generosity increased by 15% between 2008 and 2009.
Notably, there was a drop in the federal EITC index between 2020 and 2022, which we attribute to a reduction in the inflation-adjusted value of benefits due to unexpectedly high inflation.3 We expect this change to reverse in subsequent years as inflation returns to more predictable levels.
State Earned Income Tax Credit (EITC)
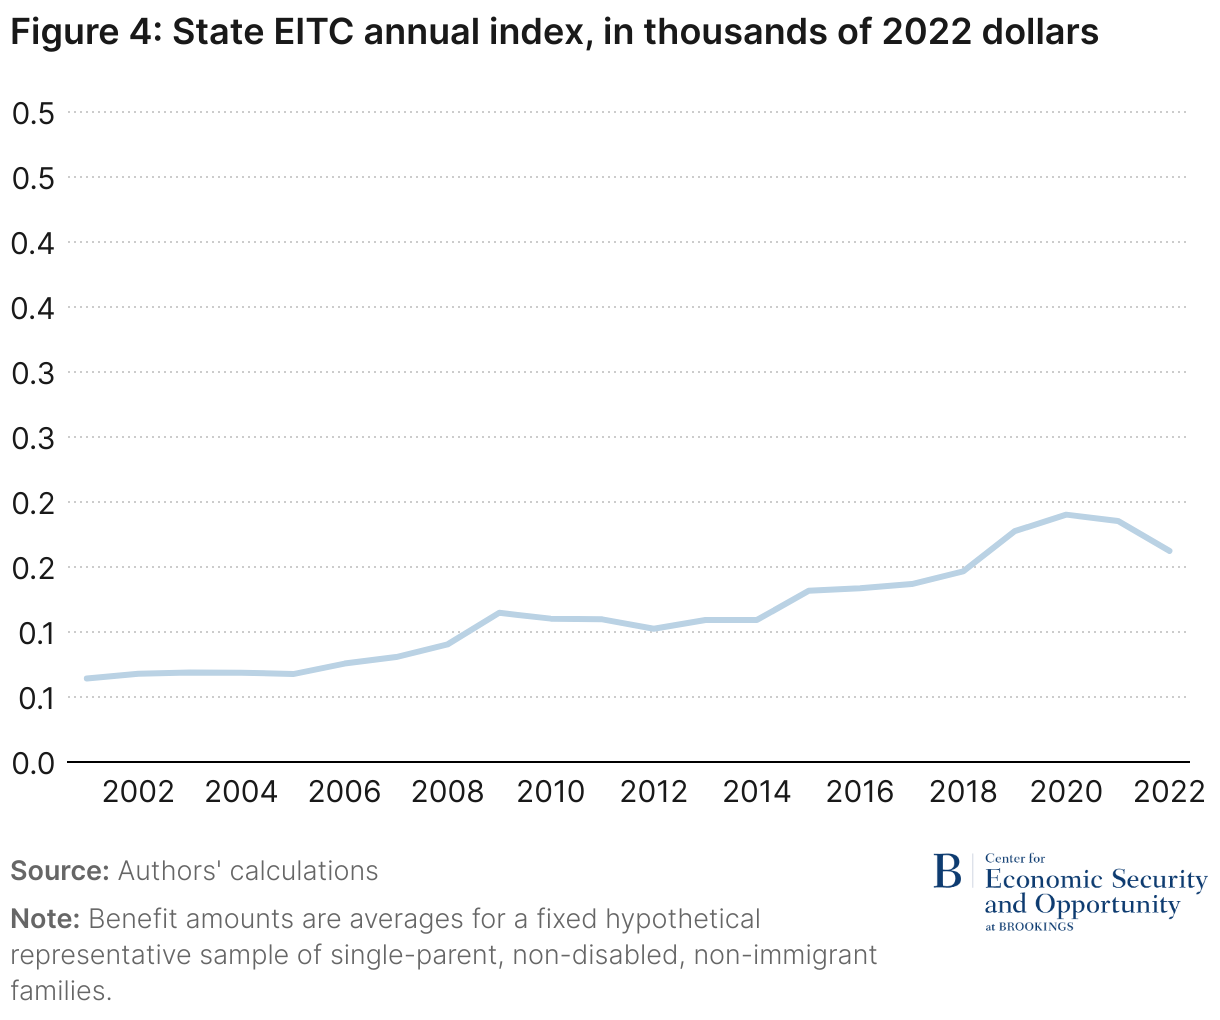
As of 2023, 31 states and the District of Columbia have their own EITC on top of the federal EITC, a number that has grown in recent years. With the exception of four states, all state EITCs are refundable. Most states with refundable credits calculate their EITC as a percentage of the federal EITC, ranging from 3% (Montana) to 70% (District of Columbia).
Even in states that have them, state EITCs typically comprise a small share of total safety net benefits. However, as illustrated in Figure 4, the state EITC index has increased by around 150% since 2001.4
Child Tax Credit (CTC)
The CTC is a tax credit provided to low- and middle-income families for each dependent child under age 17 in the family. Our analysis focuses on the refundable portion of the CTC, shown in Figure 5.
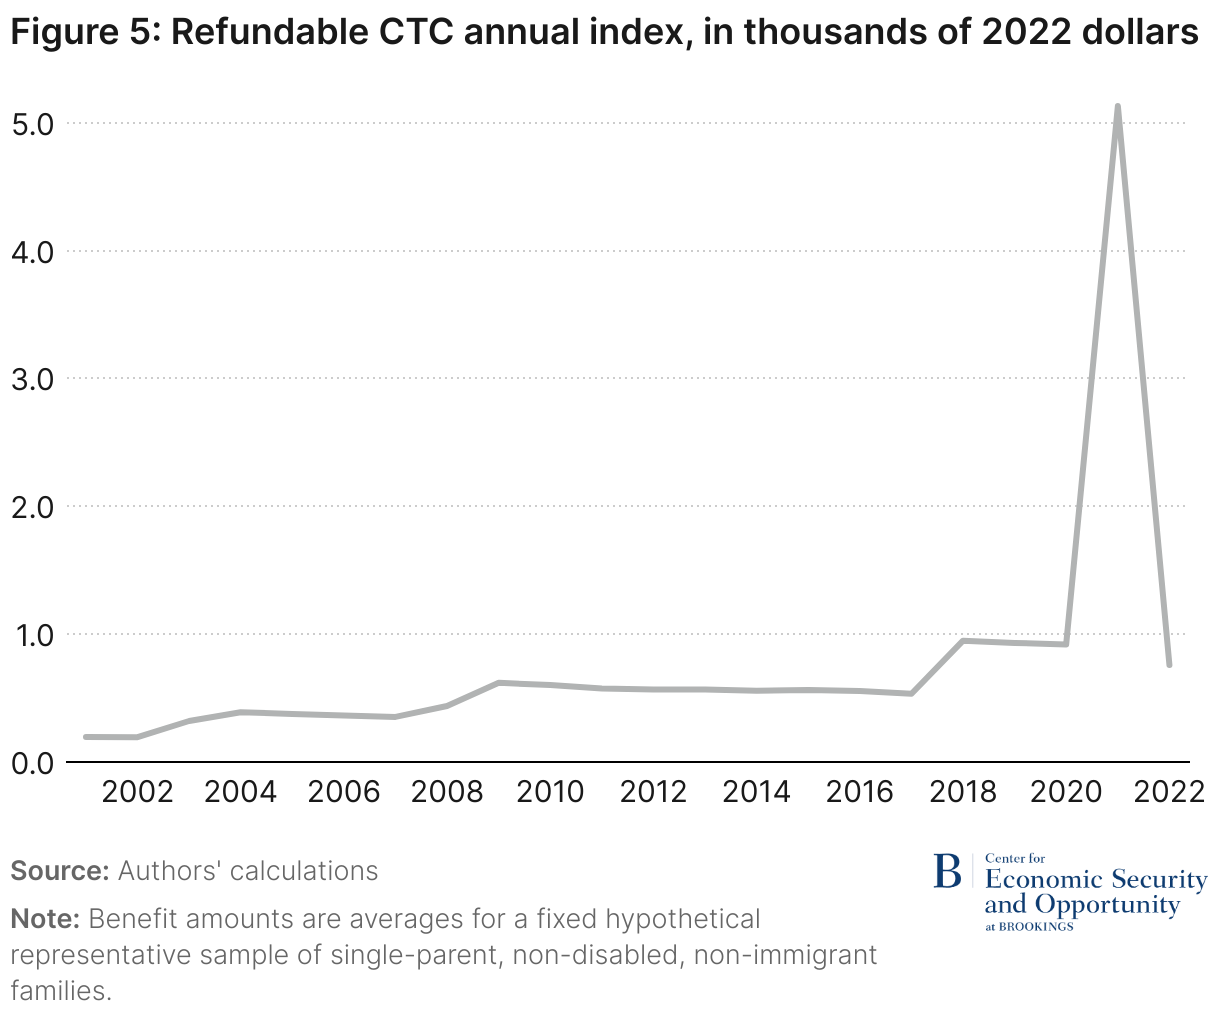
Recently, there have been two significant changes to the CTC. In 2017, the Tax Cuts and Jobs Act (TCJA) doubled the maximum CTC from $1,000 to $2,000 per child, of which up to $1,400 is refundable. Like the EITC, the CTC does not provide benefits to families without earnings, but it can generate meaningful transfers to those with low incomes. The 2017 policy also significantly increased the phaseout threshold—for instance, single-parent families with incomes of up to $200,000 can now receive the credit. These changes are reflected in the CTC generosity index, which shows a 78% increase between 2017 and 2018. Notably, the TCJA’s CTC provisions are set to expire in 2025.
The American Rescue Plan, passed in March 2021, increased the maximum refundable CTC for 2021 to $3,600 and $3,000 for children under six, and ages 6 through 17, respectively. The CTC also temporarily became available to families with less than $2,500 in earnings, which had not previously been the case. There was a monumental 458% increase in the CTC generosity index between 2020 and 2021 due to these changes. The CTC returned to around its 2020 level in 2022 and is slated to return to its 2017 level in 2025 in the absence of additional legislation.
Supplemental Nutrition Assistance Program (SNAP)
SNAP—previously called the Food Stamp Program—is a federally-funded initiative that provides financial support for food purchases through an electronic benefit card. Figure 6 focuses on how the SNAP generosity index has changed over time.
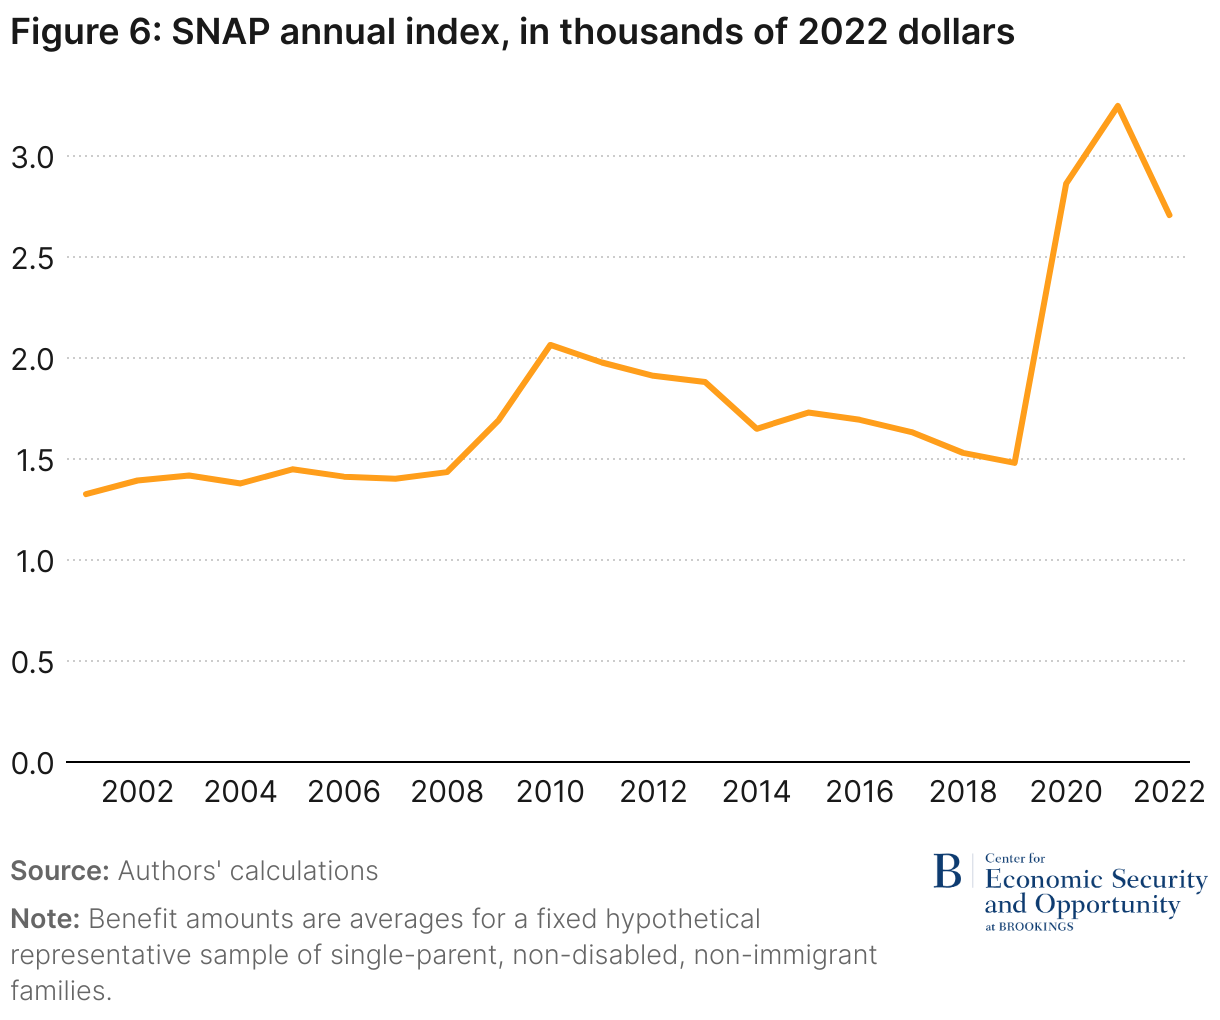
As illustrated, the largest SNAP rule changes occurred during the Great Recession and COVID-19 pandemic. As part of the American Recovery and Reinvestment Act of 2009, Congress increased SNAP benefit levels for eligible households. The SNAP generosity index increased by 44% between 2008 and 2010. The 2009 SNAP increase expired in late 2013, when average benefits declined but remained above 2008 levels due to other program changes.
During the pandemic, the government introduced two SNAP expansions. First, as it had been directed by Congress in 2018, in 2021 the Department of Agriculture updated the Thrifty Food Plan, a budget for adequate nutrition that affects benefit amounts. This resulted in increasing the average monthly SNAP benefit per person by $36.24—about a 21% increase. Legislation now mandates that the plan be reevaluated every five years.
In addition, in March 2020 the federal government started offering additional emergency SNAP allotments of at least $95 a month to eligible recipients, with certain households receiving up to $250 extra each month. These allotments remained in effect for recipients in most states until the end of February 2023, when the federal government’s public health emergency declaration expired. However, 18 states chose to end their state-wide emergency declaration earlier, leaving their residents no longer eligible for emergency allotments.
These two changes led to a doubling of the SNAP generosity index between 2019 and 2021. The 2022 benefit level fell substantially but remained 83% above the 2019 level, reflecting a combination of the Thrifty Food Plan revision and remaining SNAP emergency allotments.
Though SNAP is federally funded, not all states receive equal SNAP funding for families in similar circumstances. Alaska and Hawaii have different rules reflecting the higher cost of living in those states. In addition, because TANF benefits are considered in the income eligibility determination for SNAP, families in states with less generous TANF programs are eligible for more federal SNAP support. In 2019, the SNAP index was $877 in Wyoming, a state with an expansive TANF program, but $1,762 in Mississippi, which offers little TANF support to single parent families. Because of early emergency allotment expirations in some states, the variation was even larger in 2022; the 2023 SNAP benefits are lower and more consistent across states than was the case in 2022.
Key policy implications
Total benefit eligibility for cash and food programs will continue to drop from the 2021 peak but will likely remain above the pre-pandemic level.
Because SNAP emergency allotments expired after February 2023, total annual benefit levels will be lower in 2023 than they were in 2022. However, due to other permanent policy changes such as the Thrifty Food Plan revision, increases in state-wide EITCs, and some TANF expansions, total benefit eligibility will likely remain higher than the pre-pandemic level in 2023 and beyond. Further, social safety net successes during the pandemic may increase the political appetite for a more robust social safety net moving forward.
There is significant variation by state in total safety net generosity, whether it is cash or food support, and which level of government pays for benefits.
In 2019, there was more than a $4,200 difference in the total cash and food index between the most and least generous states.5 In 2022, this difference widened to almost $6,000 given differential phasing out of extra pandemic-era supports.6 These disparities mean that single-parent families in some states receive significantly more government support than those in other states. Further, because residents of states with weak TANF programs are eligible for more federal SNAP benefits, a higher share of overall support in some states comes in the form of federally-funded food assistance.
Benefit increases help low-income families—a lot.
Research consistently demonstrates that a strong social safety net matters to low-income households. For example, cash transfers and food assistance reduce food insecurity, and the 2021 CTC increase helped drive the child poverty rate to a historic low: from 9.7% in 2020 to 5.2% in 2021. Once the CTC increase expired in 2022, the child poverty rate jumped to 12.4%. Research suggests that extending the CTC increase would have kept about three million children out of poverty in 2022.
But not all eligible families actually receive the benefits we describe here.
The generosity index characterizes what single-parent families should be eligible for in benefits, not what they actually receive. Lack of information, complex paperwork, and stigma contribute to families forgoing support for which they are eligible. For example, it is estimated that about one-fifth of those eligible for SNAP and EITC do not participate.
It is estimated that just 21% of families in poverty receive TANF cash assistance. This low percentage is partly because not all poor families qualify for TANF and partly because of barriers to participation. Even without changing program rules, more can be done to reduce administrative burdens so that those in need access programs for which they are eligible.
Conclusion
Our findings highlight trends and differences across states in safety net generosity. We show that safety net generosity has generally been increasing since 2001, with a spike during the pandemic which was driven by temporary SNAP and CTC expansion. The TANF program has eroded substantially, which particularly affects the lowest income single-parent families. Additionally, there are significant safety net generosity disparities by state, meaning that Americans in some states have access to much less government support than comparable families in other states.
The differences across states are presented in detail in our State Safety Net Interactive, available here.
Authors


Please cite any use of the State Safety Net Database. Recommended citation:
Schmidt, Lucie, Lara Shore-Sheppard, and Tara Watson, 2023. State Safety Net Database version 1.1 [dataset]. Brookings Institution, Washington, D.C.
-
Acknowledgements and disclosures
The Brookings Institution is financed through the support of a diverse array of foundations, corporations, governments, individuals, as well as an endowment. A list of donors can be found in our annual reports published online here. The findings, interpretations, and conclusions in this report are solely those of its author(s) and are not influenced by any donation.
-
Footnotes
- The TANF spending value incorporated in this value includes Child Support Enforcement (CSE) program spending. The SNAP spending value includes Nutrition Assistance Program (NAP) block grants and excludes discretionary SNAP spending.
- While lower benefit levels in 2022 compared to 2021 are primarily a result of pandemic-related benefit increases expiring, part of the decline can be attributed to unexpected inflation that eroded the real value of benefits.
- We use annual realized inflation to hold real earnings constant in the fixed group of families, so nominal incomes increased substantially between 2020 to 2022. The federal EITC tax credit thresholds and amounts are routinely adjusted for inflation before the relevant tax year starts. Unexpected inflation therefore causes a temporary drop in the real value of benefits.
- We use NBER’s TAXISM tool to calculate the state EITC generosity index. The tool isn’t yet updated to incorporate 2022 state policy changes, so assumes that 2021 state tax policies remained the same and does not capture recent state expansions. Unexpectedly high inflation between 2020 and 2022 also eroded the real value of benefits.
- In 2019, the index ranged from $4,836 in Mississippi to more than $9,000 in Hawaii.
- In 2022, the total cash and food index was $6,466. State indices ranged from $4,695 in Arkansas to $10,650 in Hawaii.
The Brookings Institution is committed to quality, independence, and impact.
We are supported by a diverse array of funders. In line with our values and policies, each Brookings publication represents the sole views of its author(s).