Today’s employment report showed that the nation’s unemployment rate was essentially unchanged at 7.9 percent in October, and remained below 8 percent for the second month in a row. The reason for the recent improvement is that more Americans were at work and more reported participating in the labor force. The share of working-age Americans who are employed increased to 58.8 percent, the highest level since August 2009. Employers added 171,000 jobs last month and an average of more than 170,000 over the past three months, after revisions to August and September’s estimates boosted estimated job gains. (These figures do not reflect the anticipated update to the payroll data, which will be official in February and is expected to show that the level of employment was 386,000 jobs higher in March 2012 than previously reported.)
Once every four years Americans gather to choose a new president—a natural time for voters to pause and assess the state of the economy. A simple and perhaps naïve approach to this type of assessment is to focus on a single figure like the unemployment rate that provides a current snapshot of the economy and ask whether that number is higher or lower than it was before. This provides a quick and easy answer but fails to tell us much about what lies ahead. Indeed, elections are less about looking back and more about what the future holds—a story that cannot be told with data from a single point in time.
In this month’s employment analysis, The Hamilton Project reviews the available data to explore whether America’s economic future looks brighter today than it did four years ago. Based on a variety of measures, the data clearly indicate a much rosier future for the United States than was the case in 2008. Of course, more work is necessary to fully recover from the Great Recession, but we found that the economy’s prospects have greatly improved and there is reason for optimism. The Project also continues to explore the nation’s “jobs gap,” or the number of jobs that the U.S. economy needs to create in order to return to pre-recession employment levels.
A Brighter Future Today, Compared With That of 2008
It is difficult to recall just how precarious America’s economic situation was in the fall of 2008. The economy had already stumbled into recession in December of 2007, and financial and housing markets had been roiled by falling housing prices, rising defaults on home mortgages, the bankruptcies of a number of large mortgage originators, and the government takeover of Fannie Mae and Freddie Mac. But the failure of Lehman Brothers, one of the country’s most established financial institutions, sparked a panic in financial markets reminiscent of the bank runs of the Great Depression.
Like during the Depression, most victims of the financial collapse were ordinary American workers. In the year following the onset of the financial crisis, more than 6.5 million Americans would lose their jobs. Consumer confidence hit an all-time low, the Dow Jones Industrial Average had plunged more than 20 percent, and a host of near-term indicators for retail sales, business activity, housing starts, or manufacturing were in outright freefall. As the nation went to the polls in November 2008, the outlook was dire.
Since that time, the Bush administration, Obama administration, and the Federal Reserve have taken extraordinary policy measures to combat the crisis. Economists and politicians will be debating the exact contributions of these policy choices to the recovery for years to come. In many respects, however, this debate about past actions misses the broader point. The most important question to address is whether the net result is an economic future that looks brighter today than it did four years ago.
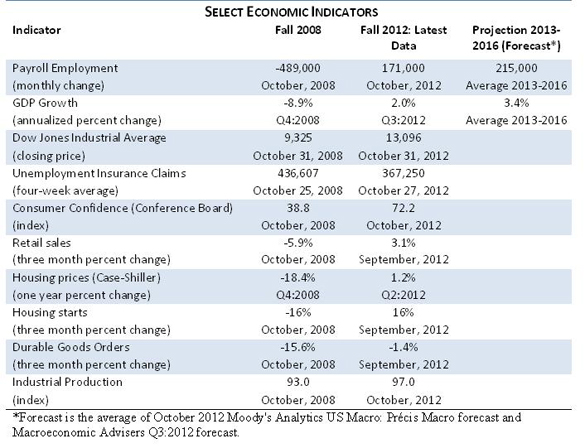
Looking strictly at the incoming data, the answer is clearly yes, the economic outlook today is much more promising. As seen in the table below, since 2008 most economic indicators have vastly improved. Consumer confidence recently reached the highest levels in almost five years, housing activity has improved and home prices have recently trended up. Economic indicators for consumer purchases and manufacturing output are all more favorable.
One summary measure of these positive indicators is the forecast for job growth over the next several years. While the outlook for the labor market beginning in the September 2008 was terrible, two state-of-the-art macroeconomic forecasts now project that the economy will add roughly 215,000 new jobs per month over the next four years. The outlook for aggregate economic output, measured by Gross Domestic Product, is also anticipated to rise. Similarly, the stock market—represented here by the Dow Jones Industrial Average—is 40 percent higher today than it was at the end of October 2008, indicating a much higher level of optimism by investors on the prospects for American businesses.
Of course, threats to a robust economy abound including the ongoing crisis in the eurozone and the impending fiscal contraction legislated to occur at the end of this year. Moreover, while most indicators of economic activity are positive, some recent evidence suggests decelerating business activity. Nevertheless, the overall trajectory is positive. And that positive trajectory is important because of what it portends for the job prospects of American workers and the well-being of American families for years to come.

The October Jobs Gap
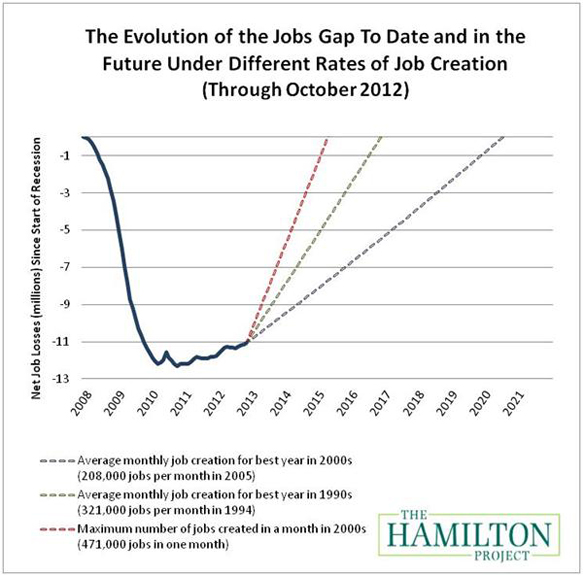
As of October 2012, our nation faces a “jobs gap” of 11.1 million jobs. The chart below shows how the jobs gap has evolved since the start of the Great Recession in December 2007, and how long it will take to close under different assumptions of job growth. The solid line shows the net number of jobs lost since the Great Recession began. The broken lines track how long it will take to close the jobs gap under alternative assumptions about the rate of job creation going forward.

If the economy adds about 208,000 jobs per month, which was the average monthly rate for the best year of job creation in the 2000s, then it will take until July 2020—or eight years—to close the jobs gap. Given a more optimistic rate of 321,000 jobs per month, which was the average monthly rate of the best year of job creation in the 1990s, the economy will reach pre-recession employment levels by November 2016—not for another four years. Again, these figures do not reflect the anticipated update to the payroll data due in February, which may reduce the actual job gap. You can also try out our interactive jobs gap calculator by clicking here.
Conclusion
The United States is on the road to economic recovery, but more work needs to be done—both to overcome the losses from the Great Recession and to address the long-term challenges resulting from a new global economy that have been underway for decades. We are also facing a widening budget deficit driven largely by seemingly inexorable increases in health spending and an aging population and exacerbated by policy choices a decade ago. These are indeed important issues that The Hamilton Project has explored in previous analyses, and that we will continue to address in our future work.
As Americans prepare to go to the voting booths to choose a president, it is natural for them to consider the state of the economy. And there is certainly no shortage of rhetoric about the depth of the recession, the policies enacted to boost the economy, and our economic future. For today, however, if we look forward instead of looking backward and examine the available data across a range of economic indicators the message is clear: the economy is better off than it was four years ago and we are indeed on a path to recovery.
The Brookings Institution is committed to quality, independence, and impact.
We are supported by a diverse array of funders. In line with our values and policies, each Brookings publication represents the sole views of its author(s).


Commentary
How Does Our Economic Future Compare with That of 2008? A Glimpse at America’s Road to Recovery
November 2, 2012