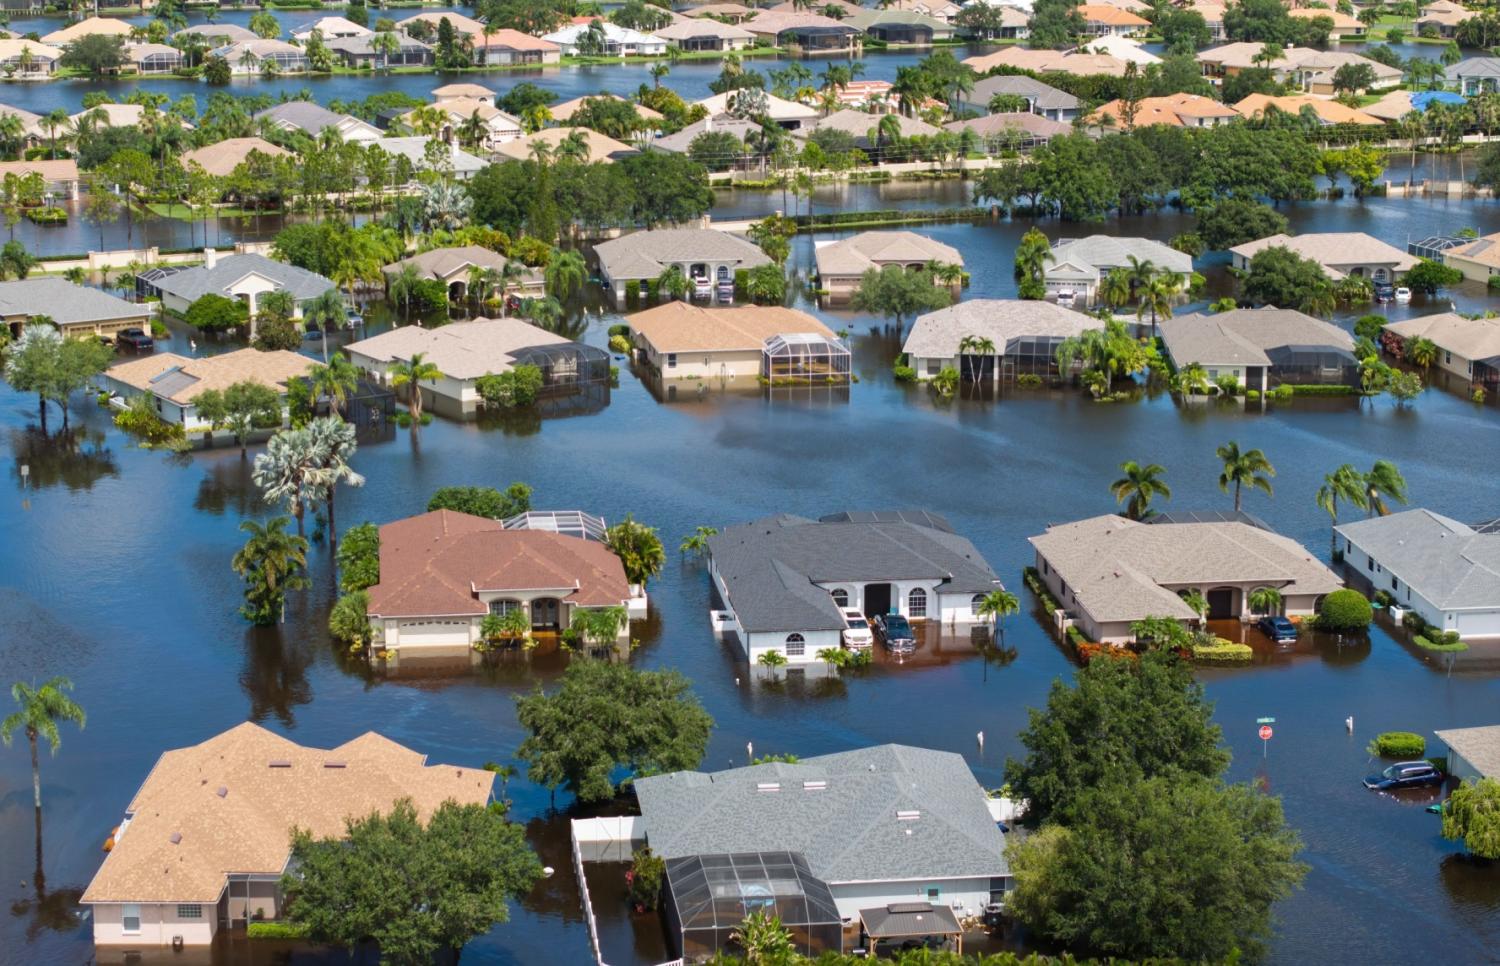
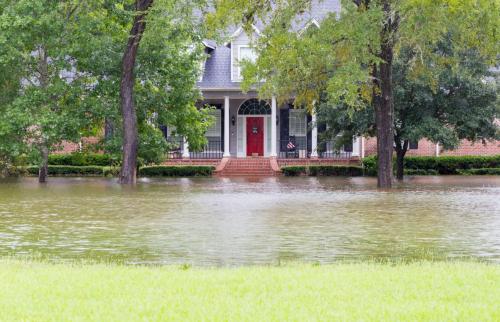
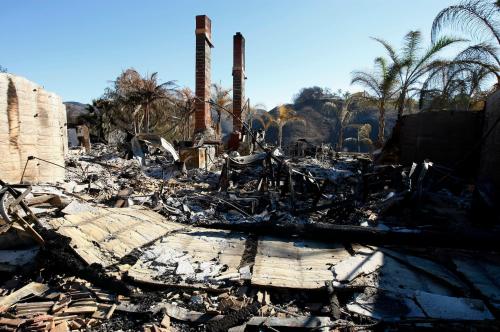
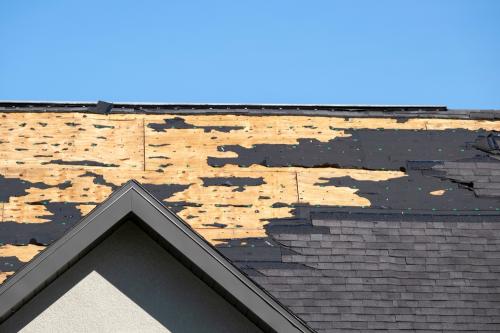
The U.S. Treasury’s Federal Insurance Office has posted ZIP code level data for 2018-2022 showing that homeowners insurance is becoming more costly and harder to procure for millions of Americans as the costs of climate-related events pose growing challenges to insurers and their customers. The snapshot covers more than 330 private insurers and about 50 million homeowner insurance policies for each year. The data were collected through a first-of-its-kind effort by the National Association of Insurance Commissioners, state insurance regulators, and the Federal Insurance Office.
This interactive map, built from a spreadsheet the Treasury posted in January 2025, shows several indicators. Typing in a particular zip code calls up a report card with the fraction of policies that were not renewed, the frequency of claims, the average claim payment, and the average premium for each of the five years. These data are averages; any particular homeowner’s experience may differ from the average. These data allow current and prospective homeowners to compare the cost of insurance and the frequency of claims and non-renewals in their neighborhoods to adjacent neighborhoods and to the rest of the country.
The data were accompanied by a 66-page report, Analyses of U.S. Homeowners Insurance Markets, 2018-2022: Climate-Related Risks and Other Factors.
Among the report’s key findings:
- Homeowners insurance costs are rising fast across the nation, although with significant variation by region and ZIP code. Average premiums increased 8.7% faster than the rate of inflation in 2018-2022.
- Homeowners in communities affected by substantial weather events are paying far more than those elsewhere. From 2018 to 2022, consumers living in the 20% of ZIP codes with the highest expected annual losses to buildings from climate-related perils paid $2,321 in premiums on average, 82% more than those in the 20% lowest climate-risk ZIP codes.
- Homeowners in areas with the highest expected losses from climate-related perils face higher policy nonrenewal rates from private insurers. Consumers in the highest risk ZIP codes faced average nonrenewal rates about 80 percent higher than those in the lowest risk ZIP codes.
- Climate change is making it more costly for insurers to operate. The paid loss ratio—how much insurers paid for claims relative to premiums received—was highest in the highest risk ZIP codes. These areas had a higher average claim—$24,000 on average, compared to an average of about $19,000 for lowest risk areas.
|
ZIP code |
City |
County |
Premiums |
|
|---|---|---|---|---|
| 1 |
33480 |
Palm Beach, FL | Palm Beach | $40,719 |
| 2 | 33140 | Miami Beach, FL | Miami-Dade | $34,055 |
| 3 | 31561 | Sea Island, GA | Glynn | $25,848 |
| 4 | 33316 | Fort Lauderdale, FL | Broward | $24,366 |
| 5 | 34102 | Naples, FL | Collier | $23,927 |
| 6 | 33141 | Miami Beach, FL |
Miami-Dade |
$23,306 |
| 7 | 33462 | Lake Worth, FL |
Palm Beach |
$23,271 |
| 8 | 11962 | Sagaponack, NY | Suffolk | $22,974 |
| 9 | 33408 |
North Palm Beach, FL |
Palm Beach |
$22,223 |
| 10 |
33455 |
Hobe Sound, FL |
Martin | $22,109 |
|
mean |
$1,776 | |||
|
median |
$1,551 | |||
|
ZIP code |
City |
County |
Premium increase |
|
|---|---|---|---|---|
| 1 | 95454 | Laytonville, CA | Mendocino | 105.69% |
| 2 | 89109 | Las Vegas, NV | Clark | 96.79% |
| 3 | 91759 | Mt Baldy, CA | San Bernardino | 90.64% |
| 4 | 95225 | Burson, CA | Calaveras | 89.06% |
| 5 | 96065 | Montgomery Creek, CA | Shasta | 83.39% |
| 6 | 92060 | Palomar Mountain, CA | San Diego | 81.37% |
| 7 | 95466 | Philo, CA | Mendocino |
77.92% |
| 8 | 96016 | Cassel, CA |
Shasta |
77.54% |
| 9 | 96096 |
Whitmore, CA |
Shasta |
76.15% |
| 10 |
78701 |
Austin, TX | Travis | 76.13% |
|
mean |
6.93% | |||
|
median |
5.67% | |||
|
ZIP code |
City |
County |
Nonrenewal rate |
|
|---|---|---|---|---|
| 1 | 29926 | Hilton Head Island, SC | Beaufort | 43.85% |
| 2 | 29566 | Little River, SC | Horry | 28.13% |
| 3 | 29910 | Bluffton, SC | Beaufort | 27.91% |
| 4 | 29466 | Mount Pleasant, SC | Charleston | 27.81% |
| 5 | 29486 | Summerville, SC | Berkeley | 25.48% |
| 6 | 29568 | Longs, SC | Horry | 21.59% |
| 7 | 29579 | Myrtle Beach, SC |
Horry |
21.55% |
| 8 |
29492 |
Charleston, SC |
Berkeley |
21.25% |
| 9 | 91917 | Dulzura, CA |
San Diego |
21.05% |
| 10 | 29906 | Beaufort, SC | Beaufort | 19.24% |
|
mean |
0.01% | |||
|
median |
0.01% | |||
The Brookings Institution is committed to quality, independence, and impact.
We are supported by a diverse array of funders. In line with our values and policies, each Brookings publication represents the sole views of its author(s).


