The total number of local governments studied in this analysis has changed from 331 (92 cities/consolidated city-counties and 239 counties with populations over 250,000) in the December 2022 data to 332 (92 cities/consolidated city-counties and 240 counties with populations over 250,000) in the March 2023 data.
Last month, the Treasury Department released its quarterly update on how the $350 billion of American Rescue Plan Act (ARPA) funding distributed to state, local, territorial, and tribal governments is being spent. This data, which our Local Government ARPA Investment Tracker has monitored over the past 18 months, provides new insights into the strategic priorities of large cities and counties with populations over 250,000.
This post provides an update on the commitments and expenditures of these large local governments and assesses how other federal legislation may impact how recipients use their State and Local Fiscal Recovery Funds (SLFRF) allocations moving forward.
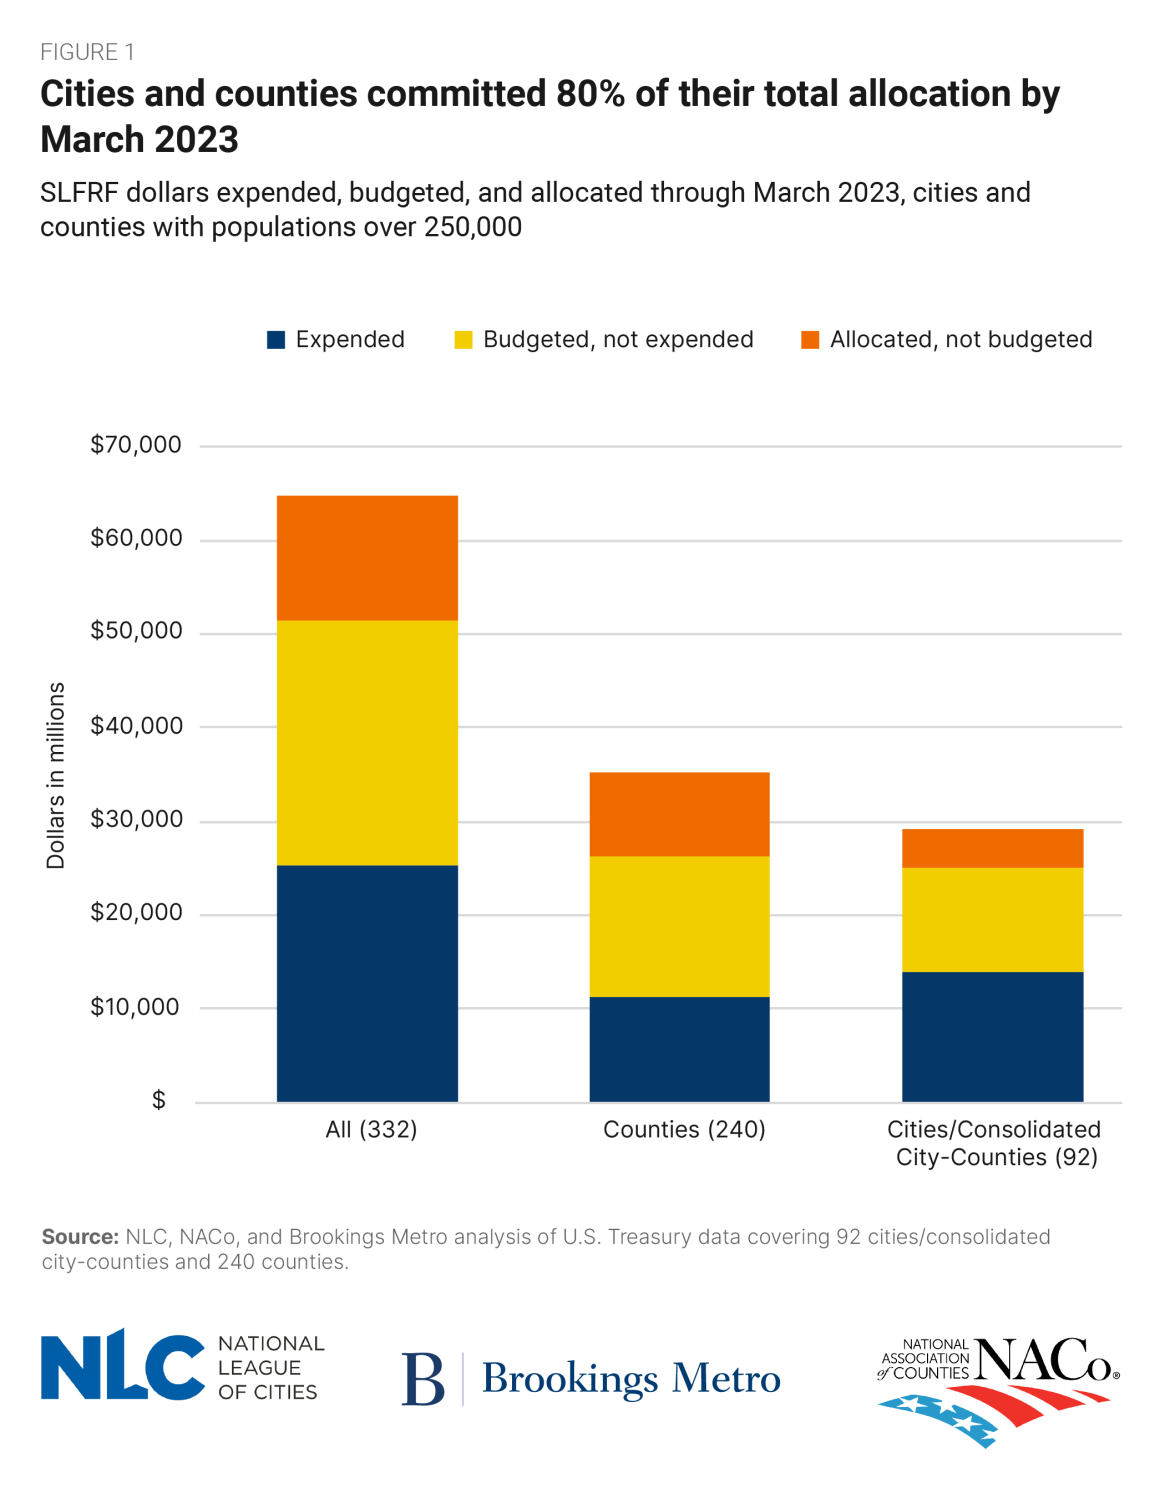
Large cities and counties committed four-fifths of their SLFRF dollars as of March 2023
By the end of March 2023, large cities and counties had committed SLFRF dollars to 11,771 projects—up from 10,522 projects at the end of December 2022 (a 12% increase). Of these projects, 8,017 (68%) were led by counties, which received 55% of the $65 billion allocated to large local governments. And while county commitments and ARPA expenditures continue to lag behind cities, they have started catching up; as of the end of March, counties had committed 74% of their SLFRF dollars, up from 68% at the end of 2022. Cities posted an increase of only 84% to 86% over the same period.
In total, large cities and counties committed $51 billion (80%) of their SLFRF dollars by the end of March and had spent $25 billion (39%) of those appropriations. An additional $8.6 billion of appropriations had been obligated to specific projects and contracts, but had not yet been spent.
As appropriations continue to grow, city and county priorities remain the same
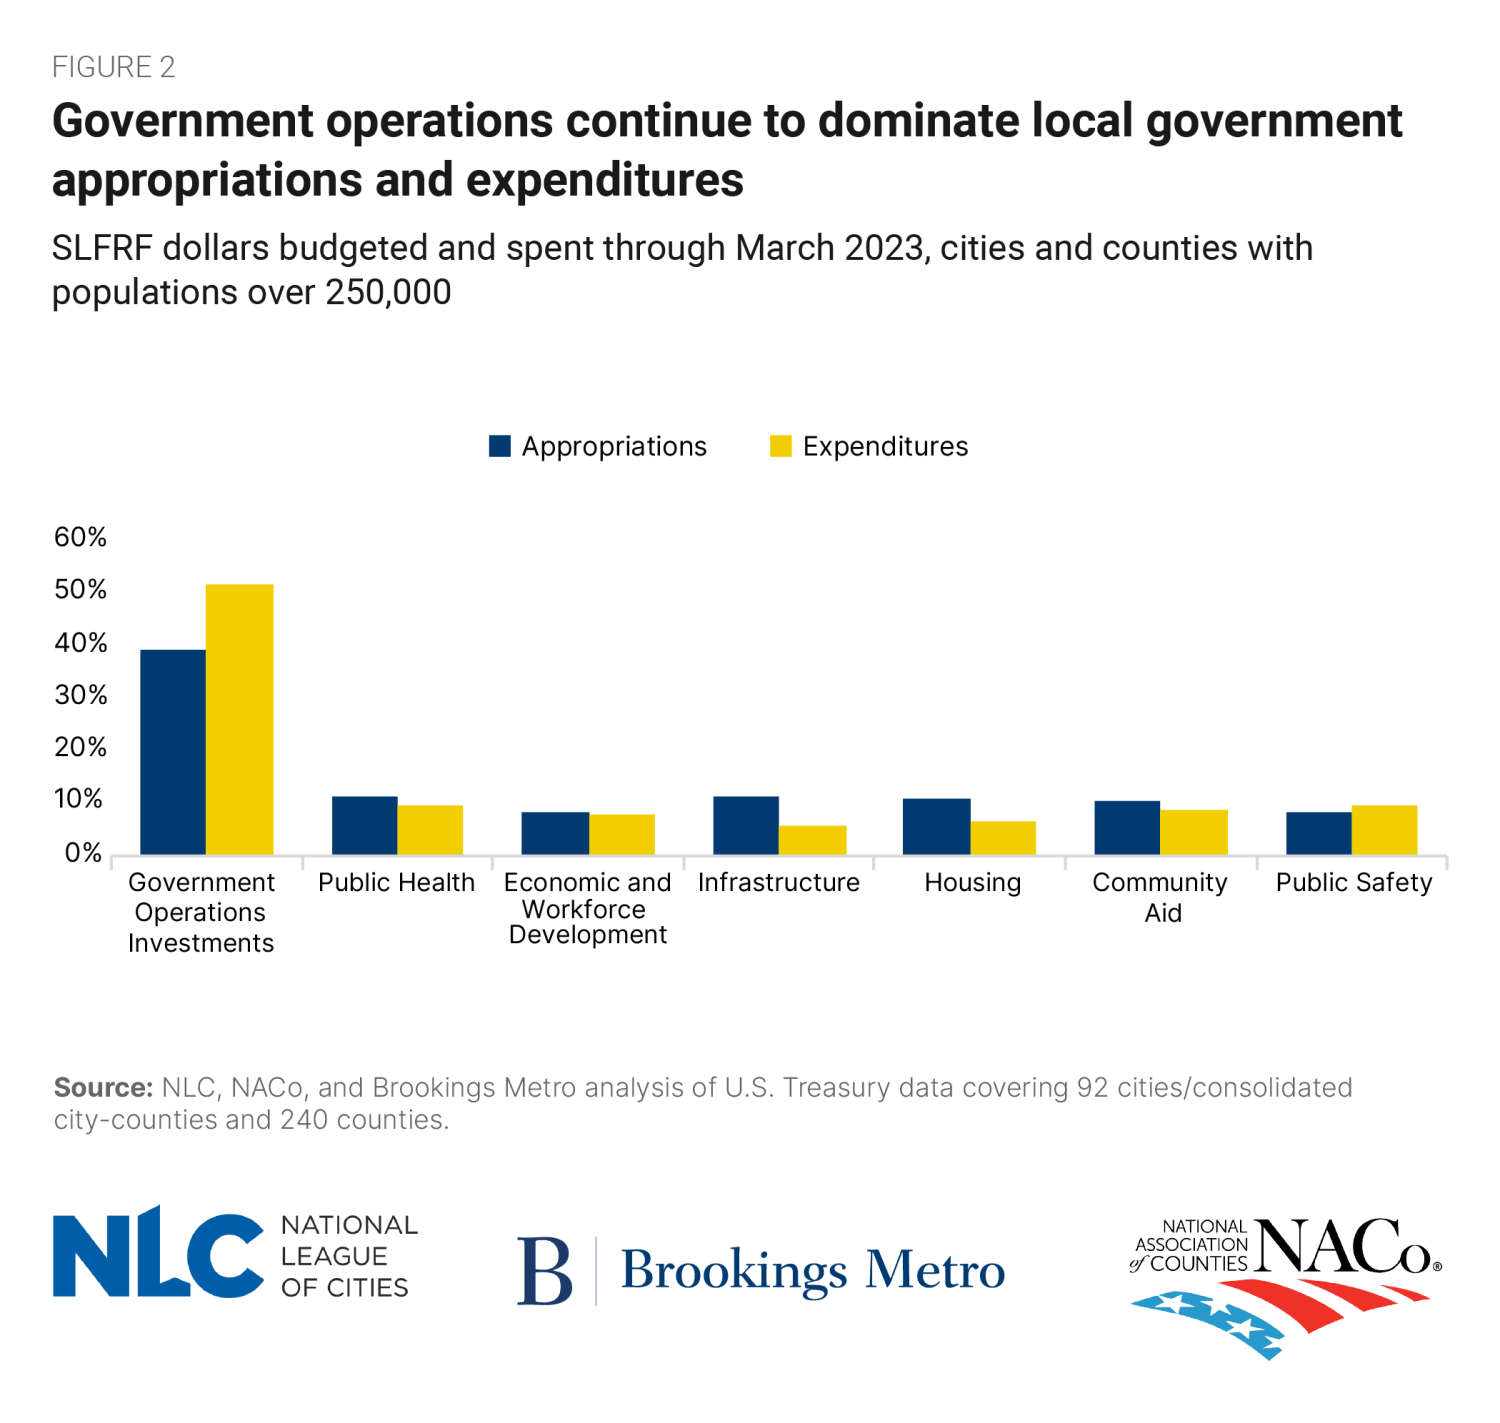
Despite counties ramping up appropriations, neither large cities nor large counties reported any significant shift in priorities between December 2022 and March 2023. No investment category’s share of ARPA commitments changed by more than 2 percentage points during this time.
Consistent with prior reporting periods, cities and counties are spending funds on internal government operations at a much faster rate than other investment categories. Over half of all SLFRF dollars that large cities and counties have spent to date have funded public sector employee wages and hiring efforts; investments in government facilities and equipment; fiscal health recovery; and other administrative expenses (Figure 2). None of the other six major investment categories we track accounted for more than 10% of total expenditures.
New federal guidelines have not shifted infrastructure appropriations—yet
As the COVID-19 public health crisis wanes, some federal officials have demanded greater flexibility for cities and counties to use their SLFRF dollars for infrastructure. Under new program guidelines implemented at the end of 2022, up to $10 million or 30% of each recipient’s SLFRF allocation—whichever is greater—can be committed to a variety of infrastructure projects, as long as that project is eligible for funding under a different federal infrastructure program. Recipients have until the end of 2024 to finalize their obligations.
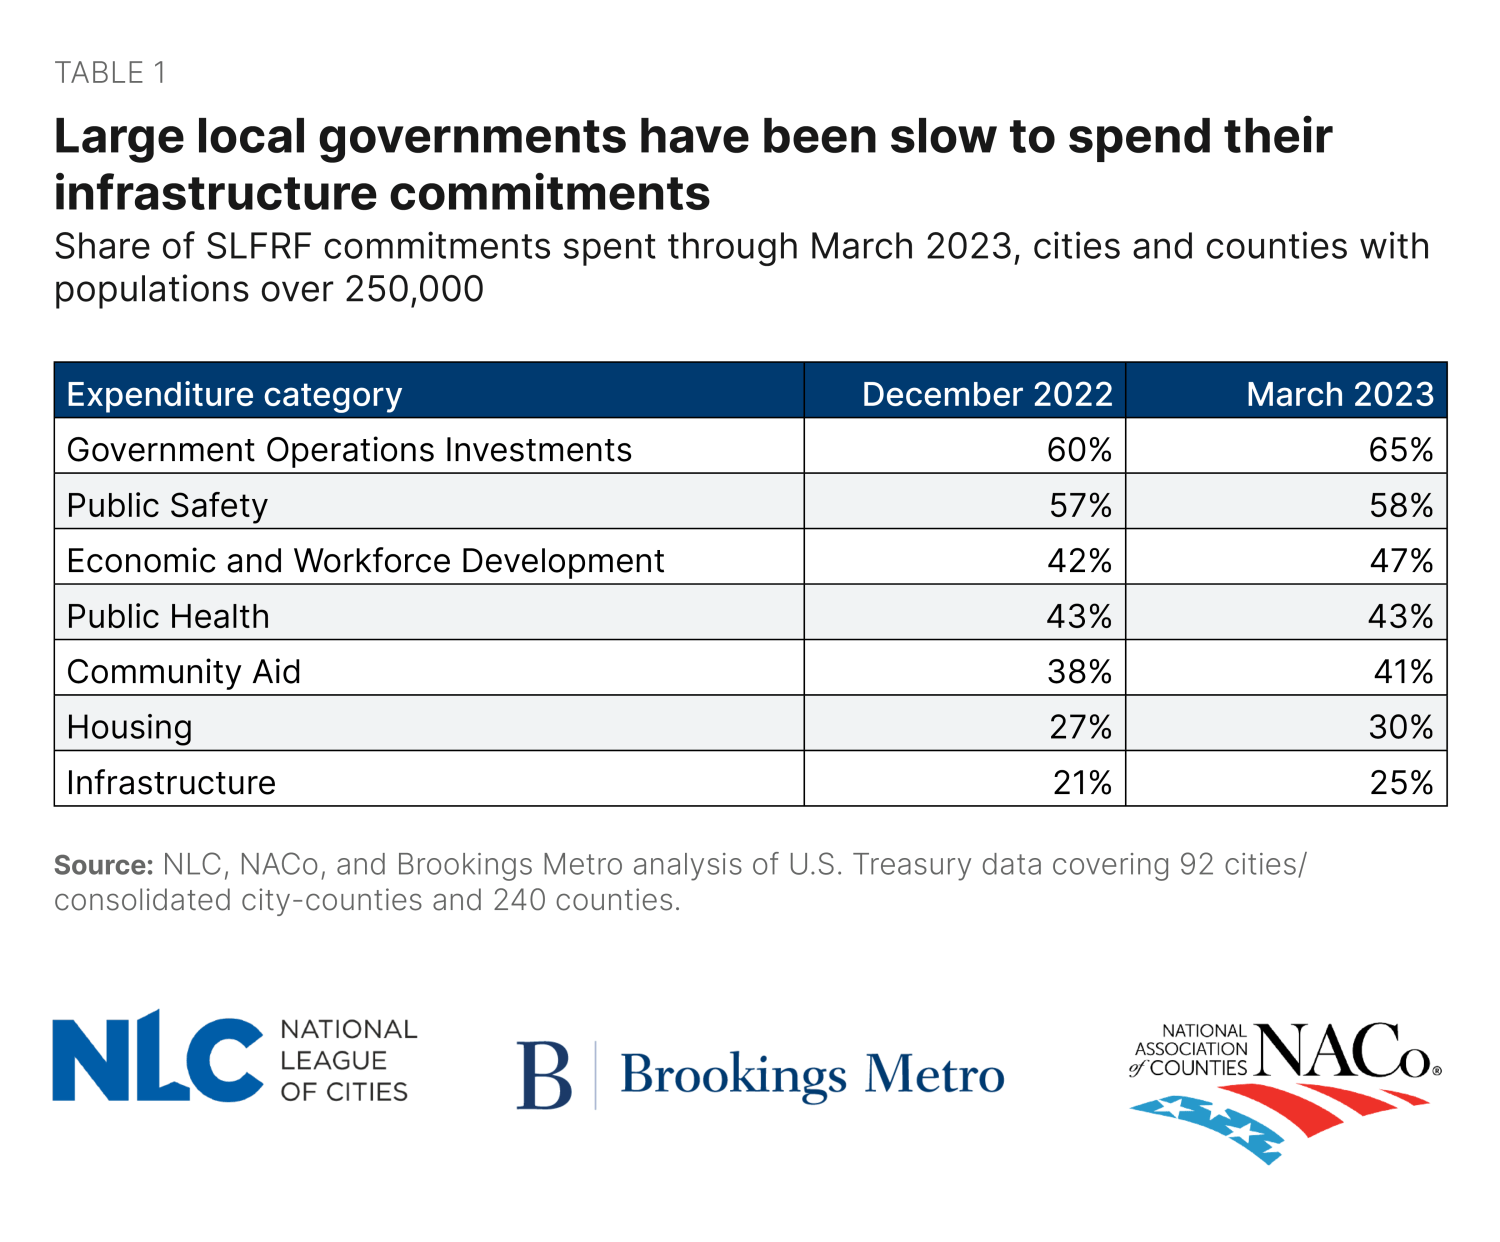
Though infrastructure projects are expected to lag somewhat given their complexities around planning and procurement, this expanded flexibility has not yet translated into a shift in strategic commitment priorities for large cities and counties. While infrastructure has remained a top-three priority for both cities and counties since the SLFRF program began, the total share of commitments to these projects remains virtually unchanged. Additionally, large cities and counties are spending their infrastructure commitments at a slower rate than any other major investment category; of the $5.9 billion in SLFRF dollars appropriated toward infrastructure investments to date, less than $1.5 billion (25%) has been spent (Figure 3).
While it remains to be seen whether this change in guidelines will significantly impact the amount of SLFRF dollars committed to infrastructure by the end of 2024, there is bipartisan agreement that action is needed to assist local governments in navigating these new guidelines. In a June letter, seven senators urged Treasury Secretary Janet Yellen and Office of Management and Budget Director Shalanda Young to prioritize the release of a new Interim Final Rule to break the “holding pattern” that SLFRF recipients have been in since the guidelines were updated. The senators wrote that the lack of clarity has created “uncertainty and challenges in accessing and utilizing the SLFRF effectively”.1
While little has changed in city and county investment behavior since the end of last year, decisions about the deployment of SLFRF dollars are far from over. As cities and counties continue to navigate the program and decide how to utilize the last fifth of their allocations, future reporting data will reveal how additional guidance from Treasury—and the continued deployment of funding under the Infrastructure Investment and Jobs Act and Inflation Reduction Act—influence local decisionmaking moving forward.
-
Acknowledgements and disclosures
The authors thank Ricardo Aguilar, Christine Baker-Smith, Alan Berube, and Teryn Zmuda for research advice and support.
-
Footnotes
- On August 10, 2023, the Treasury released its Interim Final Rule on ARPA Flex, including three new expenditure categories for recipients to use. To learn more about these expenditure categories, review NLC’s blog on new Treasury guidance on ARPA SLFRF eligible uses.
The Brookings Institution is committed to quality, independence, and impact.
We are supported by a diverse array of funders. In line with our values and policies, each Brookings publication represents the sole views of its author(s).


