I. Introduction
Researchers were already expecting a gradual enrollment slowdown before the onset of COVID-19. Public school enrollment edged up only 2% between 2012 and 2019, holding near 50 million students, while the U.S. total fertility rate had slipped to 1.71 births per woman—well below the replacement level—foreshadowing a smaller school-age cohort. The pandemic turned that slow decline into a sudden shock. Studies document steep post-2020 losses in Massachusetts, Virginia, Michigan, and California. Research at the national level shows similar trends in urban and high-poverty districts, and a surge in both homeschooling and private-schooling that still leaves millions of children “missing” from any formal roll.
In addition to concerns around student progress, shrinking headcounts also create immediate fiscal stress because most state and federal aid flows on a per-pupil basis. District leaders have already considered adjusting school capacity, redistricting, or even closing campuses to balance budgets— steps that are often politically sensitive but considered in response to fiscal pressures. Recent evidence confirms that steeper enrollment losses measurably raise the odds of permanent closure.
Enrollment shifts have not fallen evenly across student groups. Recent evidence shows that kindergarten enrollment fell most sharply for black and low-income children, whereas the smaller declines observed in later grades were concentrated among white and higher-income students already enrolled in public schools. Such patterns may heighten long-standing worries about potential re-segregation and resource inequality. Against this backdrop, policymakers and district officials are experimenting with strategies to stem further enrollment losses or mitigate their effects. Some, like New York City, have pledged to preserve school budgets even as rolls shrink. Others hope new curricula or enhanced parent outreach will attract students back.
This report provides detailed estimates of recent shifts in public school enrollment. By linking the latest National Center for Education Statistics data with federal population estimates, the report shows how enrollment shifts differ across districts with distinct racial and economic profiles. In addition, it projects how continued enrollment declines could drive future school closures and alter the number of seats traditional districts will need through 2050.
II. School enrollment trends
Our analysis draws on four complementary federal datasets. The Common Core of Data (CCD) from NCES provides annual, school-level counts of public-school students for every year, along with information on each school’s location and type. To gauge the size and socioeconomic makeup of the prospective student pool, we obtain district-level counts of school-age children and those in poverty from the Census Bureau’s Small Area Income and Poverty Estimates (SAIPE). We also obtain forecasts of the school-age population through 2100 from the Census Bureau’s Population Division. Because the CCD covers only public schools, we use the biannual Private School Universe Survey (PSS) to add national and state counts of private-school students for odd-numbered years from 2011 to 2021. We estimate private school enrollment for even-numbered years, including 2022-23 and 2023-24, with a linear trend fitted to private school enrollment through 2021-22. Merging CCD and PSS enrollment figures with SAIPE/Census population baselines allows us to track shifts in public- and private-sector enrollment relative to the underlying school-age population. By contrasting reported public and private school enrollments with Census estimates of total school-age population, we gauge how many school-age children may not be attending public or private schools.
To investigate the share of students outside traditional public schools by race/ethnicity, we identify districts where one racial or ethnic group accounts for at least 90% of 2016-17 enrollment. We use these racially homogeneous districts to approximate group-specific patterns. Within each such district, we calculate the share of students who enroll in private, charter, alternative, or virtual public schools and treat the residual as the share who are absent from all federal enrollment files. This allows us to overcome a data limitation: The Small Area Income and Poverty Estimates do not report district-level school-age population by race.
Moreover, to analyze enrollment by socioeconomic status, we first compute each district’s average student-poverty rate for 2016–19, which smooths out year-to-year fluctuations. We then divide the resulting distribution into thirds: Districts with poverty rates below 11.47% are classified as low-poverty, those with rates between 11.47 and 19.22% as medium-poverty, and those above 19.22% as high-poverty.
Shifts away from traditional public education
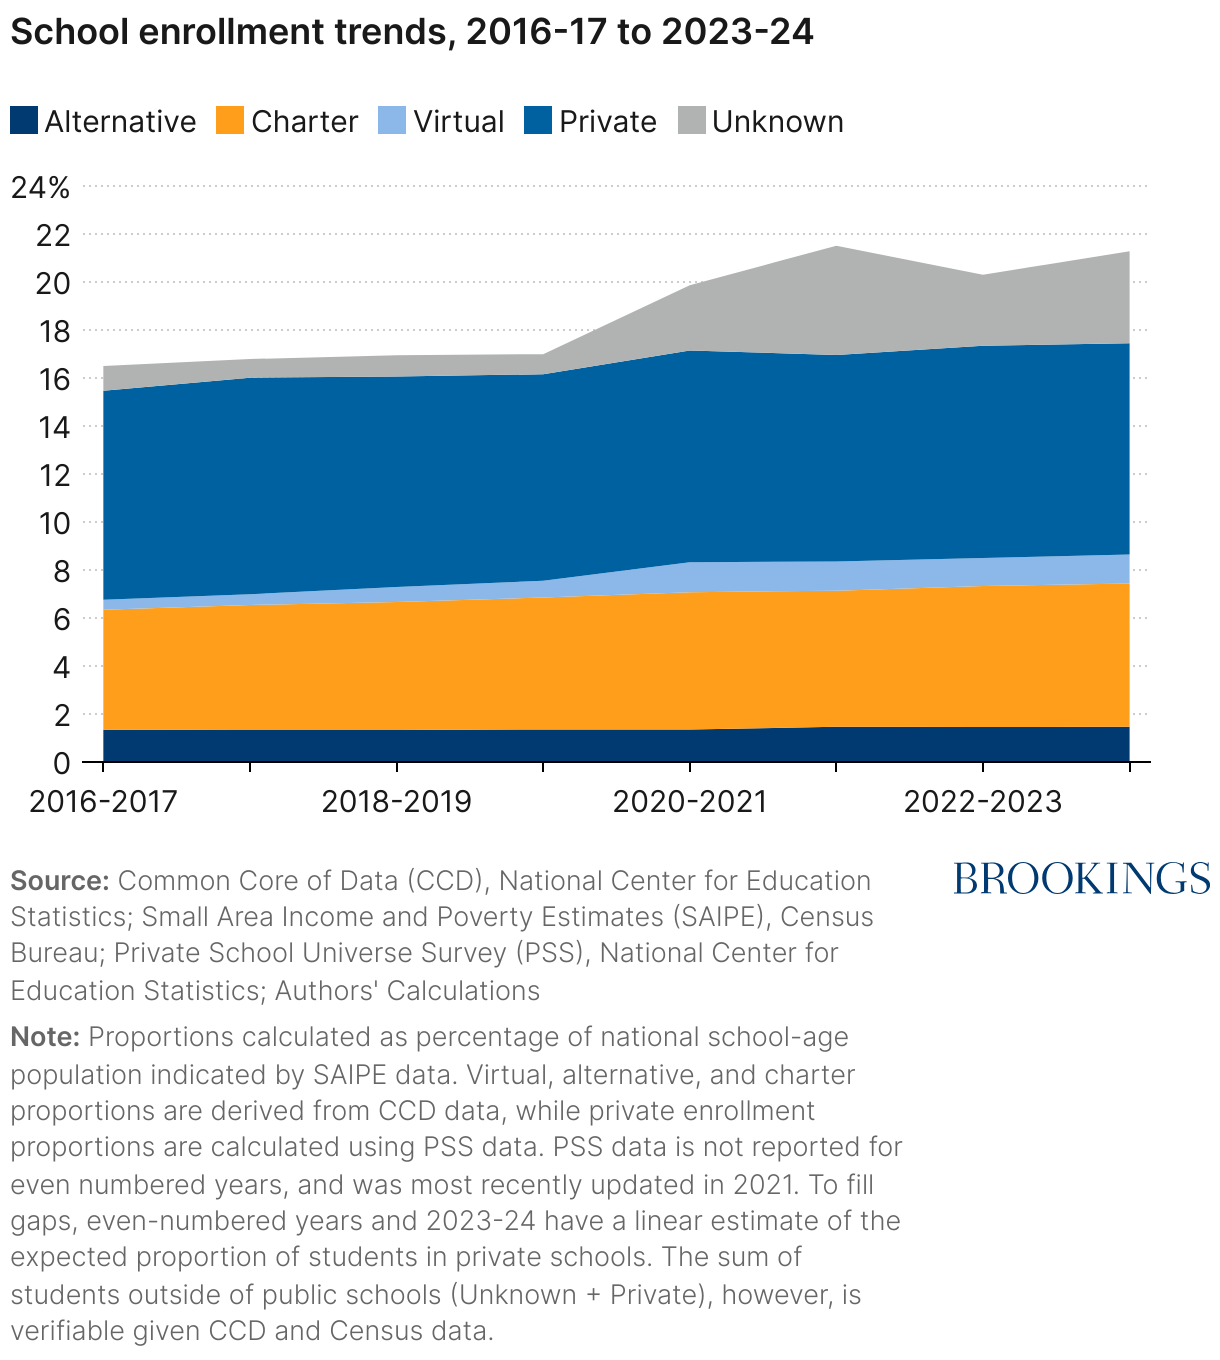
Figure 1 shows how the mix of schooling options has shifted since 2016. Before the pandemic, the share of students in traditional public schools (TPS) held steady, hovering near 85% from 2016-17 through 2019-20. The pandemic marks a clear turning point: The TPS share fell as families moved toward alternative options. Charter schools expanded every year, rising from 5.0% of enrollment in 2016-17 to 6.0% in 2023-24. Alternative public schools (such as special-education schools) inched up from 1.3% to 1.5% over the same period. Virtual schools were a rarity pre-COVID (0.7% in 2019-20) but nearly doubled to 1.2% in 2020-21 and have remained elevated since. Private school enrollment has held steady around 8.8% between 2016-17 and 2023-24.
The most striking change is outside the public-school sector. Combining private school enrollment with students who cannot be matched to any school in the CCD, the share of children outside public schools averaged 9.7% before COVID-19, jumped to 11.5% in 2020-21, peaked at 13.1% in 2021-22, and has stayed well above pre-pandemic levels (11.8% in 2022-23 and 12.6% in 2023-24). Given that private school enrollment has remained relatively stable, the post-pandemic growth in the “outside public schools” group may come chiefly from students missing in federal datasets rather than a spike in private-school rolls.
These trend-based estimates are probably conservative. Since 2021-22, some states have expanded voucher programs that should push private enrollment higher. Even with that caveat, the combined share of students in private schools or unaccounted for stands at 12.6% in 2023-24, a figure derived directly from SAIPE population counts and CCD public-school files.
Enrollment shifts by geography
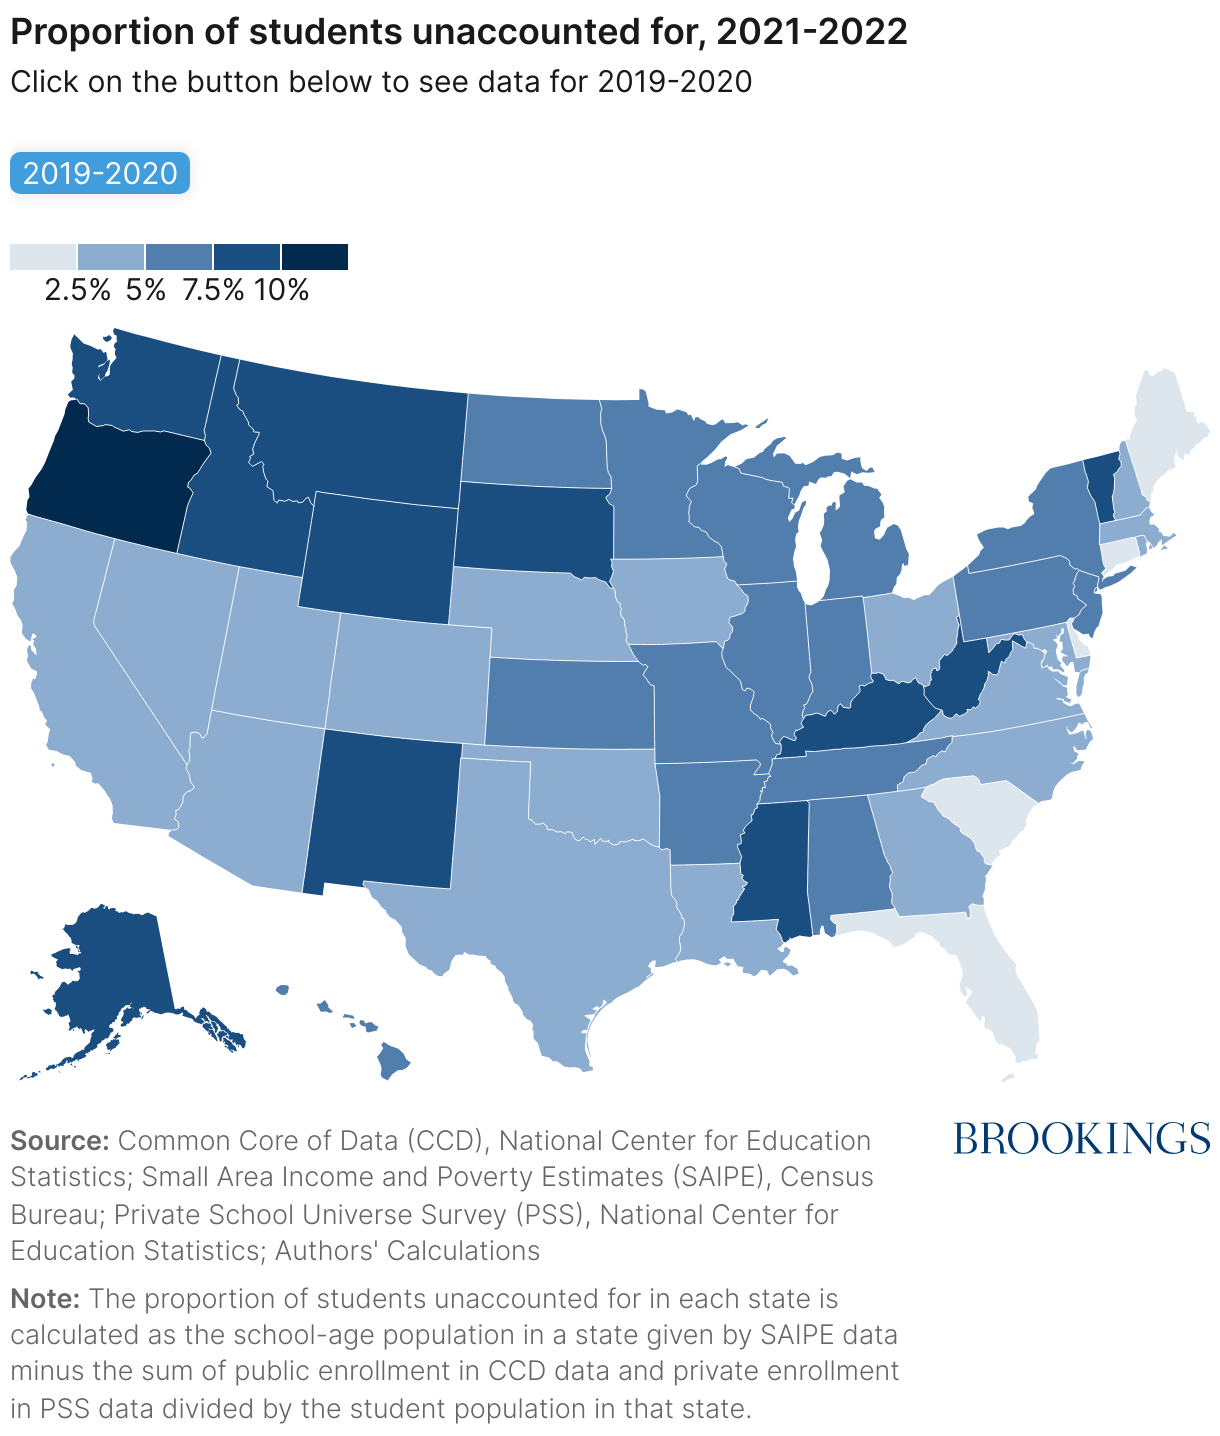
The interactive map (Figure 2) below displays, for each state, the share and number of school-age children who do not appear in either public or private school enrollment records. In 2021-22, for example, these unknown or “missing” shares ranged from zero in Florida, Delaware, and the District of Columbia—meaning the estimated number of 5- to 17-year-olds does not exceed total reported enrollment—to about 12% in Oregon, the widest gap nationwide. Most states clustered well below that extreme: The median state, Wisconsin, had 5.5% of students unaccounted for.
The bulk of the Southeast and mid-Atlantic, states such as Georgia, North Carolina, Alabama, Maryland, and Pennsylvania, sit in the 2.5–7.5% range. The industrial Midwest and central Plains (e.g., Illinois, Indiana, Iowa, Nebraska) also sit in this range. The largest gaps (higher than 7.5%) concentrate in the far West and northern tier—Oregon, Washington, Idaho, Montana, North Dakota, Alaska—plus two Appalachian states, Kentucky and West Virginia.
School enrollment shifts by race/ethnicity
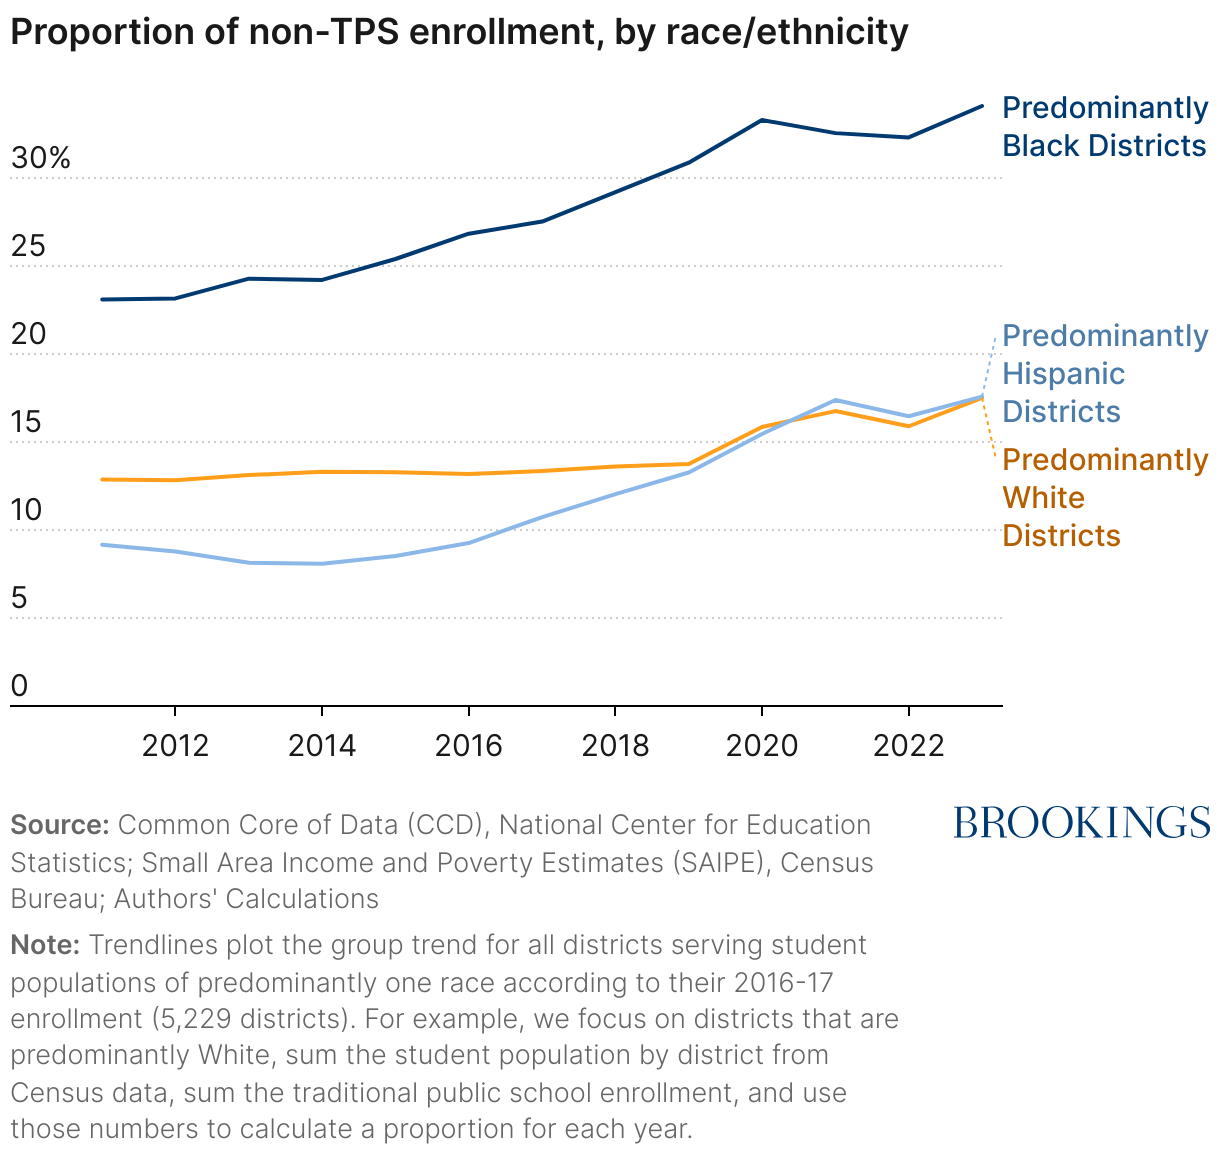
Figure 3 shows how the share of students outside traditional public schools has changed in districts composed predominately of a single racial or ethnic group. In districts that serve mostly black students, non-TPS enrollment has been both the highest and the fastest growing. The share rose from 25.4% in 2015-16 to 34.1% in 2023-24, and the pandemic did not alter that trajectory. Predominantly Hispanic districts started with the lowest non-TPS share, reaching 12.0% in 2018-19 before the pandemic. After 2020 the proportion climbed noticeably, peaking at 17.4% in 2021-22 and standing at 17.6% in 2023-24. Predominantly white districts were remarkably stable prior to the pandemic, fluctuating between 12.8 and 13.7%, but their non-TPS share moved upward after 2020 and reached 17.5% in 2023-24.
Overall, these trends indicate that students in districts serving mainly black populations continue to leave traditional public schools at a faster rate than their peers in white or Hispanic districts. The post-pandemic increases among white and Hispanic districts are noticeable but more modest.
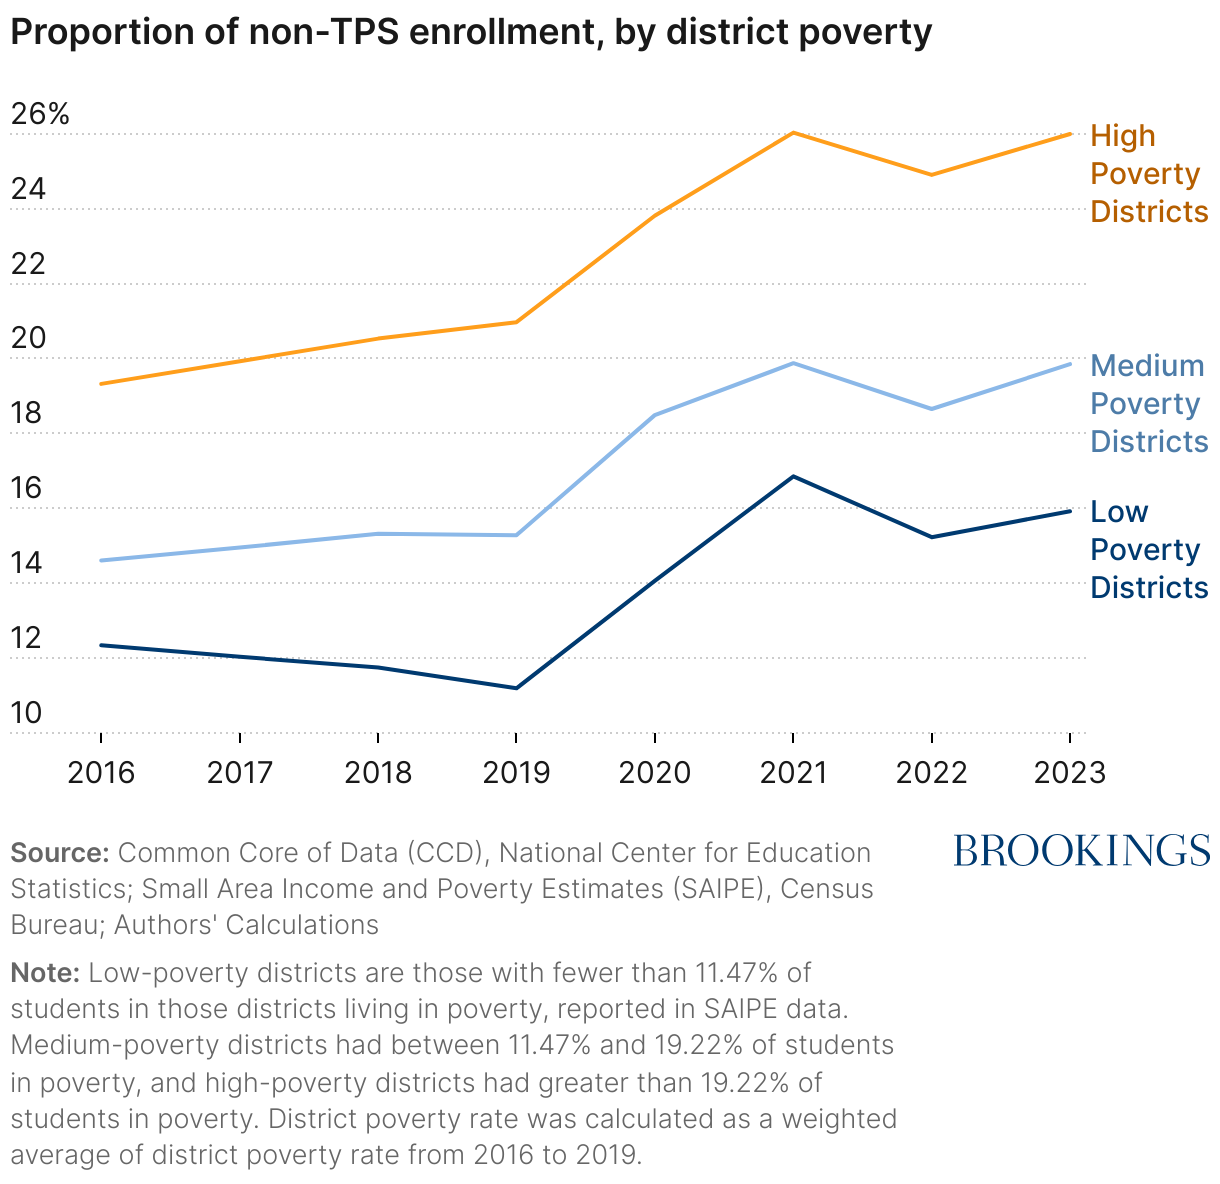
School enrollment shifts by district poverty level
Figure 4 shows how the share of students learning outside traditional public schools varies with the poverty level of their school district. Across every year in the series, high-poverty districts record the largest share of students outside the traditional public-school sector, followed by medium- and then low-poverty districts. Before the pandemic the share in high-poverty districts rose gradually from 19.3% in 2016-17 to 21.0% in 2019-20; after 2020 it accelerated, reaching 26.0% in 2023-24. Medium-poverty districts show a similar pattern, increasing from 14.6% to 15.3% before the pandemic and then to 19.9% by 2023-24. Low-poverty districts moved in the opposite direction at first: Their non-TPS share slipped from 12.3% in 2016-17 to 11.2% in 2019-20, but the pandemic reversed that decline, pushing the figure up to 15.9% in 2023-24 after a peak of 16.9% in 2021-22.
The post-2020 increase in non-TPS enrollment suggests that families across socioeconomic levels began exploring non-traditional options such as private, charter, or virtual schools. Because private-school counts for recent even-numbered years are extrapolated from earlier data, our estimates likely understate how much private enrollment has grown, especially in communities that can afford tuition. High-poverty districts may have lower access to private schools and fewer resources for homeschooling, yet they still experienced the largest absolute increase in students leaving traditional public schools.
III. Projecting seat demand in traditional public schools to 2050
The interactive below (Figure 5) opens with two factual baselines. A black line plots the Census Bureau’s population projection of the school-age population (ages 5–17). The population projections assume a linear convergence of age-specific fertility toward a common total fertility rate of 1.52—the level observed for native-born, white women in 2020—by the year 2123, not by mid-century. During that long period, fertility shifts to older maternal ages (rates fall below age 30 and rise above age 30). The composition of net immigration is held constant at the 2015-19 average, but annual levels change. We use the main (“main”) series scenario (total net immigration rises from about 1.57 million immigrants in 2023 to roughly 2.06 million in 2100). Together, these forces push the school-age population lower almost every year—most sharply between 2025 and 2035—before it stabilizes in the 2040s. A gray line overlays actual enrollment in traditional public schools (TPS) through 2023, revealing a stable pre-COVID plateau, a two-million-student drop in 2020-21, and a slower decline thereafter.
Against this backdrop, the interactive introduces four enrollment scenarios, shown as colored bands whose upper and lower edges bracket optimistic and pessimistic variants of the same logic. The blue scenarios assume the pandemic shock is temporary. In the “hold-steady” version, the TPS share of students is frozen at its 2011-12 to 2019-20 average and applied to the Census population projections, producing the shallowest future decline. In the “pre-trend” variant, a simple linear fit to the gradual pre-COVID erosion in TPS share is extended forward, yielding a somewhat steeper loss.
The orange scenarios assume a permanent shift in family preferences away from TPS. The “post-freeze” path locks the TPS share at its lower 2020-21 to 2023-24 average, while the “post-trend” path projects that recent slide forward with another linear fit. Because both orange cases begin with a smaller market share—and, in the trend case, keep shrinking—they trace the largest seat shortfalls by 2050. Within each band, the top edge marks the most optimistic outcome for that scenario and the bottom edge the most pessimistic, conveying how sensitive future TPS capacity needs are to demographic headwinds and to whether the pandemic enrollment shock proves fleeting or enduring.
The blue and orange lines translate these population trends into projected TPS enrollment. The blue paths assume the pandemic’s impact is temporary. The solid blue line holds the TPS share at its pre-pandemic average from 2011-12 to 2019-20, yielding the most conservative estimate of future losses. The dashed blue line extends the slight pre-pandemic decline in the TPS share, calculated with a simple linear fit, and applies that declining share to the Census population projections.
The orange paths reflect the possibility that the pandemic permanently shifted family preferences. The solid orange line fixes the TPS share at the post-pandemic average from 2020-21 to 2023-24. The dashed orange line projects a continued post-pandemic slide in the TPS share, again using a linear fit to the most recent data and applying that trend to the projected school-age population. This last series is the least optimistic, showing the steepest decline in enrollment by 2050.
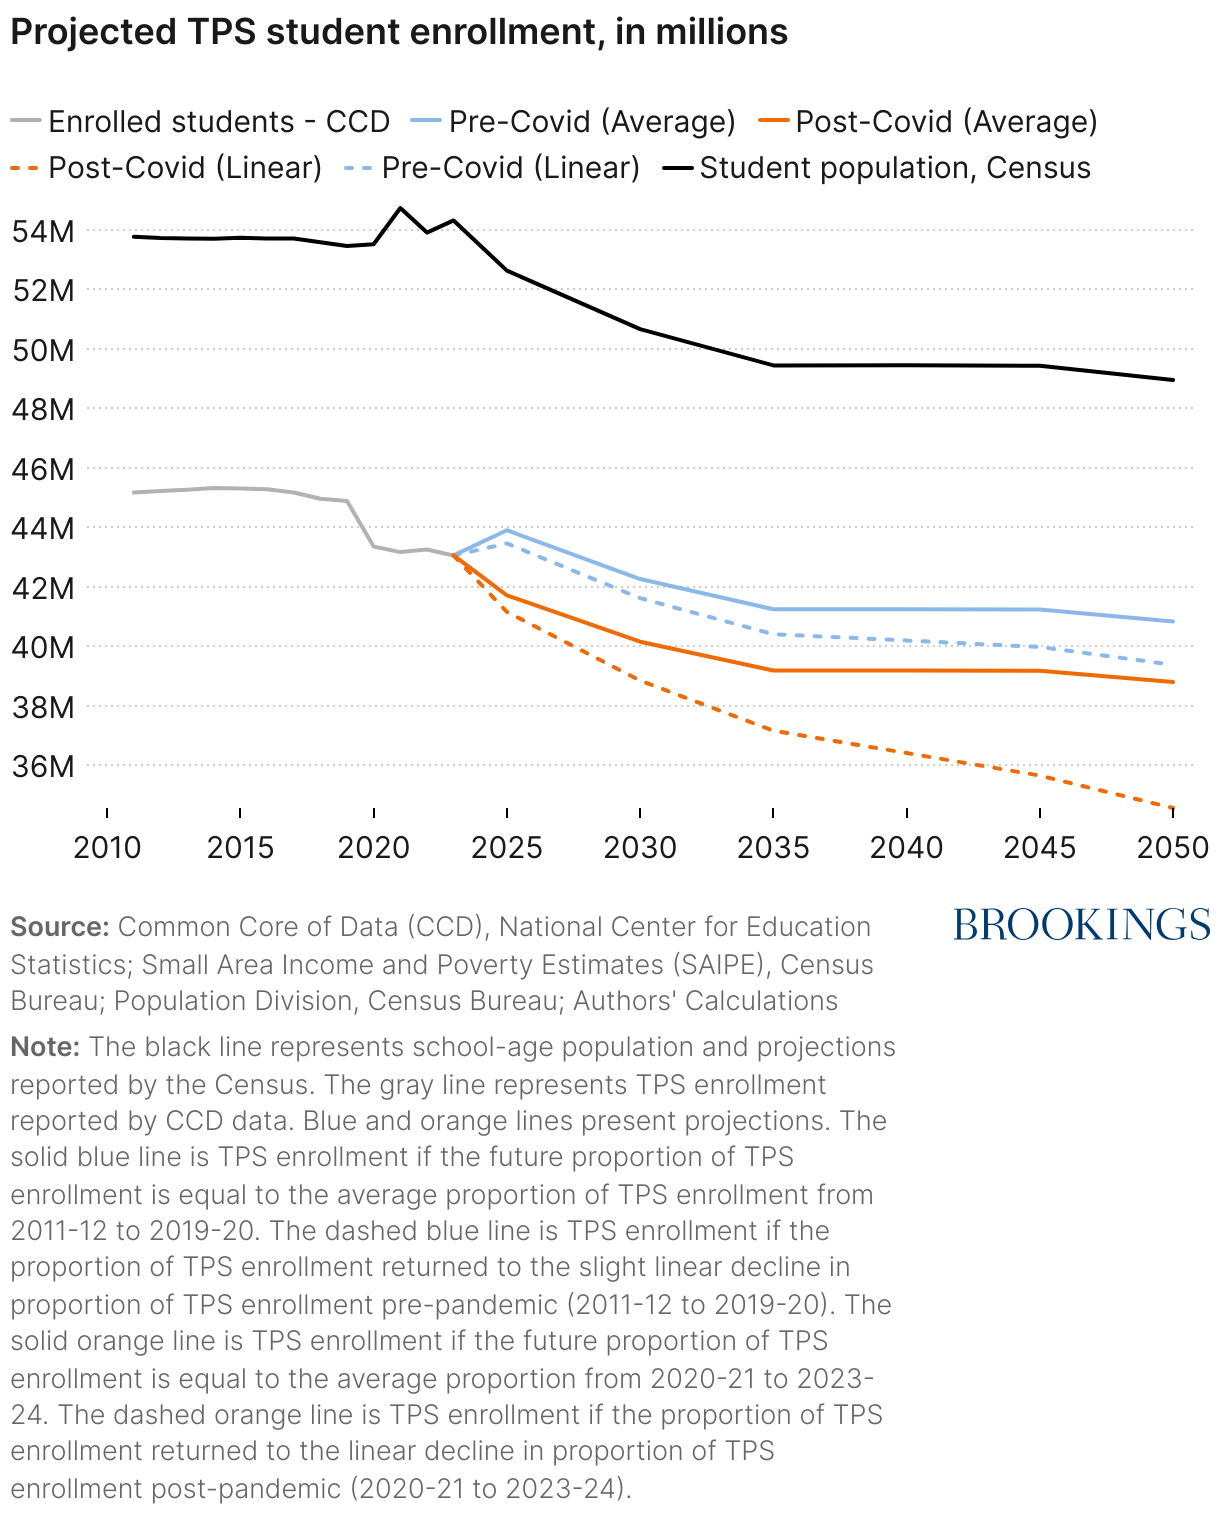
At the opening of the 2023-24 school year, the Common Core of Data recorded 43.06 million students in TPS out of 54.32 million school-age children. For 2025, the projections range from 41.16 million to 43.90 million TPS students, implying either a modest decline or a partial rebound. By 2050, however, all scenarios point downward, with TPS enrollment falling to between 34.57 million and 40.84 million. In practical terms, our estimates suggest that districts could potentially face declines of roughly 2.91 to 6.59 million fewer students over the next quarter century.
IV. Enrollment declines and permanent school closures
We calculate permanent closure rates for brick-and-mortar public schools by linking consecutive years of Common Core of Data files and identifying campuses that were open for one year but listed as permanently closed the next. Averaging these annual rates over 2012-13 through 2023-24 gives an overall picture of how frequently districts shutter schools. Appendix Table S2 shows the results, revealing wide state-level variation. Several states—including Idaho, Montana, Nevada, Utah, Alaska, Hawaii, Virginia, Maryland, and New Hampshire—show average closure rates below 0.5%. At the opposite end of the spectrum, Washington, D.C. (2.06%), Mississippi (1.81%), and Arkansas (1.64%) experience the most frequent closures.
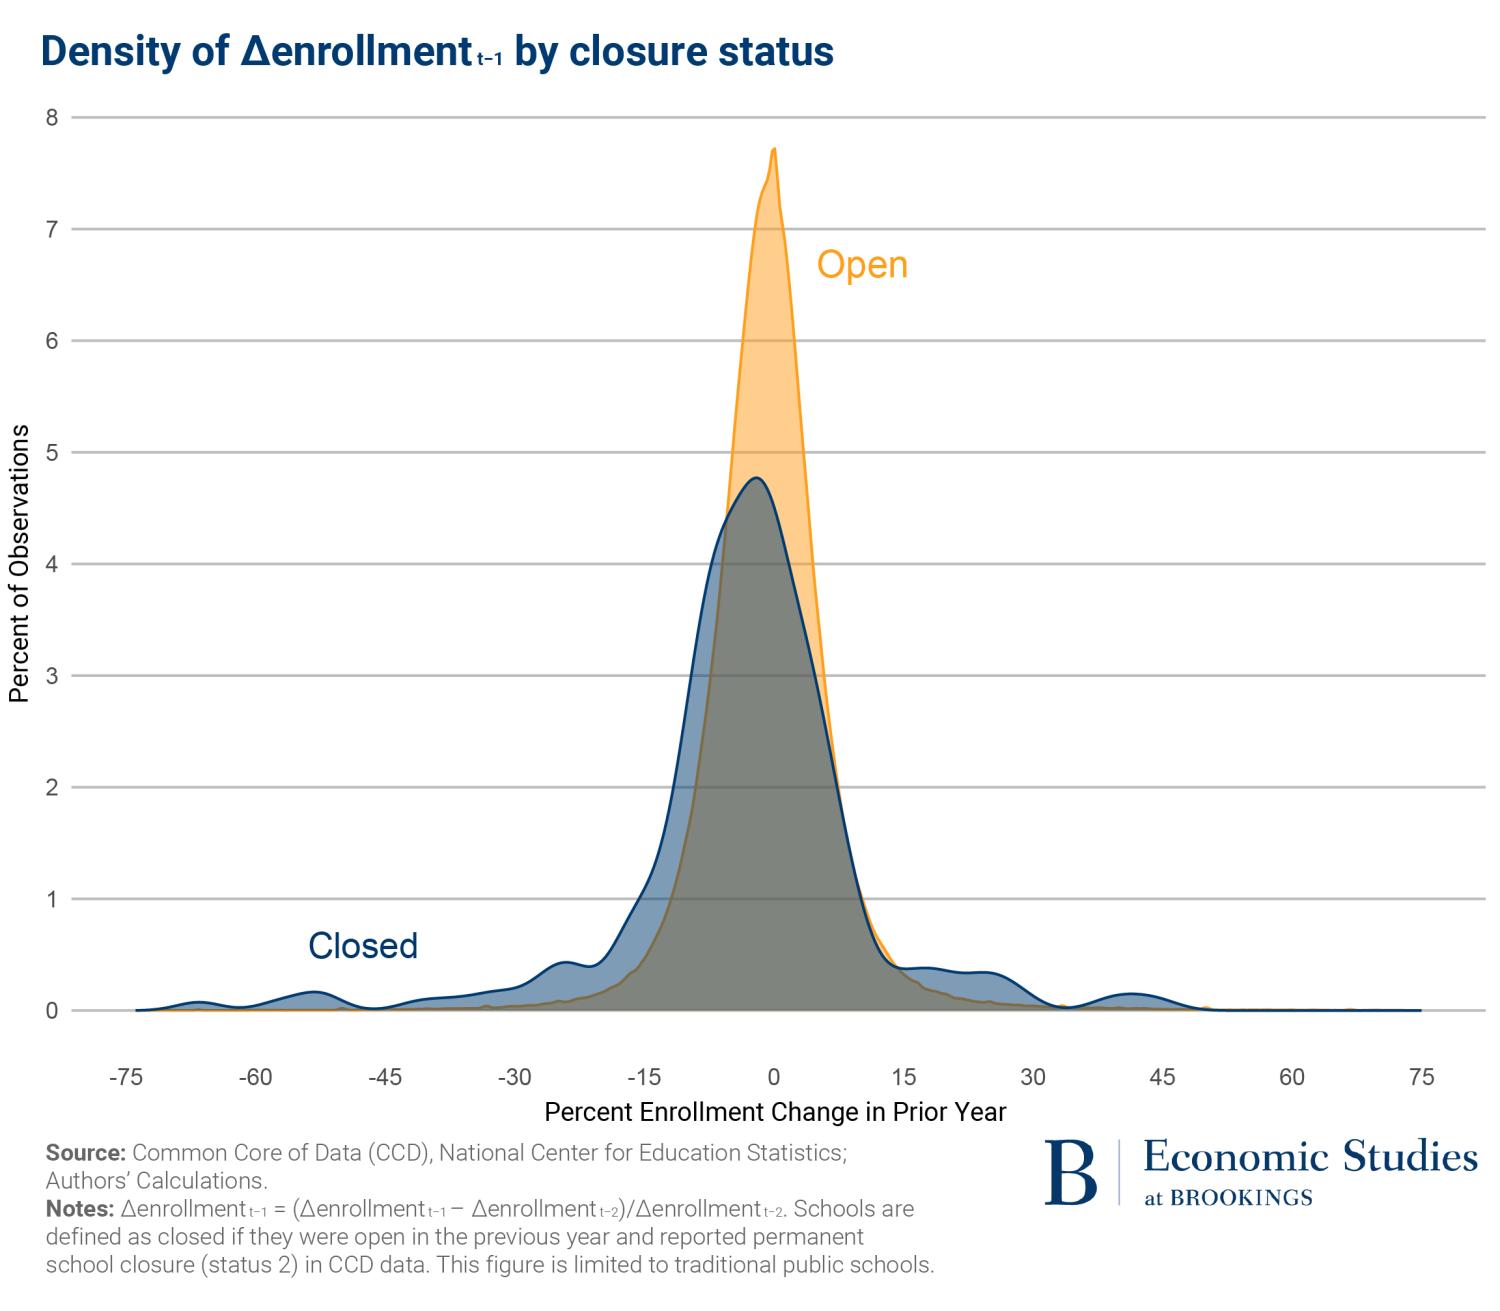
Do big enrollment drops increase the likelihood of permanent closures? To find out, we flagged every brick-and-mortar public school that was open one year but listed as “permanently closed” the next. Then we looked at how each school’s headcount changed from year to year. Figure 6 illustrates our findings. It shows the one-year enrollment swings for all schools from 2014-15 through 2023-24. The orange bars track schools that stayed open; the gray bars show those that shut down. Most open schools saw small changes, usually between a 15% loss and a 15% gain. Closed schools were different: Their numbers were spread out and tilted toward bigger drops in students. The pattern is clear: Steep declines make closure more likely but not certain. Plenty of shrinking schools remain open, and some that closed were not losing students at all. Decisions to shut a school site also hinge on building costs, the ease of moving students to nearby schools, neighborhood politics, school competition, and state rules on low performance. In short, falling enrollment raises the risk, yet school closures are rarely driven by one factor alone.
V. Discussion
The COVID-19 pandemic forced millions of families to rethink where and how their children learn, and the effects continue to reshape American K-12 education. Between 2019-20 and 2021-22, the last two years with complete private-school data, roughly 2.05 million additional students were newly missing from both public and private enrollment files, a 450% jump in the number of “missing” students. Traditional public schools accounted for 1.72 million of that total. Projections to 2050 suggest that, even if families eventually return to pre-pandemic habits, overall population decline alone will trim public-school rolls by about 2.2 million students. If, however, parents keep choosing alternatives at the pace observed since 2020, traditional public schools could lose as many as 8.5 million students, shrinking from 43.06 million in 2023-24 to as few as 34.57 million by mid-century.
Due to enrollment declines, two distinct concerns about the quality of students’ educational experiences emerge. Students who exit public schools often move into settings that are less regulated and more variable in performance. Those who remain in shrinking districts inherit tighter budgets because state and federal aid is generally tied to enrollment. At the same time, the pandemic-era shift may prove less durable than it appears: Homeschooling demands intense parental effort, and as more adults return to on-site work, some families may decide that public schools once again offer the most practical option.
This study draws on the newest district-level enrollment and population data to track where students are going, who is most affected, and how districts might respond. The evidence shows that the modest rebound in 2022-23 did not signal a broader recovery; instead, the number of students outside traditional public schools rose again in 2023-24. Understanding why parents leave, how administrators plan for continued declines, and which policy tools can preserve quality and equity will be essential as the education landscape continues to change.
Related Content


Authors


-
Acknowledgements and disclosures
Faidra Monachou acknowledges support from The Broad Center at the Yale School of Management.
The views expressed in this paper are solely those of the authors and should not be interpreted as reflecting the views of the Federal Reserve Bank of Dallas of the Federal Reserve System or of any other person associated with the Federal Reserve System.
The Brookings Institution is committed to quality, independence, and impact.
We are supported by a diverse array of funders. In line with our values and policies, each Brookings publication represents the sole views of its author(s).