

Figure 4 has been updated to fix an error with the labels
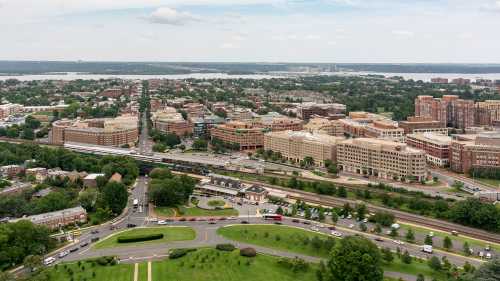
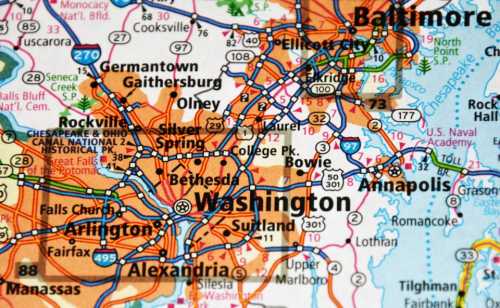
Since President Donald Trump began his second term this January, residents and regional leaders have wondered whether the administration’s policies would have unique impacts on the Washington, D.C., metropolitan area, known locally as “the DMV” (the District, Maryland, and Virginia).
Brookings’ DMV Monitor is an interactive dashboard tracking 24 indicators of the region’s “health,” first published in September, to provide an economy-wide perspective on the impacts of federal downsizing on the Greater Washington region. In this updated analysis, we turn to the region’s consumer economy. By examining spending at businesses with a physical location in the DMV region, we gain a dual insight into the region’s well-being: both how consumers are feeling about the region and what local businesses are seeing in terms of revenue trends. Here’s what we learned:
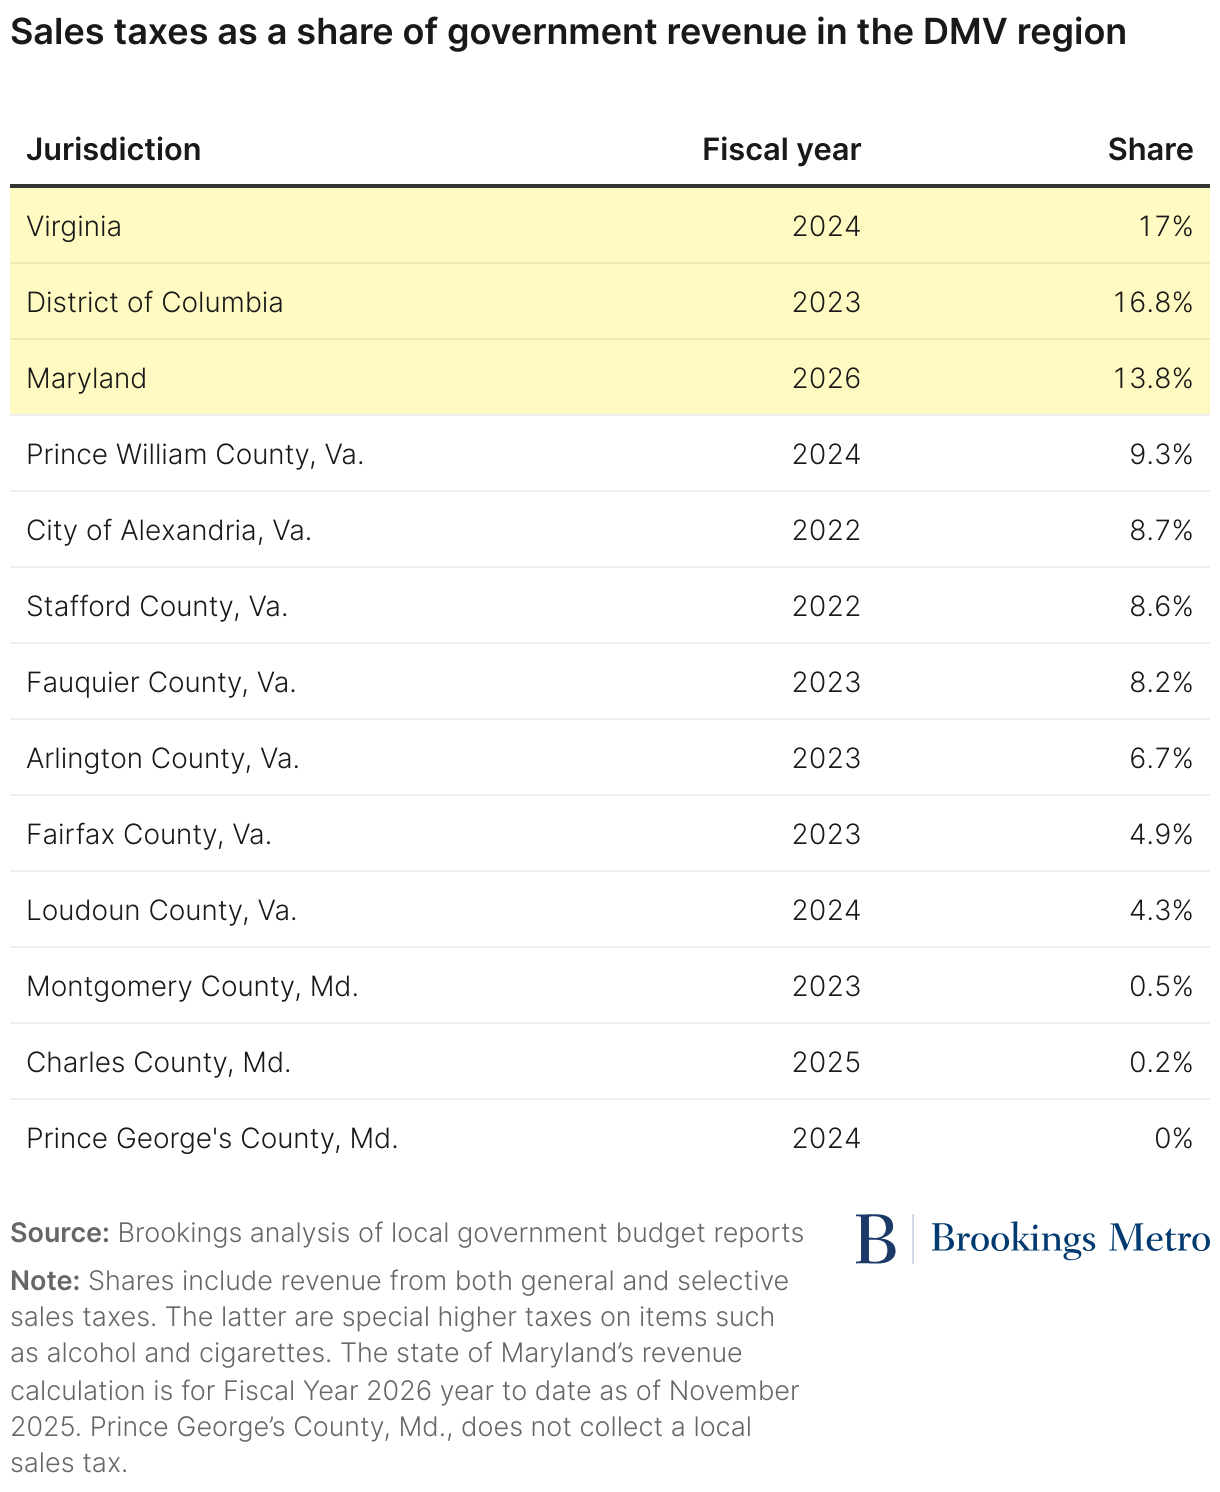
- Consumer spending matters to the DMV region: General and selective sales taxes are a substantial revenue source, comparable to property taxes, for Maryland and Virginia, and it is the third-highest revenue source in the District.
- In the DMV region, typically 18% of spending comes from visitors that live outside the metro area. The visitor economy matters more for some local jurisdictions than others; for example, this share is 33% in the District but only 9% in Alexandria, Va. (2023 numbers; shares are stable across years).
- The first year of the second Trump administration has been notably bad for visitor spending in core jurisdictions where the visitor economy is more important.
- Local spending by DMV residents peaked in 2022 (pandemic “revenge spending”) and has declined every year since. Comparing Q1 through Q3 of each year, 2025 local spending is only 1.1% lower than 2024, suggesting that the immediate impacts of the Department of Government Efficiency (DOGE) on overall local shopping were minimal.
- DMV resident spending in the District declined when the National Guard was deployed this August.
Related Content

Why consumer spending matters and how we measure it
Consumer spending at local businesses is an indicator of household well-being, and includes both necessary and discretionary spending that households engage in to meet their needs and wants. Such data can help us understand if, for example, the increased unemployment in the DMV region we observed in the first half of 2025 is having a measurable, market-level effect on consumers. Consumer spending is also the source of revenue that supports local businesses, and thus the income and wealth-building of local entrepreneurs. Finally, consumer spending generates sales tax revenue, which balances local budgets and helps cover the cost of services, especially at the state level. Table 1 summarizes the share of sales tax revenue for various jurisdictions in the DMV region.
For context, while consumer spending is a small fraction of the overall spending that happens in the economy (which also includes federal spending and business-to-business transactions), many of these other transactions are upstream of ultimate consumer spending. In fact, the Bureau of Economic Analysis estimates that personal consumption expenditures (i.e., both goods and services) comprise roughly two-thirds of national gross domestic product (GDP). Consumer spending is therefore a critical economic indicator.
We calculated consumer spending shares and trends using a dataset from Datafy, a company that provides insights about spending, visitation, and performance of every local economy, in combination with advertising technology. Datafy compiles their dataset using a sample of credit cards from a widely used spending data aggregator, Affinity Solutions. Datafy uses this sample in combination with other signals to generate a total estimate for consumer spending.
The spending data cover only credit-card-based transactions at businesses that are physically located in the DMV region; in other words, they do not include online purchases where the transaction occurs outside the DMV, even transactions fulfilled by local businesses such as groceries ordered through Amazon or spending at restaurants through DoorDash. Additionally, some categories of spending that are not typically representative of visitor activity are excluded, such as health care expenses, utilities, and civic payments and fees. Nationwide, there was a 1.7% increase in the share of retail sales done online between 2022 and 2024, so this trend is a real but modest factor to consider when interpreting the results presented in this report.
In our analysis, we disaggregate the spending source by visitors to and residents of the DMV region based on the billing ZIP code of the card. Our dataset extends from May 2021 through September 2025, and all figures presented are in real dollars (i.e., adjusted for inflation).
Visitor demand in the DMV region is down
In the DMV region, the vast majority of the spending that supports local businesses comes from local spenders. Across years, a stable share of approximately 18% of consumer spending in the DMV region is from visitors with billing ZIP codes outside the region. However, there are counties where visitor spending is much more significant. For example, 42.3% of consumer spending in Warren County, Va., is from outside the region, due to the county’s location at the nexus of interstates 66 and 81 and its role as a gateway to Shenandoah National Park. At the other end of the spectrum is Charles County, Md., where only 6.4% of spending is from visitors.
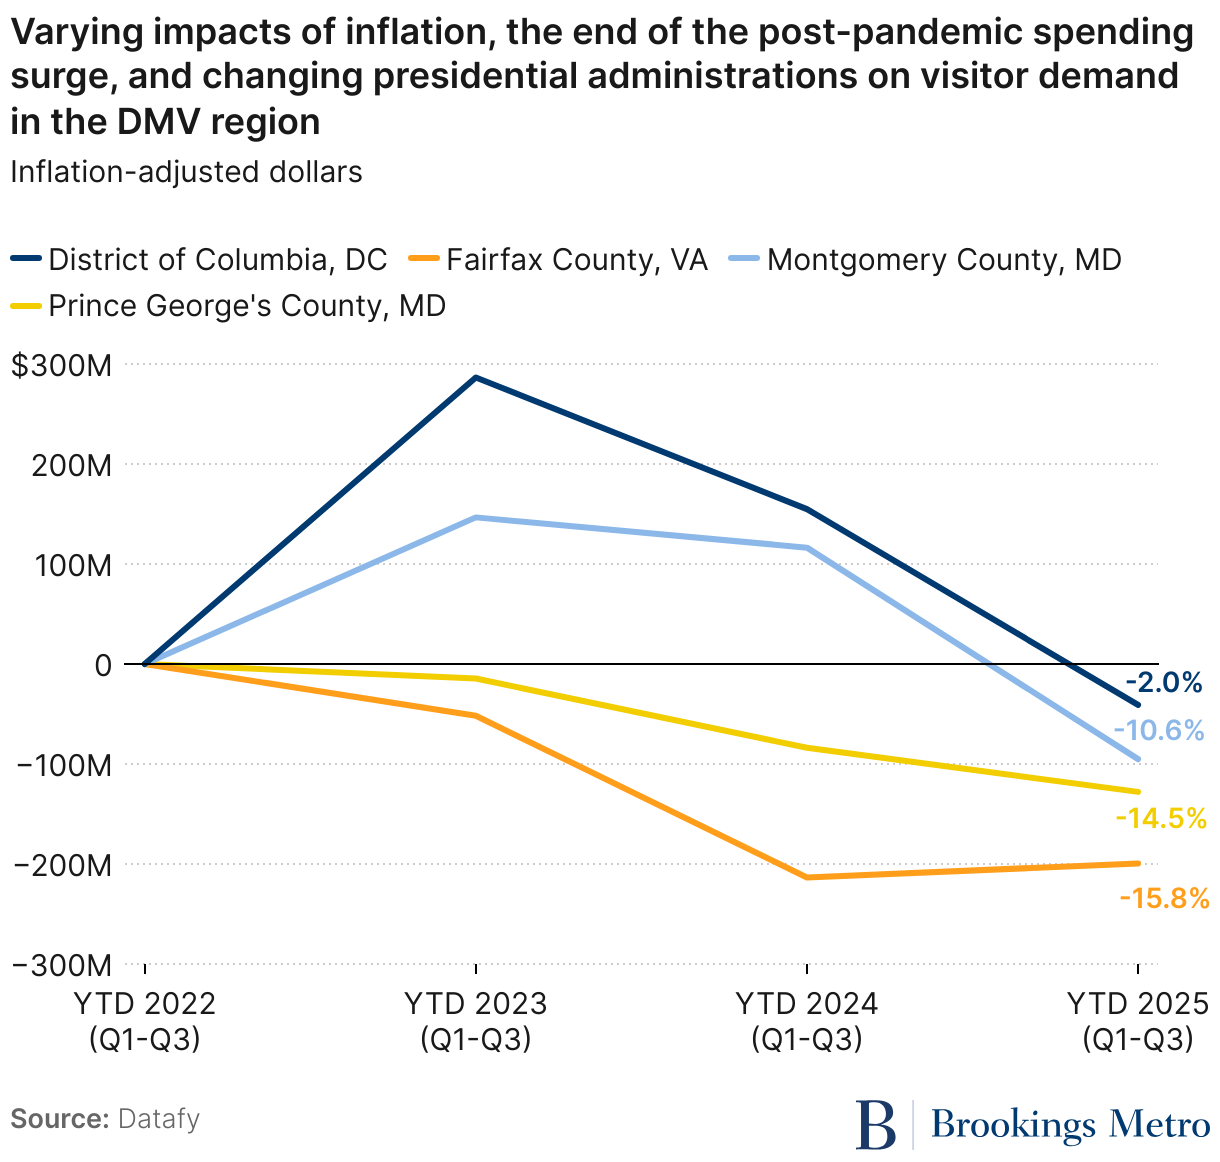
In the DMV region, there are four jurisdictions where cumulative annual visitor spending is measured in billions of dollars: the District of Columbia, Fairfax County, Va., Montgomery County, Md., and Prince George’s County, Md.1 Figure 1 shows the trajectories of visitor spending in these four jurisdictions since 2022. In order to examine trends into 2025, we compared the Q1 to Q3 cumulative total of each year in which data were available. These four jurisdictions illustrate that visitor spending trends are not regional—in other words, there is not necessarily one single spending trend happening across the region. Fairfax and Prince George’s counties have had weak visitor spending since the end of the post-pandemic bump, following the similar pattern in resident spending. The District and Montgomery County, however, seem to have a visitor base that is less inflation-sensitive. In fact, the unusually early and long cherry blossom season in 2024 led to record spending in the District.2 Neither jurisdiction fell below 2022 spending levels until 2025, suggesting a possible link to Trump administration policies impacting visitor demand for these specific jurisdictions.
Local trends show the disappearance of post-pandemic ‘revenge spending’
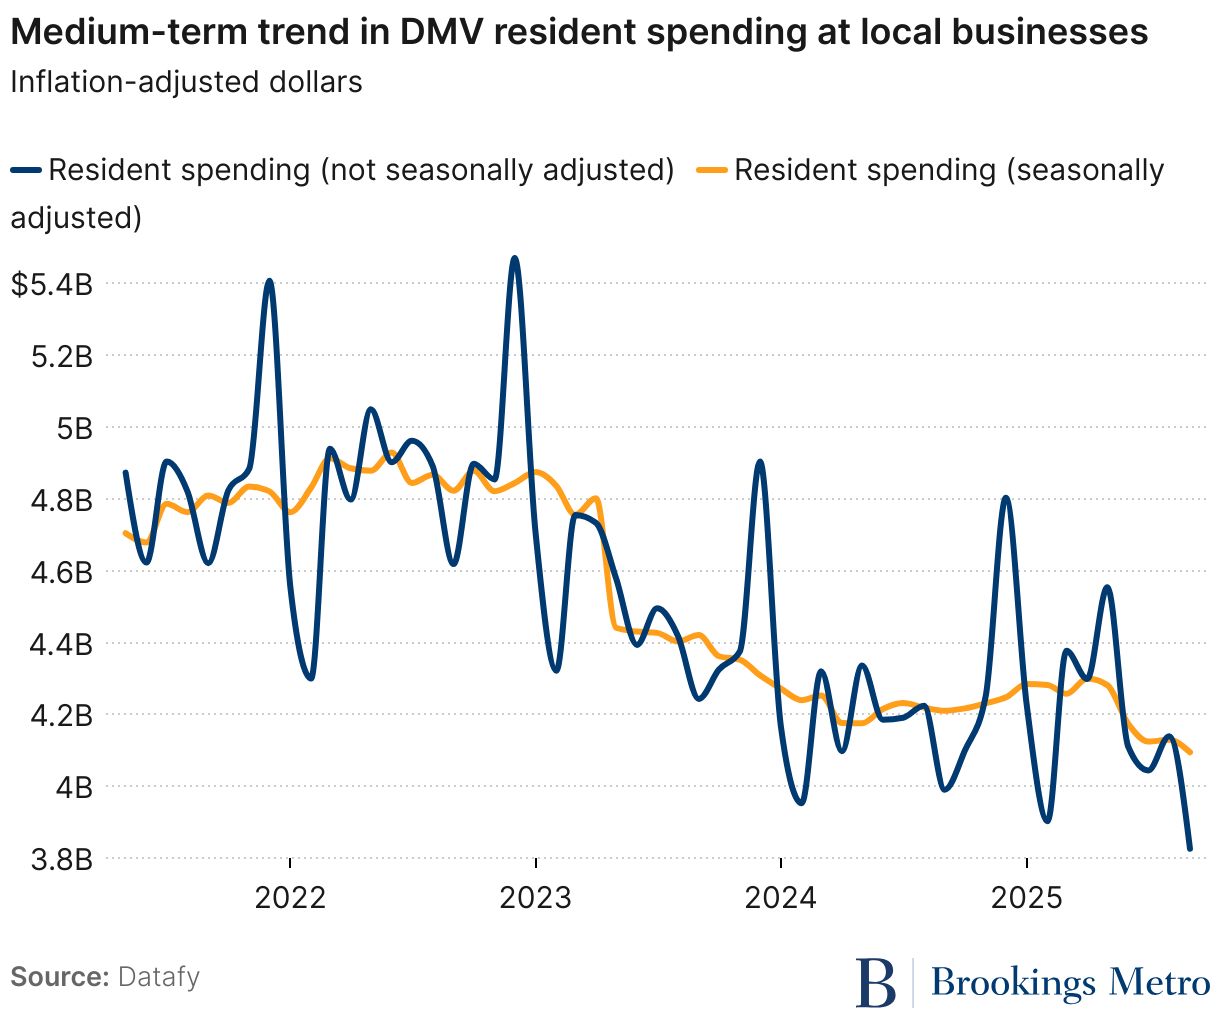
A confluence of factors has disrupted the timeline of consumer spending at businesses in the DMV region, resulting in medium-term year-over-year declines. As the region emerged from the pandemic, spending was strong in 2021 and even better in 2022. This is consistent with the national consumption trend, which saw major surges in 2020 and 2021, as well as higher-than-typical growth in 2022—popularized in media as pandemic and post-pandemic “retail therapy” or “revenge spending.” Local spending by DMV residents peaked in 2022, and has declined every year since (Figure 2).
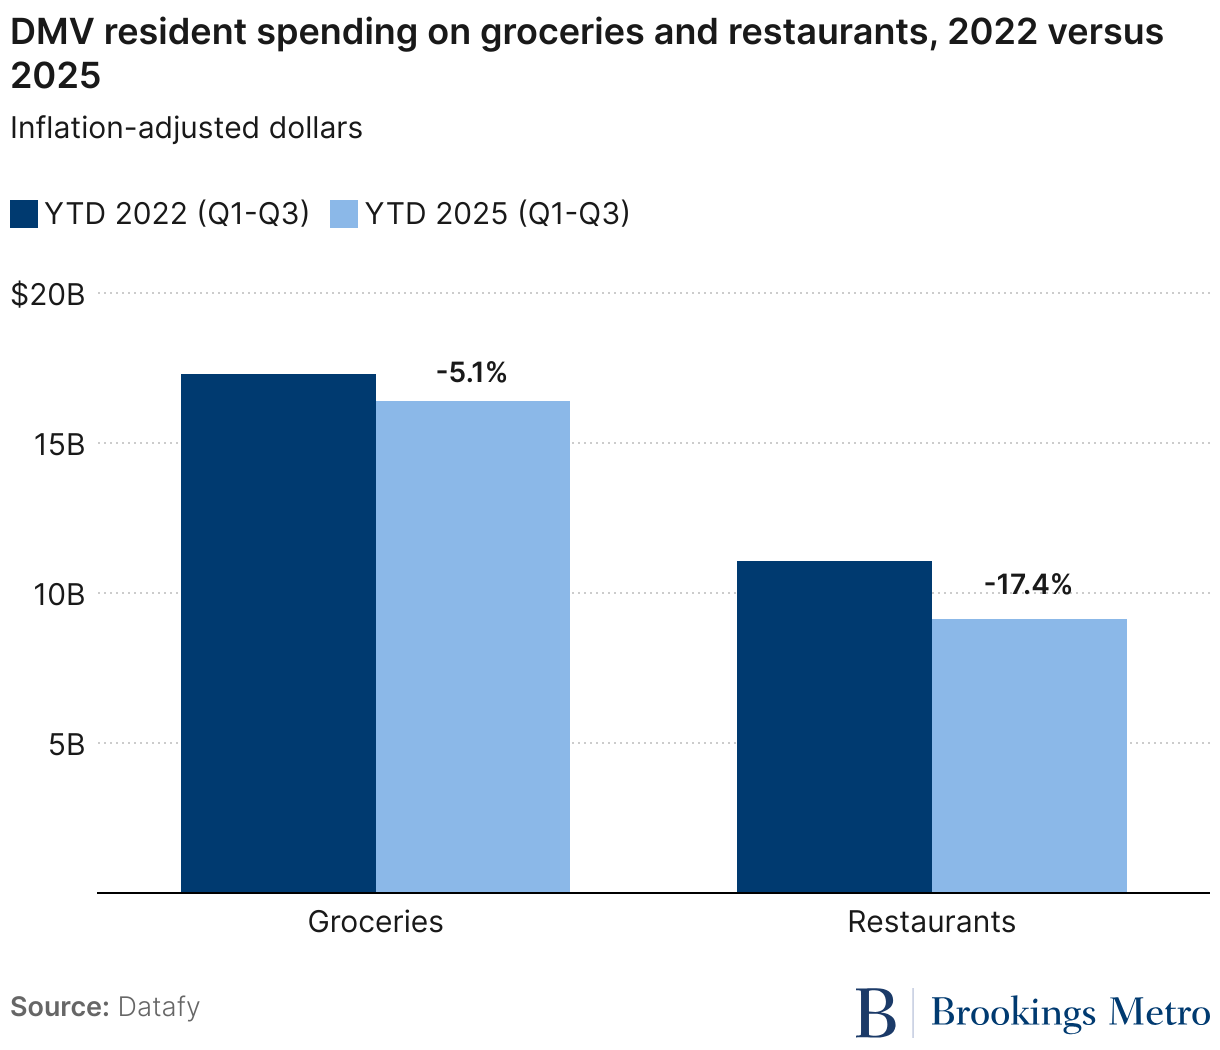
The cumulative impact of this decline is significant. For example, more than half of all DMV resident spending is on food and drinks across two subcategories: groceries and bars/restaurants. Figure 3 shows how resident spending in these subcategories has evolved over time. While both grocery and restaurant spending have declined from their 2022 peaks, the far steeper decline in restaurant spending is over twice as large in absolute dollars off a lower baseline—resulting in a 17.4% drop over just four years.
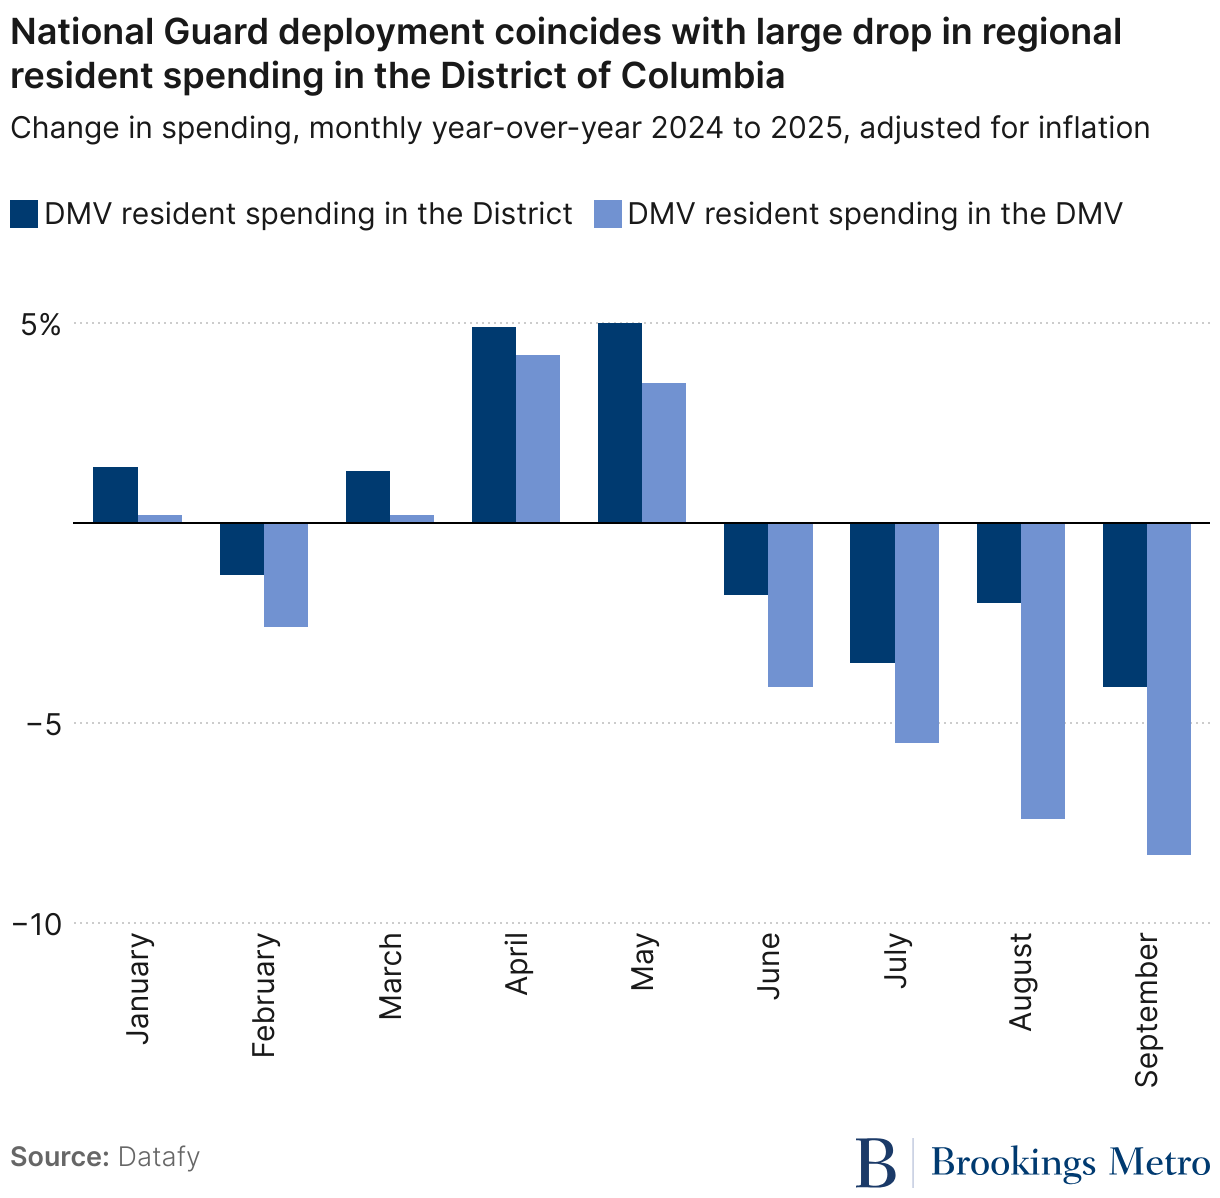
The vast majority of this decline in resident spending occurred in 2023 and 2024. When we look at total resident spending across all subcategories, the decline from 2022 to 2024 is 12.9%. In 2025, aggregate spending year-to-date is almost identical to 2024’s first three quarters, caused by positive year-over-year growth in the first two quarters, followed by a 3% to 4% drop in year-over-year spending in Q3 (see Figure 4). This suggests that in the DMV region, any impact of DOGE or early Trump administration changes on local consumer spending was at first negligible. However, it is important to note that this study period does not include the federal government shutdown, and the Q3 trend reversal merits further discussion.
The impact of National Guard deployment in the District
This August, President Trump deployed the National Guard, drawing from the District’s own forces as well as several other states, to Washington, D.C. Our analysis shows no subsequent impact on visitor spending in the region or the District, which remained on a negative trend consistent with 2024 and the rest of 2025. However, there was a dramatic shift in local behavior.
As Figure 4 shows, in spring 2025, residents actually spent more money in both the District and the region at large than the previous year. This was followed by a negative spending trend in June and July, following the same trajectory as resident spending in the region as a whole. Then, in August and September, the gap between resident spending in the District and the DMV region as a whole expanded by two to three times.
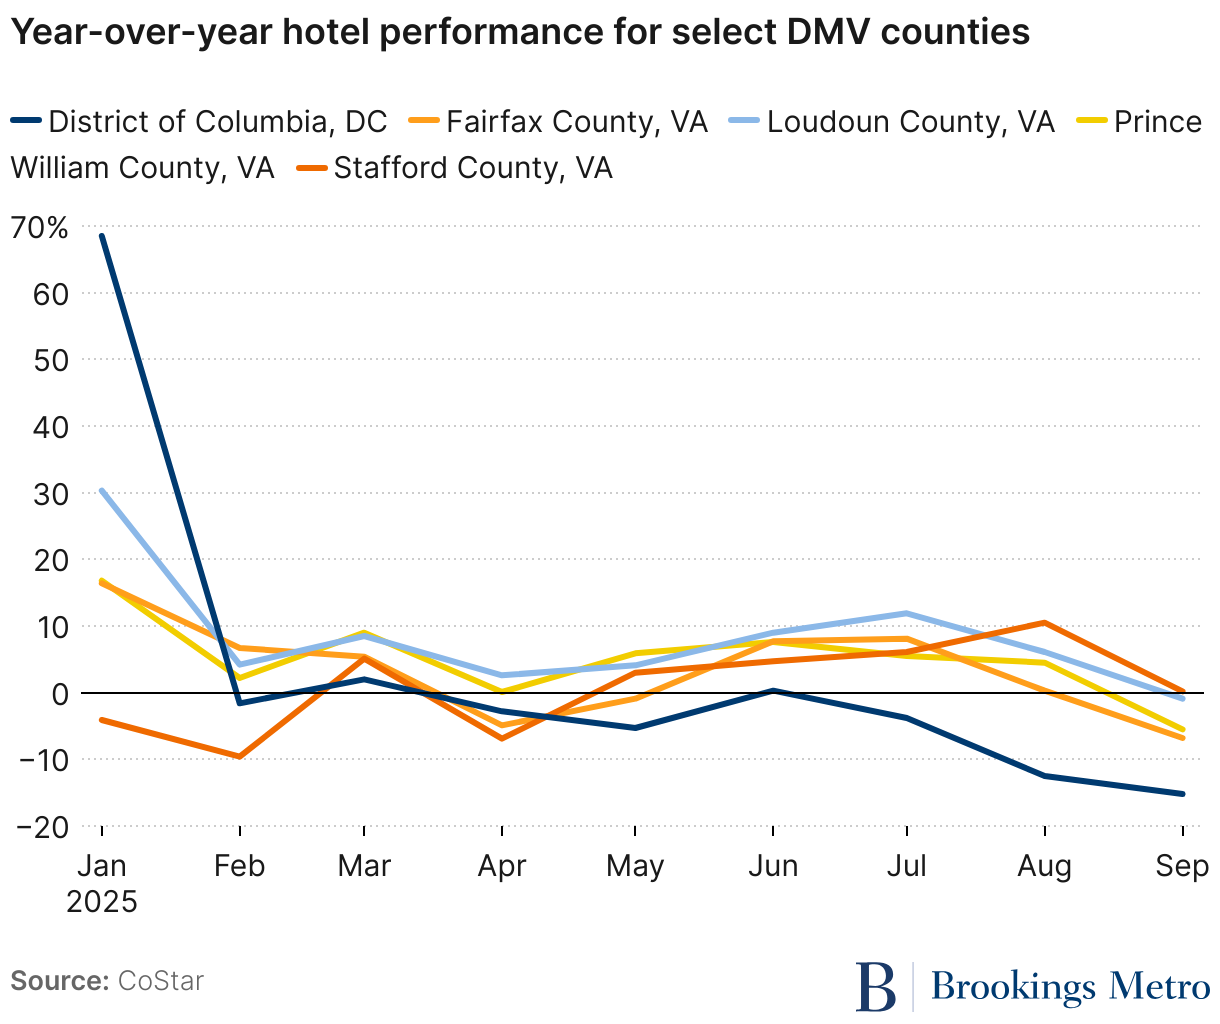
Despite visitor spending remaining stable in the wake of the National Guard deployment, decline in regional demand for the District is also visible in hotel performance data. Revenue per available room (RevPAR) is a typical performance indicator the hospitality industry uses to understand how well a hotel is doing considering both the rate charged for a room and the actual occupancy of the hotel (in short, a hotel version of a vacancy-adjusted asking rent).
Figure 5 shows the year-over-year monthly change in RevPAR for hotels in each of the DMV region’s core counties. The figure shows that following a strong boost to the region (and especially the District) during the January inauguration, the region had a slightly weak spring season. Over the summer and into the fall, a clear gap in performance opened up between the District and its neighboring counties, where approximately 1,300 non-local troops are reportedly accommodated in hotels.
Conclusion
Consumer spending is a major piece of the puzzle of economic activity comprising total productivity, and an important source of state government revenue. It is also a clear measure of how households and small businesses are doing. Early indicators are that DOGE and other federal downsizing activities, which negatively impacted both direct federal employment and private job growth in the DMV region, did not immediately mute regional consumer spending. However, other federal actions—including the National Guard deployment to Washington, D.C.—appear to have turned off residents from spending in the region and especially the city.
In addition, visitor spending has been a mixed bag, with some counties struggling in the medium term after the post-pandemic bump, and others seeing a slump in demand only with the change in administration. The net result is that spending at local businesses is down in the region, especially in Q3, suggesting Q4 is at risk as well. Yet while the District of Columbia’s chief financial officer revised consumer spending forecasts downward for both 2026 and 2027, reduced sales tax revenues have not yet become reality and remain a category to watch.
Authors

-
Acknowledgements and disclosures
The authors thank Amy Liu, Terry Clower, Timothy Canan, and Gregory Goodwin for their review of earlier drafts of this piece, and Mary Elizabeth Campbell for research assistance. Any remaining errors or omissions are those of the authors.
-
Footnotes
- Totals for Fairfax County, Va., include the independent cities of Fairfax and Falls Church. Totals for Prince William County, Va., include the independent cities of Manassas and Manassas Park.
- The figures cited in this press release from the District of Columbia government are consistent with our independent data analysis using a different data source.
The Brookings Institution is committed to quality, independence, and impact.
We are supported by a diverse array of funders. In line with our values and policies, each Brookings publication represents the sole views of its author(s).