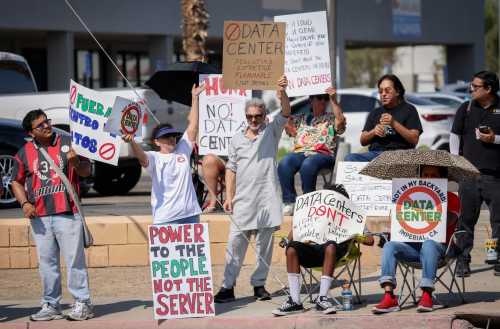
Presidential elections are a great time to take stock of what issues matter to voters, and, based on early indicators, solving the country’s digital divide is certainly one of them. Senator Elizabeth Warren and Mayor Pete Buttigieg have each introduced sweeping plans to address broadband inequities, including gaps in physical networks and lack of digital training. While each proposal is a bit different, there are signs that the eventual Democratic Party candidate may include ambitious and sweeping broadband reform in their campaign.
Broadband, which enables high-speed internet access, is essential infrastructure in our digital age. However, with 19 million disconnected households across the country, it is impossible to capitalize on broadband’s full economic and social impacts. While a presidential platform can incentivize policy reform at the federal level, the road to change is still a long one, slowed by political infighting and congressional discord.
Instead of waiting for the stars to align in Washington, we should focus on states as an important middle ground. States have access to a range of tools and resources—independent of federal action—to promote broadband availability and adoption within their borders. The question is whether they will actually use them.
At a time of vast divergence between economically thriving regions and those facing economic stagnation, it’s important to understand the digital divide at the state level. This piece uses American Community Survey 1-year data to judge state broadband performance and how those trends can inform future policy design.

The digital divide between states is narrowing
Over the past five years, the average state saw an increase in broadband adoption from 72.4% in 2013 to 82.8% in 2017. While all states saw increases in broadband adoption rates over the five-year span, the gains were most significant at the bottom, closing the gap between the highest and lowest adoption states. In 2013, the average broadband adoption rate for the top ten states was 78.8%, while the average adoption rate for the bottom ten was 14.8 percentage points lower, at 64.0%. By 2017, the gap between the top and bottom ten had fallen to 10.6 percentage points.

Though data for broadband adoption rates by income group only goes back to 2015, the gap between average adoption rates for high-income (those earning above $75,000) and low-income (below $20,000) households is also narrowing. In 2015, the average state saw a 42.6 percentage point difference in adoption rates between high and low earners. In 2017, the difference between high and low earners dropped to 35.5 percentage points. Though the gap is narrowing, there’s still a long way to go for states whose low-income residents lag so far behind their higher-earning neighbors.
Table 1. 10 states with lowest adoption rates for low-income households
|
State |
Overall Broadband Adoption Rate (%) |
Broadband Adoption Rate for Households Earning Below 20k (%) |
|
Mississippi |
73.4 |
49.7 |
|
Arkansas |
73.0 |
49.8 |
|
Louisiana |
75.6 |
50.8 |
|
New Mexico |
76.4 |
53.9 |
|
South Carolina |
79.2 |
54 |
|
North Dakota |
81.3 |
54 |
|
South Dakota |
80.6 | 54.1 |
|
Pennsylvania |
81.5 |
54.2 |
|
Maine |
82 |
54.3 |
| Kentucky | 78.9 | 54.4 |
Not all broadband connections are the same
According to the Federal Communications Commission, the word “broadband” actually refers to a spectrum of technologies, including both fixed and mobile services. And even though mobile services meet the statutory definition of broadband, it is not a full substitute for fixed, in-home services.
This distinction—in-home and mobile services are complements, not substitutes—makes it all the more concerning that the states with the lowest broadband adoption rates also have the highest mobile-only subscriptions. The 10 states with the lowest rates of household broadband adoption had a mobile-only subscription rate of 14.1%, with states in the Southeast and South Central registering the highest mobile-only rates.


What drives the differences between states?
In understanding what drives different outcomes across states, we looked at four variables of interest: income, race, rural population, and education. Using regressions to analyze those variables, our team found results similar to many other researchers before us (see here and here). States with higher median incomes, higher rates of education, fewer residents of color, and a smaller rural population share had higher overall broadband adoption rates. In terms of mobile-only subscriptions, the reverse is true. States with larger shares of Black residents and lower levels of education had higher rates of mobile-only services.


The growing research consensus around these variables of interest presents a valuable opportunity to inform policy design. If specific factors consistently impact broadband adoption, states can prioritize policies that will overcome barriers to more equitable broadband performance. For example, states with higher shares of low-income residents may want to prioritize policies to address affordability, while states with residents with lower levels of educational attainment may want to prioritize digital literacy programming.
What levers do states have?
States have a number of tools they can employ to expand broadband services and increase adoption rates across the state. A recent project by the Pew Charitable Trusts lays out the different funding mechanisms, funding goals, incentives, and policy initiatives that states can leverage to extend services by offsetting the cost of deployment or encouraging more providers to enter the market.
With so many factors at play in a given state, it is difficult to gauge the effectiveness of any one program. But the breadth of levers is worth exploring. Maine, for example, provides a tax credit for leasing or buying broadband equipment. Virginia is using money from the Tobacco Region Revitalization Commission to expand broadband programs. And many other states have set up funds directed to underserved areas, as well as “last mile projects” that deliver broadband service directly to customers.
However, there is still more that states can do. Many should reconsider laws that block local efforts to expand broadband access, which limit opportunities to service populations that privately owned broadband networks will not.
Although increasing broadband availability is an important step, states can also do more to develop scalable adoption programming. After all, according to a recent report by Pew, only 22% of non-broadband users cite a lack of access or speed as a prohibitive barrier. Meanwhile, 50% cite cost as a major factor, and 45% cite a lack of relevancy (or perceived usefulness).
These numbers, backed by our earlier findings, suggest that states need to do more to increase affordable options and digital literacy training. North Carolina, for example, has a Broadband Infrastructure Office, which has published a set of recommendations to increase adoption rates. These include advertising low-cost options, extending high-speed service to libraries, and building out digital literacy tools.
The digital divide between states only further confirms the country’s broadband needs. Federal action may be difficult to predict, but states have a unique opportunity to address their challenges today while informing the eventual federal policies to come.
Related Content


Authors


The Brookings Institution is committed to quality, independence, and impact.
We are supported by a diverse array of funders. In line with our values and policies, each Brookings publication represents the sole views of its author(s).

Commentary
Broadband adoption is on the rise, but states can do much more
October 10, 2019