This publication originally cited White House award data as of October 5, 2023, and now reflects the November 15, 2023 award data, which added 3,738 new awards. The written analysis found greater award progress under Transportation formula programs and over $5 billion in additional competitive grantmaking under Energy programs. Additionally, Democratic-leaning states now see their share of total competitively-awarded funding increase by 3-to-4 percentage points.
November 15, 2023, marks the two-year anniversary of the Infrastructure Investment and Jobs Act (IIJA) becoming law. After decades spent waiting for Congress to pass such a historic infrastructure bill, this is certainly a celebratory moment. But considering we’re now 40% of the way through the law’s authorizing period, it’s also a moment to take stock of our progress.
It’s typically difficult to track large spending bills, and with 452 unique funding pots and over $850 billion in total funding available, the IIJA should be no different. Fortunately, the Biden administration continues to prioritize data transparency by publishing the law’s detailed award data. It’s not hyperbolic to say the American public has never had a better view into the actual funding progress for a federal infrastructure law.
So, at the two-year mark, where do we stand?
Based on our analysis of published White House data, IIJA implementation is just now hitting its stride. Formula and direct federal spending continue to move at a steady pace, already pumping $306 billion into state coffers and direct investment projects. And like an athlete who grows into a game, competitive grantmaking is steadily increasing, with 80% of all competitive funding still left to be awarded. Just as importantly, the Biden administration has shown no flagrant political bias in splitting awards among states—certainly welcome news to the bipartisan legislators who authored the bill.
Overall, state and local stakeholders should feel motivated to keep pursuing federally funded projects to rebuild and reimagine their communities. With over half of the IIJA’s 5,532 competitive awards coming in under $1 million—and another 29% of awards falling between $1 million and $10 million—eligible entities of all sizes can find programs that fit their needs and capacities. Yet with inflation and interest rates high, infrastructure builders need to be careful that they prioritize projects that can deliver the most value in the long run. There’s more money than usual, but it’s far from infinite.
Federal agency staff are implementing the IIJA as expected, with sector-specific progress uneven per the law’s design
The IIJA is unique in its comprehensiveness. Whereas Congress typically passes separate bills for each infrastructure sector—or, in the case of broadband, no bills at all—the IIJA merged multiple built environment and natural environment program areas within one piece of legislation. Combined with the aforementioned push for data transparency, the IIJA is a truly unique opportunity to track and compare how implementation works across multiple sectors and federal award categories.
Formula or direct spending is moving at a steady pace within each of the IIJA’s major infrastructure sectors. Since the law mandates exact spending amounts under these programs, we knew the general cadence at the time of the bill’s signing. This is most clearly seen under transportation and water, where staff at the Department of Transportation and Environmental Protection Agency manage long-established formula programs such as the National Highway Performance Program and Drinking Water State Revolving Fund. It’s also a huge credit to staff at the National Telecommunications Information Administration, who stood up the new Broadband Equity, Access, and Deployment (BEAD) formula program and already managed to effectively make all its state-based awards. Overall, 47% of the $647 billion in formula or direct spending is already awarded, and that number will continue to jump as more of the FY2024 formula awards are given.
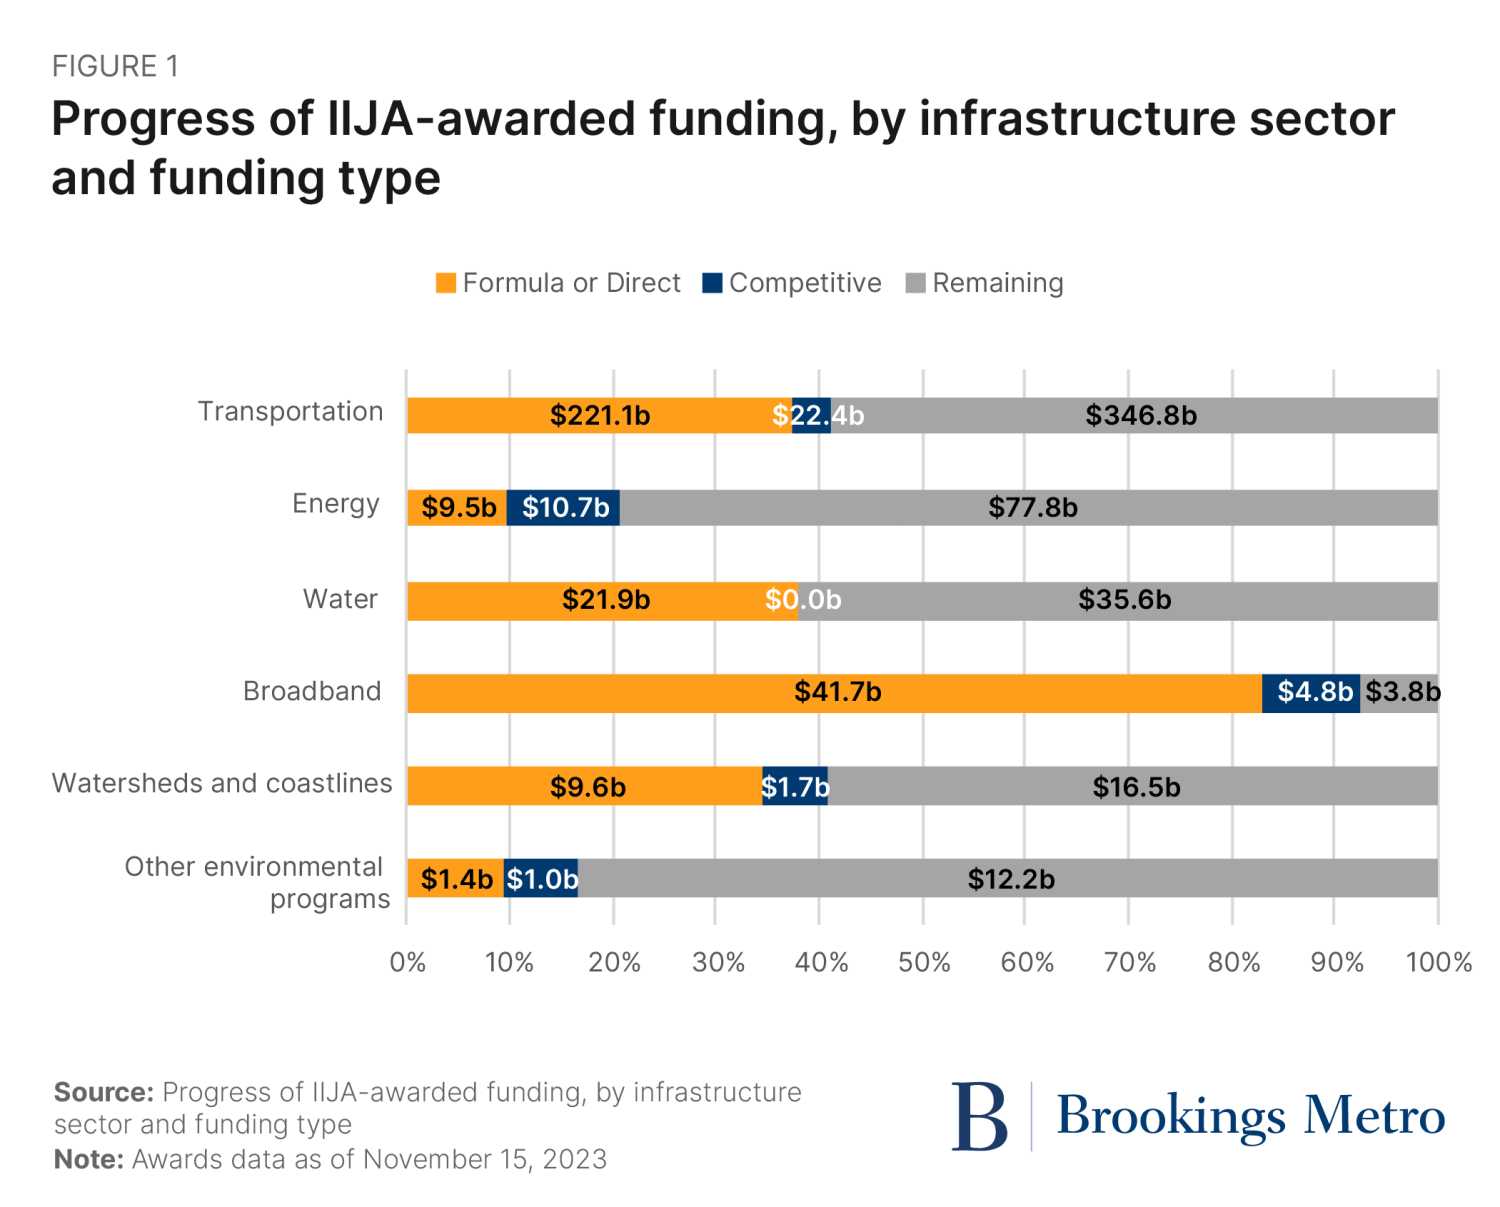
The IIJA’s competitive grants are moving at a slower pace—not surprising, since these programs demand federal staff to annually review processes, publish Notices of Funding Opportunities, and conduct extensive application reviews. The demands on staff were only intensified due to the growth in total competitive funding and the need to stand up 93 new programs. Under these circumstances, federal staff should be applauded for getting over $40 billion out the door in just two years—$18 billion of which is within new programs such as Battery Materials Processing Grants and a western-focused Drought Resilience Program. Total awards will continue to rise significantly in each publishing batch—particularly the next one, which will include $16.4 billion for rail projects in the country’s Northeast Corridor.
The Biden administration has not politicized the competitive portions of the law
Any time Congress passes a major spending bill with significant amounts of competitive grantmaking, it creates the possibility for the current presidential administration to politicize who receives federal funding. Elections certainly have consequences, but voters shouldn’t expect to get less infrastructure investment if their community or state didn’t vote for the sitting president. Yet based on experiences during the Obama and Trump administrations, we know that political maps can influence award maps.
Fortunately, the Biden administration has not overly politicized their competitive grantmaking process, at least through these first two years.
To judge political leaning, we categorized each state by how residents voted in the 2020 presidential election and the political composition of a state’s governor and legislature. We then looked at each category’s share of winning awards and the funding within them, with additional analysis of awards under $10 million. Finally, we included national population shares to help frame the data.
No matter the measure, competitive awards never favor Republican- or Democratic-leaning states by more than a few percentage points when compared to their national population shares. For example, the share of all awards slightly favors Republican-leaning states by both the presidential election measure (46%) and in-state political composition (43%). Analyzing funding amounts is the inverse: Democratic-leaning states are outpacing their population shares by a few percentage points, particularly when looking at in-state political composition (47%). Still, the difference is not enough to suggest a flagrant bias toward Democratic-leaning states. All this will shift next quarter once the Northeast Corridor rail funds hit, as those programs are designed to funnel investment to states that happen to lean Democratic.

There are extremes within the data, of course. Florida and Indiana both have won $38 and $40 per capita, respectively. By contrast, Alaska ($1,956), North Dakota ($514), and Montana ($374) all received the most funding per capita. Many of the states served by Amtrak’s Northeast Corridor currently have relatively low per capita award levels, although the recent rail awards will change that.
Of course, these results don’t tell us much about the underlying process. The applicant fields are likely deeply uneven depending on the program. The public also can’t see who the losing applicants are, although there are some agencies that publish lists. There’s also a likelihood that some elected officials’ political antagonism toward the Biden administration could create a culture that depresses applications within their state or community. Putting aside whether that wins political points in a future election, bringing less competitive funding home only leaves more for other states to win.
The IIJA’s total economic impact will continue to evolve
As more states and localities put their federal dollars to work, we can expect to see an increased demand for skilled labor. October 2023 unemployment in the construction and utilities sectors was still extremely low by historical standards (4% and 2.5%, respectively), with growing project demands only serving to increase worker bargaining power. Meanwhile, as my colleague Joseph W. Kane has researched extensively, a high number of separations within infrastructure occupations will continue to challenge retention and recruitment.
Construction of IIJA-funded projects will last well beyond 2026, when the legislation expires, and Inflation Reduction Act tax credits will support energy-related projects for another nine years. America needs to get serious about growing and diversifying the infrastructure talent pipeline, because time is running out.
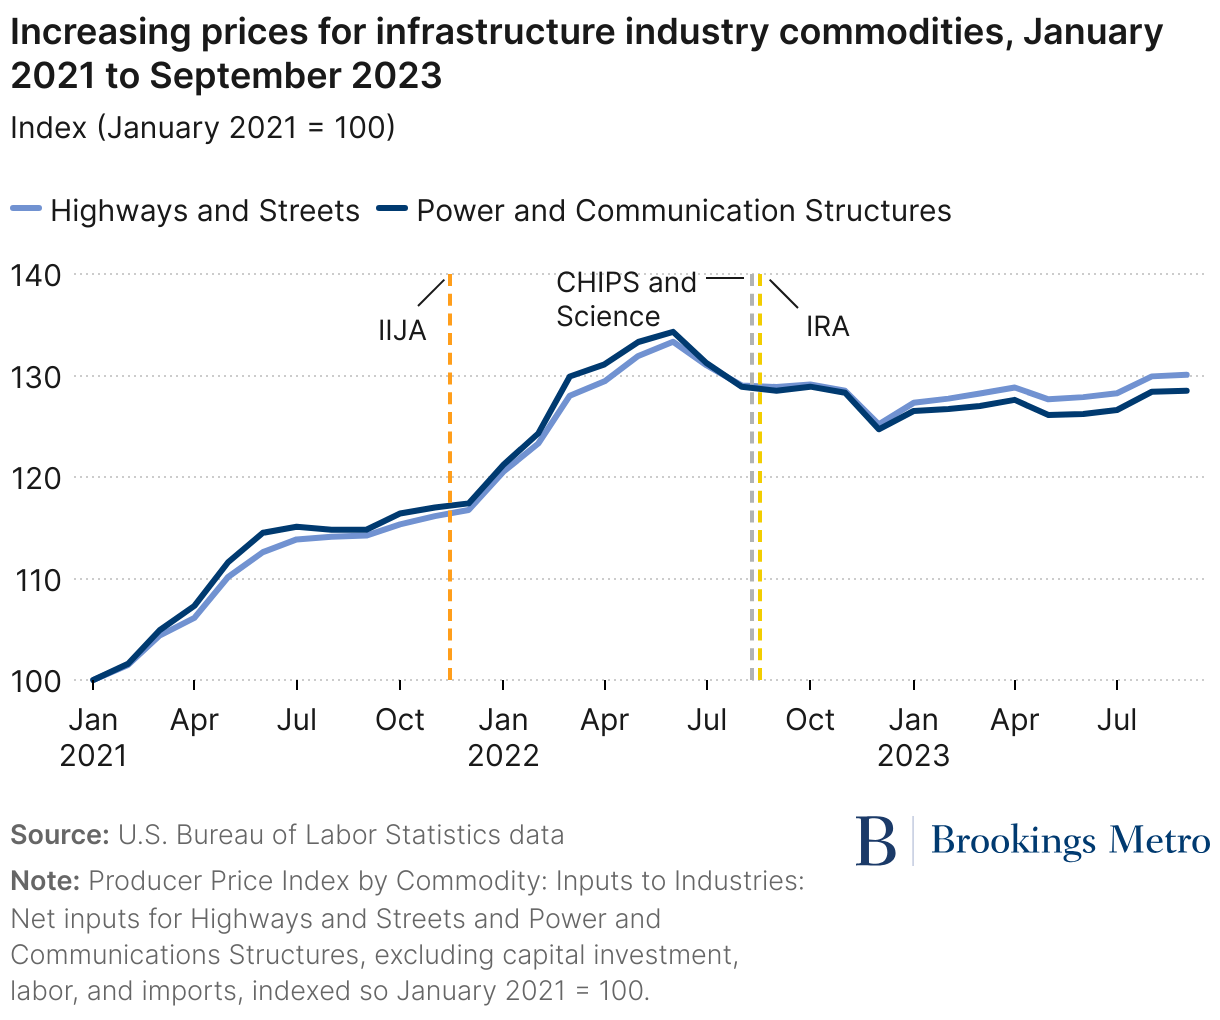
Workers’ increasing compensation is just one component of a costlier construction environment. Two infrastructure-specific commodity indexes within the Producer Price Index that count material inputs in the roadway, energy, and communications industries are both up at least 28% from January 2021 to September 2023. That’s effectively 50% higher than growth in the Consumer Price Index (17.1%) over the same period. Meanwhile, higher interest rates make borrowing more expensive than at the time of IIJA’s passage. Combined, these two factors likely won’t stop current projects; instead, they’ll reduce the number of total projects that can be constructed using IIJA funds.
Even in the face of these economic headwinds, localities, states, and the Biden administration won’t stop implementing the law. Recipients of formula funds will continue to convert federal awards into shovels in the ground. Federal agency staff will continue to accelerate their administration of competitively awarded programs. And there will be plenty of more awards to build passenger rail corridors, make streets safer, address sewer overflow, manage orphaned oil wells, and grow digital equity. The sheer volume of opportunities will test applicants’ capacities to win federal awards. And from the federal side, officials must continue to pursue transparency to build trust with the public and be ready to respond to calls for accountability.
President Joe Biden was right when he announced the beginning of an infrastructure decade—and we’re still in the opening stages. America’s march toward a grand rebuild continues.
Author

The Brookings Institution is committed to quality, independence, and impact.
We are supported by a diverse array of funders. In line with our values and policies, each Brookings publication represents the sole views of its author(s).