In June 2025 we published a paper calling on Europe to increasingly sanction Russia’s shadow fleet, especially now that the United States’ stance on Russian sanctions is unclear. Since then, the EU and the U.K. have responded in dramatic fashion, with the EU announcing extensive additional sanctions as part of its 18th sanctions package—including sanctions on specific tankers and a sharply lower price cap on Russian crude—and the U.K. announcing additional sanctions in both June and July of this year.
Unfortunately, the U.S. has not joined these efforts to handicap the shadow fleet. The last sanctions imposed by the U.S. were on January 10, when the Treasury Department sanctioned 182 Russian-controlled ships in the final days of the Biden administration. As we showed in our paper, U.S.-based sanctions appear to be more effective at depressing shadow fleet activity than EU and U.K. ones, possibly due to greater fear of secondary sanctions. In this update, we look at activity in all Russian-controlled vessels that have been sanctioned so far, not just those in the shadow fleet. It appears that U.S. sanctions continue to substantially outperform EU and U.K. sanctions in terms of shutting down Russian-controlled ships, most likely because the fear of secondary sanctions from the U.S. is far greater (as anecdotal evidence of Indian ports turning away Russian ships suggests). This underscores how important it is for the U.S. to join the EU and U.K. sanctions push.
An update on US, EU, and UK sanctions efficacy
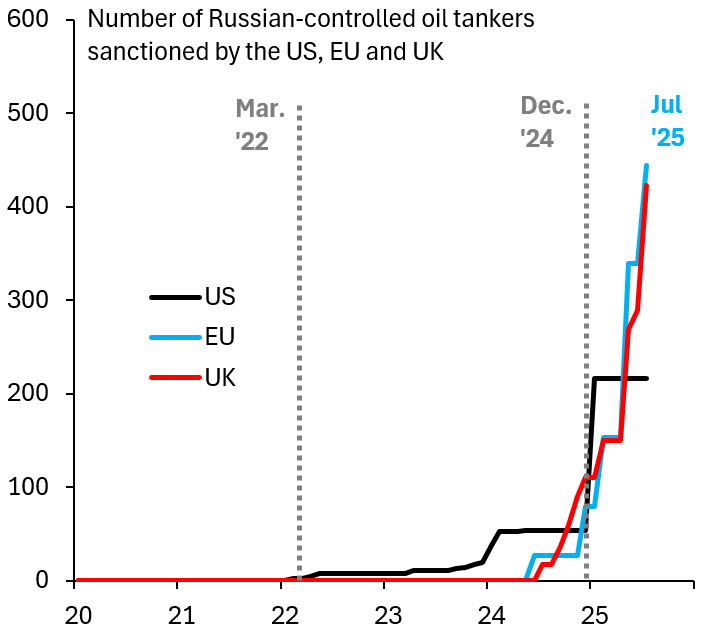
As of January 2025, the U.S. had sanctioned 216 Russian-controlled vessels, far above the 79 and 110 ships sanctioned by the EU and U.K., respectively. However, drastic action by the EU and U.K. dramatically changed that picture. The EU has now sanctioned 444 ships and the U.K. has sanctioned 423 vessels, while the U.S. remains at 216 after having failed to sanction a single tanker under the Trump administration (Figure 1). It is worth noting that these sanctions cover shadow fleet ships and ships that are owned and operated by Russia directly, such as Sovcomflot tankers. Whereas our June paper exclusively examined sanctions on the shadow fleet, here we adopt a broader perspective and consider all sanctioned vessels that carry oil out of Russian ports.
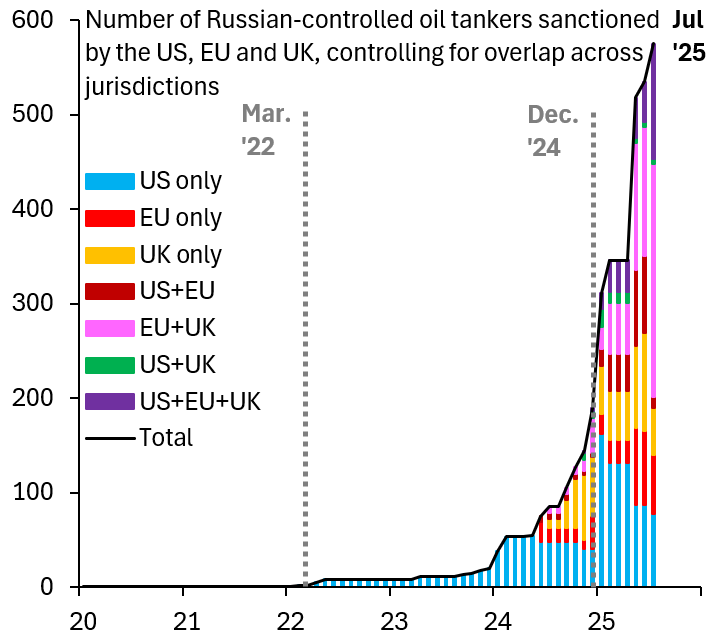
While the United States’ inaction is problematic, the aggressive sanctioning campaign by the EU and U.K. has helped to address the lack of overlap in sanctions across jurisdictions—a concern we highlighted in prior analysis. As shown in Figure 2, vessels sanctioned by all three jurisdictions (the U.S., EU, and U.K.) now number 122 (purple bars). This number was only 17 in January. The EU and U.K. have also increased sanctions coordination substantially. Ships sanctioned jointly by the EU and U.K. now number 247, far above the 23 ships in January. At the same time, the number of vessels sanctioned only by the U.S. has fallen to 77 now from 162 in January, because the U.S. has not matched others in widening its sanctions net.
Source: Author’s calculations
Source: Author’s calculations
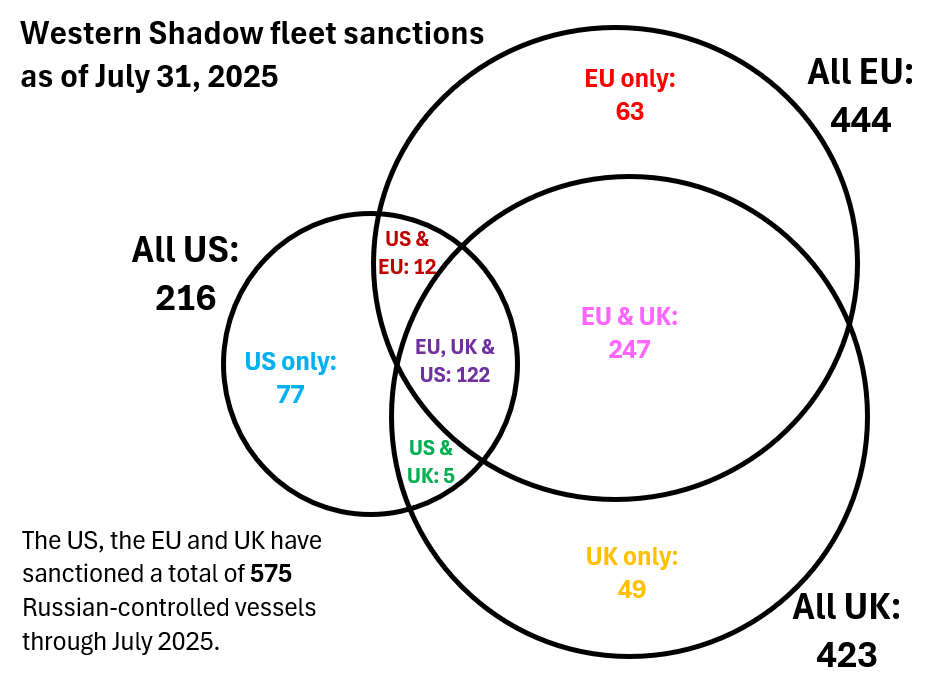
The Venn diagram in Figure 3 documents the extent of sanctions overlaps across these three authorities. There are still 77 vessels sanctioned only by the U.S., 63 sanctioned only by the EU, and 49 sanctioned only by the U.K. In the absence of further U.S. action, the EU and U.K. efforts have certainly improved the overlap, with 247 ships now jointly sanctioned. However, with 359 vessels sanctioned by the EU and/or the U.K. but not sanctioned by the U.S., it remains critical for the U.S. to join these sanctions efforts. Sanctioning these ships is an established, effective strategy to depress Russia’s oil revenue and may help bring Vladimir Putin to the negotiating table in good faith.
Source: Author’s calculations
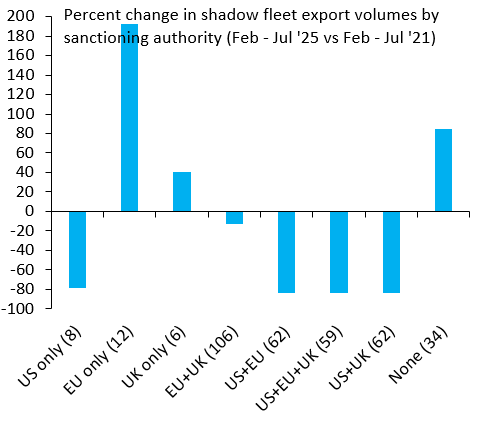
We now update our analysis on the efficacy of U.S., EU, and U.K. sanctions, reiterating that we now look at all sanctioned ships that are involved in the Russia oil trade as opposed to only those in the shadow fleet. Given that the sanctions have been imposed on an ongoing basis, starting immediately after the Ukraine invasion in February 2022, we compare activity in February to July 2025 to the same time period in 2021; that is, before any sanctions were levied. The first seven bars in Figure 4 correspond to the areas in the Venn diagram above, and the eighth indicates ships that remain unsanctioned. The numbers listed on the horizontal axis denote the number of ships that were active in each category in 2021. Across the various categories, groups of tankers sanctioned by only a single authority are small (12 or fewer tankers in all three cases), while groups of tankers sanctioned by multiple entities are larger (a minimum of 52 in our sample), suggesting that somewhat greater weight should be placed on comparisons of tankers sanctioned by multiple authorities.
Source: Bloomberg AHOY database, author’s calculations
Acknowledging that these correlations are not necessarily causal, the main result that stands out is that U.S. sanctions are associated with sharply lower shadow fleet activity than EU or U.K. sanctions. This is true with exclusively U.S.-sanctioned ships (of which there were only eight in the sample) and tankers sanctioned jointly by the U.S. and the EU (62 ships), the U.K. (62 ships), or all three jurisdictions (59 ships). Across the board, U.S. sanctions are associated with an 80% drop in activity, while unsanctioned ships (the category “none” in Figure 4) see a rise of similar magnitude. These results reinforce the importance of the U.S. joining EU and U.K. efforts to sanction the shadow fleet, as full coordination will help reduce Russian oil revenue and hopefully bring Putin to the negotiating table in good faith.
Authors


Related Content
-
Acknowledgements and disclosures
The authors thank Liam Marshall, a senior research assistant at Brookings, and Elijah Sheets, an undergraduate student at Vanderbilt University, for excellent research assistance.
The Brookings Institution is committed to quality, independence, and impact.
We are supported by a diverse array of funders. In line with our values and policies, each Brookings publication represents the sole views of its author(s).

Commentary
An update on the efficacy of sanctions against Russia
August 21, 2025