The air is thick with rhetoric on poverty, opportunity and inequality. Politicians on both sides are lamenting the state of the American Dream. Too often, though, phrases trump facts. My colleague Ron Haskins used his testimony to the House Budget Committee to offer five cold, hard facts to inform the debate. Here they are, with accompanying graphs:
1. Government spending on poor and low-income families has increased almost every year for five decades. Since 1980, spending has tripled as measured on a per person in poverty basis in constant dollars:
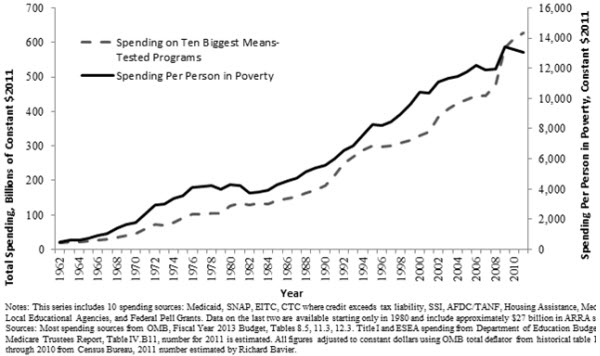
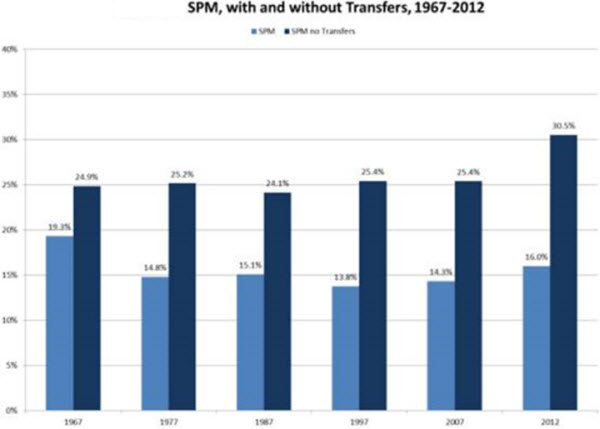
2. Government spending focused on poor and low-income households cuts the poverty rate by about half (using an appropriate measure of poverty). Government spending on these programs and the Unemployment Compensation program prevented poverty from increasing during the most severe recession since the Great Depression:
3. When government benefits are counted at their full value, households all along the income distribution, including those in the bottom 20 percent, enjoyed increased income between 1979 and 2007:
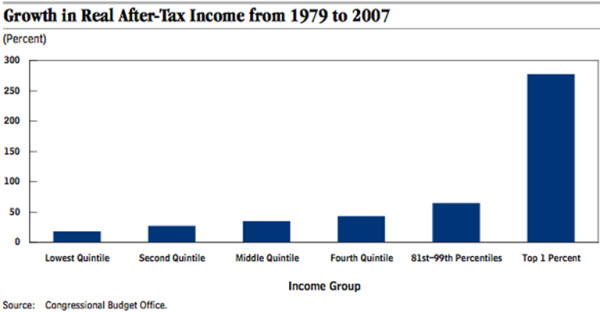
Source:
CBO. “Trends in the Distribution of Household Income Between 1979 and 2007
”
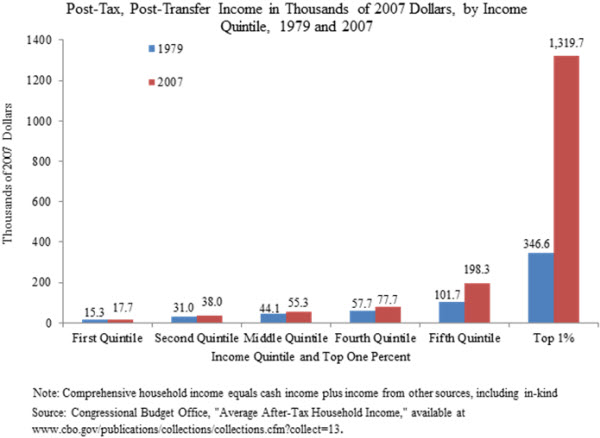
4. There were bigger increases in income at the top of the income distribution between 1979 and 2007, driving up income inequality. By far the biggest increase in inequality is between the top and the rest of the distribution:
5. Claims that intergenerational income mobility has slowed down in the U.S. are false; the U.S. has less income mobility than many European nations, but mobility has remained constant over the past four decades or so:
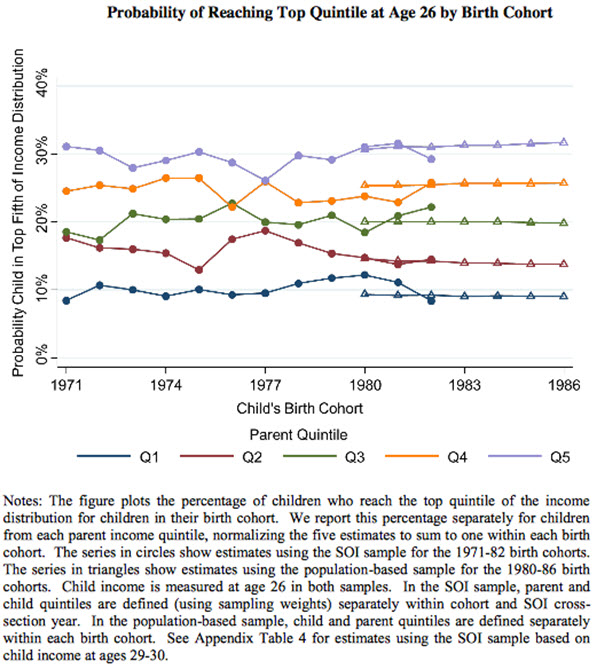
Source: Chetty et al. 2014. “
Is the United States Still a Land of Opportunity? Recent Trends in Intergenerational Mobility
.” NBER Working Paper No. 19844
The Brookings Institution is committed to quality, independence, and impact.
We are supported by a diverse array of funders. In line with our values and policies, each Brookings publication represents the sole views of its author(s).



Commentary
5 Facts on Poverty, Inequality and Mobility
February 7, 2014