The U.S. is sharply divided by race, not least in terms of the opportunities for children—a point this week’s report from the Annie E. Casey Foundation vividly shows. At every life stage, there are gaps between kids of different colors.
The U.S. Measures Poverty….
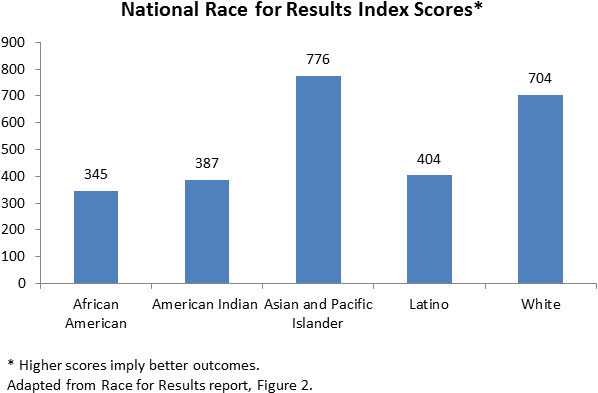
But perhaps the most important contribution of the report is its new yardstick, a Race for Results Index. The U.S. poverty figures published by the Census Bureau typically act as a catalyst for a public debate over American poverty. Academics release new papers on the roots of the problem. Policymakers use it as an opportunity to unveil new antipoverty proposals. Columnists comment on the progress we’ve made and activists point to how far we need to go. The report keeps poverty issues visible and relevant to policymakers and the public.
…So Why Not Opportunity?
Social mobility is, like poverty, a pressing national concern. Intergenerational mobility is lower in the United States than many comparable countries, and mobility trends have stagnated for decades.
But processes for systematically tracking mobility are underdeveloped. To be sure, academics have published volumes on mobility in the United States. But opportunity doesn’t have its own annual progress report. There is no official mobility measure to sting the public conscience.
The Race for Results Index: A First Step
Casey’s Race for Results Index takes an important step towards addressing this need, adding to other efforts like Opportunity Nation’s opportunity index. In particular, the Casey index combines a series of important opportunity indicators—including preschool enrollment rates, K-12 math and reading test scores, and teen pregnancy rates—into a single broad measurement of opportunity that can be used to track opportunity trends at the state and national level.
There are at least three things to like about this index:
- Life Cycle Approach: The index adopts a life-cycle framework that measures opportunity at many of the key life stages, including circumstances at birth, childhood development, adolescence, and early adulthood. (Full disclosure: the selection of indicators was partially informed by our own Social Genome Model.)
- Geographic Sensitivity: The index can provide snapshots of mobility at the state-level; important, since we know intergenerational mobility varies substantially across U.S. geography. The index, which can be disaggregated by state, accounts for some of this variation and can, in theory, become an important tool for state policymaking.
- Future-Proofed: Because the indicators used to build this index are regularly collected in every state, the Race for Results Index can (and will) be updated to track state and national progress.
What Next?
The Race for Results Index is an important step towards greater awareness of and accountability for our nation’s mobility problems. But more is needed, from governments at every level. If policy-makers are to get serious about improving social mobility, they need new official measures, a new “dashboard” of leading mobility indicators, and new agencies. This is an argument we’ll be developing in a report on an Office of Opportunity, within the next couple of weeks: watch this space.
The Brookings Institution is committed to quality, independence, and impact.
We are supported by a diverse array of funders. In line with our values and policies, each Brookings publication represents the sole views of its author(s).


Commentary
Measuring the Racial Opportunity Gap
April 4, 2014