Policy makers at all levels, federal and state and local governments, are depositing great faith in innovation as a driver of economic growth and job creation. In the knowledge economy, universities have been called to play a central role as knowledge producers. Universities are actively seeking to accommodate those public demands and many have engaged an ongoing review of their educational programs and their research portfolios to make them more attuned to industrial needs. Technology transfer is a function that universities are seeking to make more efficient in order to better engage with the economy.
By law, universities can elect to take title to patents from federally funded research and then license them to the private sector. For years, the dominant model of technology transfer has been to market university patents with commercial promise to prospect partners in industry. Under this model, very few universities have been able to command high licensing fees while the vast majority has never won the lottery of a “blockbuster” patent. Most technology transfer offices are cost centers for their universities.
However, upon further inspection, the winners of this apparent lottery seem to be an exclusive club. Over the last decade only 37 universities have shuffled in the top 20 of the licensing revenue ranking. What is more, 5 of the top 20 were barely covering the expenses of their tech transfer offices; the rest were not even making ends meet.[i] It may seem that the blockbuster patent lottery is rigged. See more detail in my Brookings report.
That appearance is due to the fact that landing a patent of high commercial value is highly dependent on the resources available to universities. Federal research funding is a good proxy variable to measure those resources. Figure 1 below shows side by side federal funding and net operating income of tech transfer offices. If high licensing revenues are a lottery; then it is one in which only universities with the highest federal funding can participate. Commercial patents may require a critical mass of investment to build the capacity to produce breakthrough discoveries that are at the same time mature enough for the private investors to take an interest.
Figure 1. A rigged lottery?
High federal research funding is the ticket to enter the blockbuster patent lottery
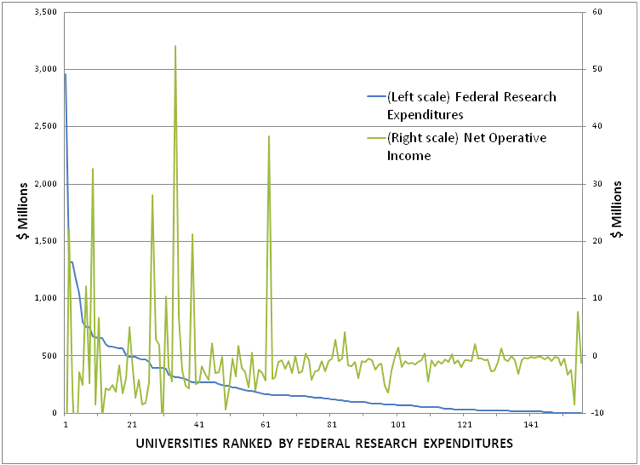
Source: Author elaboration with AUTM data (2013) [ii]
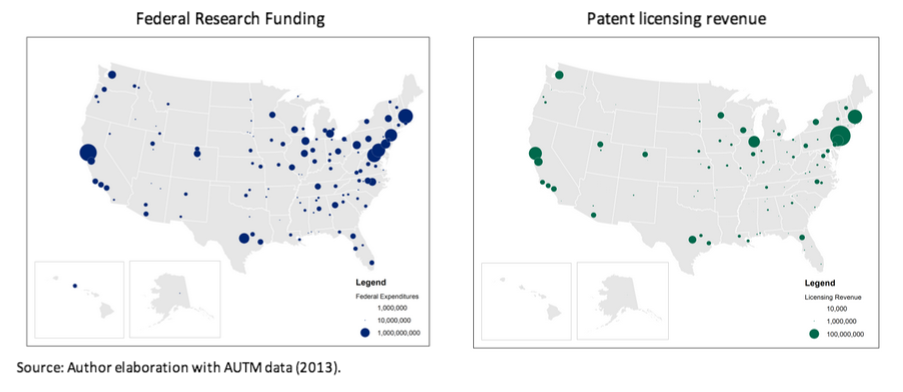
But now, let’s turn onto another view of the asymmetry of resources and licensing revenues of universities; the geographical dimension. In Figure 2 we can appreciate the degree of dispersion (or concentration) of both, federal research investment and licensing revenue, across the states. It is easy to recognize the well-funded universities on the East and West coast receiving most of federal funds, and it is easy to observe as well that it is around the same regions, albeit more scattered, that licensing revenues are high.
If policymakers are serious about fostering innovation, it is time to discuss the asymmetries of resources among universities across the nation. Licensing revenues is a poor measure of technology transfer activity, because universities engage in a number of interactions with the private sector that do not involve patent licensing contracts. However, this data hints at the larger challenge: If universities are expected to be engines of growth for their regions and if technology transfer is to be streamlined, federal support must be allocated by mechanisms that balance the needs across states. This is not to suggest that research funding should be reallocated from top universities to the rest; that would be misguided policy. But it does suggest that without reform, the engines of growth will not roar throughout the nation, only in a few places.
Figure 2. Tech Transfer Activites Depend on Resources
Bubbles based on Metropolitan Statistical Areas and propotional to size of the variable
[i] These figures are my calculation based on Association of Technology Managers survey data (AUTM, 2013). In 2012, 155 universities reported data to the survey; a majority of the 207 Carnegie classified universities as high or very high research activity.
[ii] Note the patenting data is reported by some universities at the state system level (e.g. the UC system). The corresponding federal funding was aggregated across the same reporting universe.
The Brookings Institution is committed to quality, independence, and impact.
We are supported by a diverse array of funders. In line with our values and policies, each Brookings publication represents the sole views of its author(s).


Commentary
Technology Transfer: Highly Dependent on University Resources
March 4, 2014