Until recently, demographic indicators such as domestic and international migration, as well as fertility, have shown little signs of reviving from the doldrums of the Great Recession and its aftermath, despite upturns in economic indicators. This appears to be changing, according to recently released census statistics updating national and state demographic dynamics through 2015.
A key piece of evidence is what looks to be a renewed migration to the nation’s Sun Belt states. The sizeable migration shifts from the states in the Snow Belt (Northeast and Midwest) region to the Sun Belt (South and West) region over the 2000-2006 period tapered off noticeably during the mortgage meltdown and recession years. Specifically, previously fast-growing states like Nevada, Florida, and Arizona experienced sharp slowdowns in migration and in the case of the former two states, actual out-migration for some of these years. Following the recession, signs of a resurgence were scant.
But the updated statistics through 2015 tell a different story. First they show a noticeable expansion of Sun Belt migration gains observed in the previous year. The Sun Belt states gained well over one half million migrants in 2014-2015, coming close to matching the 600,000 Snow Belt to Sun Belt migration peak in 2004-2005.
Leading the way in this exchange was Florida which gained 202,000 net migrants last year alone—leading all states in domestic migration gains for the first time since the years 2000 to 2005. After that period, Florida experienced a rollercoaster migration pattern from a net in-migration of 267,000 in 2004-2005 to net migration losses from 2007-2009; inching back up to the 100,000 range between 2010-2013, and 137,000 in 2013-2014. Similar but less extreme U-turns were taken by most of the biggest Sun Belt migration gainers which include Texas, Colorado, Arizona, South Carolina, North Carolina, Oregon, and Georgia, each of which received more migrants last year than the year before (See Table).
On the other side of the coin are mostly Snow Belt states like New York, which followed the opposite of Florida’s U-turn. When the Sun Belt in migration was peaking New York experienced its biggest migration losses—over 200,000 migrants annually from 2003 to 2006. After the recession, out movement from New York declined over time to 85,000 in 2010-11 with subsequent increases in losses to over 150,000 in the last two years.
New Jersey, and to a lesser extent, Ohio and Michigan followed similar patterns. And so did California. Though a Sun Belt state, California shares with several Eastern coastal states large urban areas and high costs of living which propel its migrants to relocate to other parts of the Sun Belt. Among the eight largest out-migrant states, New York, Illinois, California, New Jersey, Pennsylvania, Michigan, Ohio, and Connecticut all except one (New York) showed greater migration losses last year, than the year before.
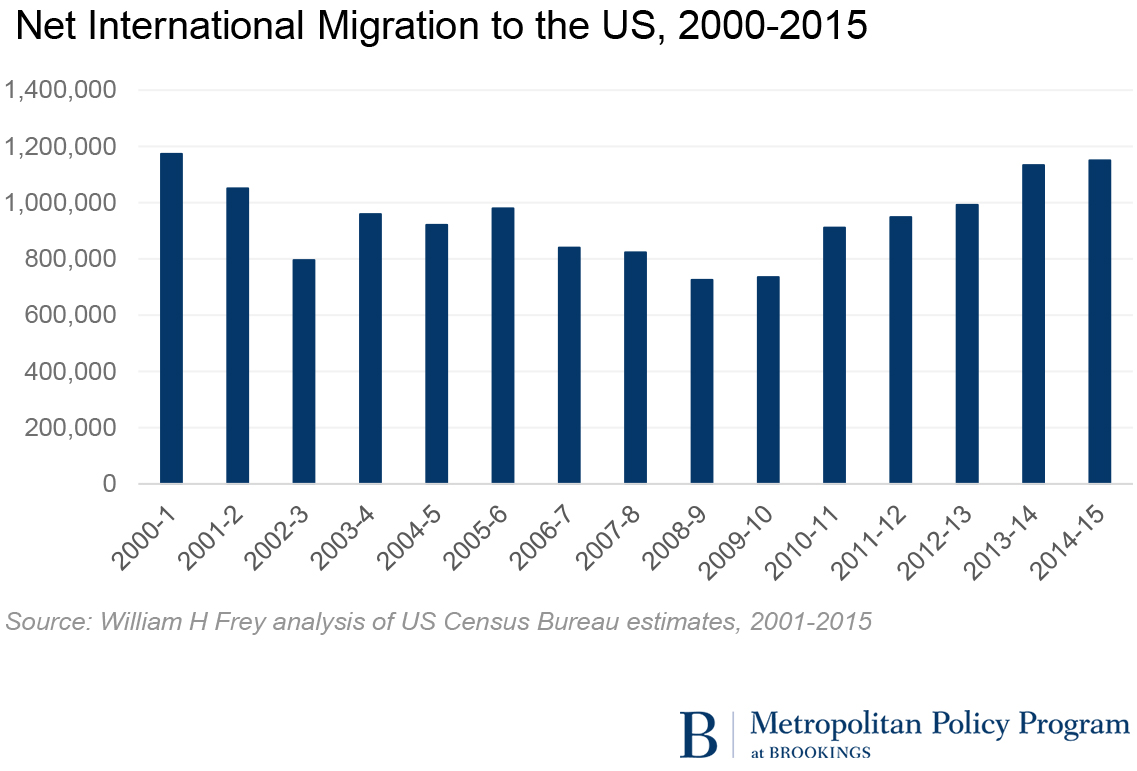
The large and increasingly pervasive Snow Belt to Sun Belt migration is one signal of renewed demographic vitality. Another is the recent rise in net international migration from abroad. As shown in Figure 2, international migration followed a similar path as domestic migration with a slowdown during the recession sinking to 725,000 net migrants in 2008-2009 from high levels of over one million annually in 2000-2002. Yet as with the domestic Snow Belt to Sun Belt flows, international migration has picked up substantially in the last two years. The net gain of 1.15 million in 2014-2015 is the largest since 2001. Sixty percent of these immigrants accrue to Sun Belt states with California, Texas, and Florida accounting for more than half.
Domestic migration shifts and immigration are two demographic dynamics which are showing clear signs of picking up to pre-recession levels. This is less the case for fertility. While the number of births in the United States increased modestly to 3,985,000 in 2014-2015, a gain of about 28,000 more than the prior year, the crude birth rate (as expressed per 1000 people) at 12.5 is lower than any year since at least 2000.
Nonetheless the migration components—both domestic and international—appear to have revived and, together, contributed to population gains for Sun Belt states which accounted for 90 percent of the nation’s growth in 2014-2015. At least as of now, some demographic indicators are showing renewed life, and the Sun Belt is benefiting.
Related Content


The Brookings Institution is committed to quality, independence, and impact.
We are supported by a diverse array of funders. In line with our values and policies, each Brookings publication represents the sole views of its author(s).


Commentary
Sun Belt migration reviving, new census data show
January 4, 2016