Income is the currency of most mobility research – but money is not all that matters in life. There is a long list of other goods in life, including education, wellbeing, trust, agency, interesting work, and so on. Like most mobility researchers, we focus on income because it does matter in itself; because it can be converted to many of the other goods; and because it provides a robust basis for measurement and comparison.
Schooling and Social Mobility
But the transmission of education advantage is also of great interest. Even if someone does not convert a higher level of education into higher income, they are still better off. They can choose more interesting jobs, even if they are not highly-paid. They have more knowledge of the world and possibly of themselves. Education is a good in its own right, not just as a ticket to a fatter paycheck.
So, intergenerational educational mobility matters. We don’t want a society where kids born poor stay poor; we also don’t want one where kids born to poorly-educated parents end up poorly educated themselves, while only the children of college graduates go to college.
The Inheritance of Education
Here is a quintile transition matrix for intergenerational mobility in educational attainment, based on PSID data:
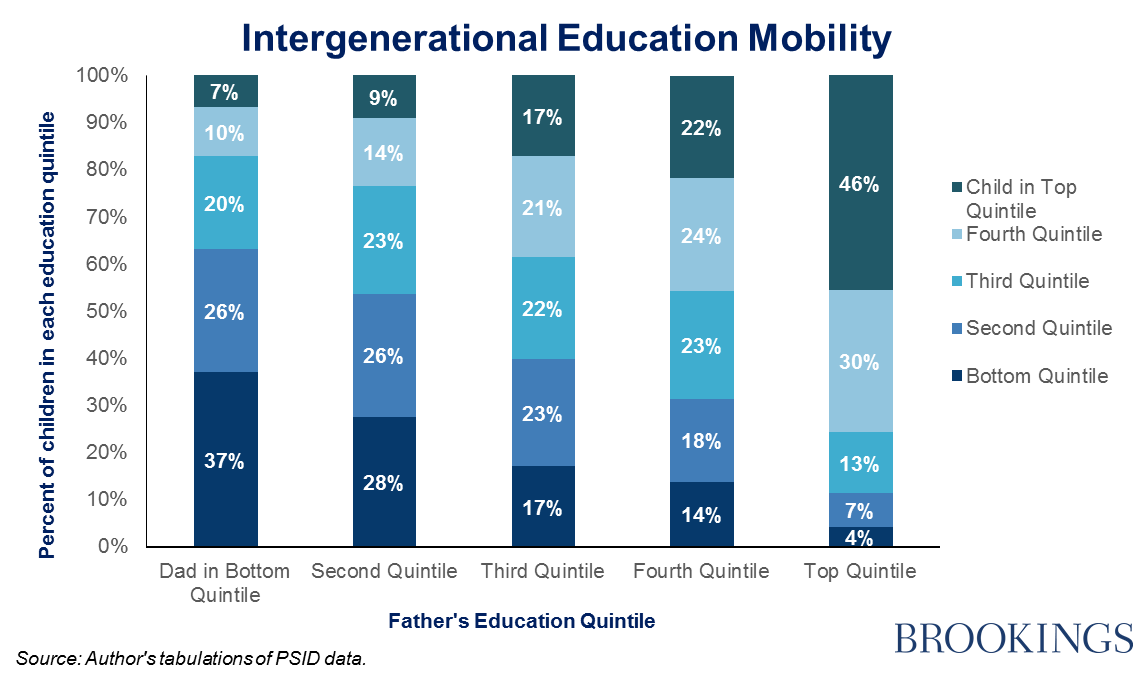
By splitting the distribution of educational attainment up into quintiles, we can see which rung children end up on for their own generation, compared to which rung their fathers were on in theirs. In general, educational attainment has risen. To make it into the top quintile of educational attainment, the fathers in our analysis (mostly born between 1920 and 1940), had to have over 14 years of education (at least an associate’s degree); whereas the children (born between 1950 and 1968) needed to have a 16 years of education (at least a bachelor’s degree) in order to achieve the same, top-quintile, status. (See the Technical Note below for a summary of our methodology.)
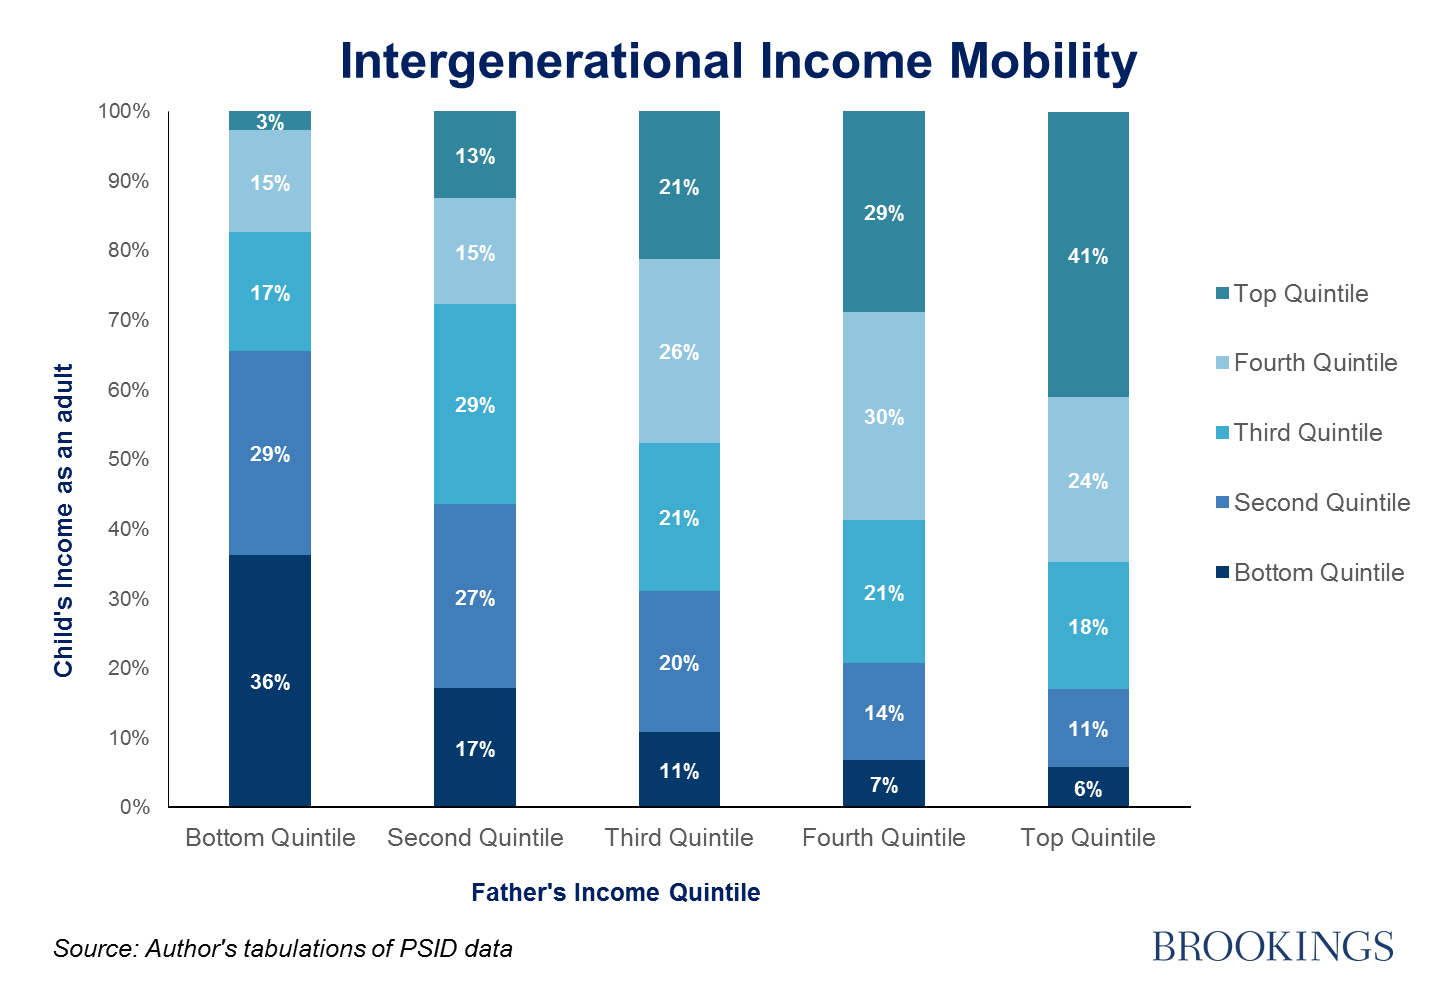
For comparison, here the matrix for income:
Educated Dad = Educated Kid
The two matrices look pretty similar – no surprise, given that income and education are tightly correlated. But in one respect there appears to be less mobility in terms of education: the replication of top-quintile status. Almost half (46%) the children of top-quintile parents ended up in the top education quintile themselves, and three in four (76%) stayed in one of the top two quintiles. The equivalent measures of ‘stickiness’ at the top for income are 41% and 65%.
This finding echoes research showing large, and possibly growing, gaps in educational attainment by social and economic background. The trend towards assortative mating – like marrying like – will likely strengthen the intergenerational transmission of high educational status. Of course education is one of main factors behind intergenerational income persistence, but it also troubling in its own right. The ethical demand for equality of opportunity in terms of education is even greater than for income. If a high level of education is effectively inherited, the ideal of meritocracy will move even further from our reach.
Technical Note
When education is split into discrete units (i.e., high school dropout, high school graduate, some college, and college graduate), transition matrices cannot provide a clear picture of mobility – individuals are not evenly distributed across the units making it difficult for a reader to eyeball what a “good” benchmark level of educational mobility would be. To create our quintiles, we smoothed out the education distribution by adding a stochastic noise value drawn from a uniform distribution of width 1, centered at 0. This does not change the absolute distribution of education.
From this, we were able to create education quintiles for both the fathers and children, where being in the bottom quintile indicates that a person had an educational attainment level lower than at least 80% of the population. Table 1 indicates the year ranges for each quintile. Note that these values have the stochastic value added, meaning that the true value of education for an individual could be either .5 above or .5 below the value in the table. This means that for the children, the bottom quintile likely contains all the HS drop outs along with some HS graduates, the second contains all HS graduates, the third contains some HS graduates and some with more than a HS diploma, the fourth contains some people with some college and a portion of college graduates, and the top quintile contains college graduates and those with more than a bachelor’s degree.

The Brookings Institution is committed to quality, independence, and impact.
We are supported by a diverse array of funders. In line with our values and policies, each Brookings publication represents the sole views of its author(s).
Commentary
The Inheritance of Education
October 27, 2014