It is now commonplace to say American inequality has reached a peak not seen since the roaring ‘20s. Though often repeated, the claim is flatly untrue under the most comprehensive—and meaningful—definition of family income.
In a widely circulated column, Adair Turner, former chairman of UK’s Financial Services Authority, told readers “The top 1 percent of Americans … have seen their incomes almost triple [since 1979], with their share of national income reaching 20 percent, a figure not seen since the 1920s.” Eduardo Porter recently informed New York Times readers that “The share of national income captured by the richest 1 percent of Americans is even higher than it was at the dawn of the 20th century.” Both writers also noted that U.S. households at the bottom or in the middle of the income distribution have seen almost no gain in income since the 1970s.
It is not hard to find income series that support Turner’s and Porter’s summary of the historical trends. Thomas Piketty and Emmanuel Saez have published statistics based on IRS records and the national income accounts suggesting that the percentage of cash market income received by top income recipients is near the peak seen in the late 1920s. (“Cash market income” consists of taxable wages, self-employment income, interest, dividends, and other cash income other than government benefits.) The Census Bureau publishes income distribution statistics based on households’ pre-tax cash incomes, that is, their cash market incomes plus the cash government benefits they receive.
The Piketty-Saez estimates confirm the claim that Americans in the top 1% receive a historically large share of pre-tax cash market incomes. The Census money income statistics show that, between 1979 and 2012, households in the middle of the income distribution saw small income gains while households in the bottom one-fifth experienced small losses in average incomes. Both income series have a venerable place in the nation’s economic statistics. The income tax statistics give us one of our oldest statistical series on the distribution and trend in U.S. incomes. The Census Bureau’s money income statistics, which date back to the mid-1940s, add to the information provided by IRS statistics by expanding the types of income that are included and providing information on a more broadly representative sample of Americans. (A sizeable but varying percentage of families do not file income tax returns, while nearly all households can be interviewed in the Census Bureau’s annual income survey.)
A notable problem with both the IRS income series and the Census Bureau’s money income statistics is the omission of personal tax payments and noncash income items from the income measure. For example, neither income series includes food stamps, housing assistance to low-income families, or the free health benefits provided by companies to their employees and by the government to people enrolled in Medicare or Medicaid. The IRS income tabulation published by Piketty and Saez excludes all government transfer benefits, including cash as well as in-kind transfers.
An unfortunate side effect of these omissions is that an increasing percentage of the gross incomes received by Americans is excluded from the most commonly cited income measures. At the same time, the two income series miss the effect of shifting tax policy on family tax burdens. The Congressional Budget Office has tried to remedy these deficiencies by including most of the missing income items in a more comprehensive income definition. In addition, it has adjusted the income statistics to reflect size differences among households. It seems plausible to think a single-person household can live more comfortably on $40,000 a year than a four-person family. Household size has shrunk over time, so even if median household income has remained unchanged, the income available to support each household member has gone up. Finally, the CBO has made adjustments in households’ income to reflect the federal taxes they are expected to pay through social insurance contributions, personal and corporate income taxes, and excise taxes. (Unfortunately, the adjustments do not include the effects of state and local taxes.)
The CBO income measure is far from perfect, but it comes closer than the older income series to reflecting the spendable incomes of American families. If we define income to mean the annual resource flow available to a family to pay for its consumption, including health care, then the CBO income measure does a far better job than either the cash market income reported on families’ income tax returns or the Census money income measure. Instead of showing that the incomes of low- and middle-income families barely budged after the late 1970s, the CBO tabulations suggest that Americans in the bottom one-fifth of the distribution saw their real net incomes climb by almost 50%. Those in the middle fifth of the distribution saw their incomes grow 36%. Their after-tax income gains are nowhere near as large as those enjoyed by the top 1%, who saw their after-tax incomes triple, but they reflect a sizeable improvement in household net incomes. The estimated gains are also more consistent with our aggregate statistics on the overall trend in disposable income.
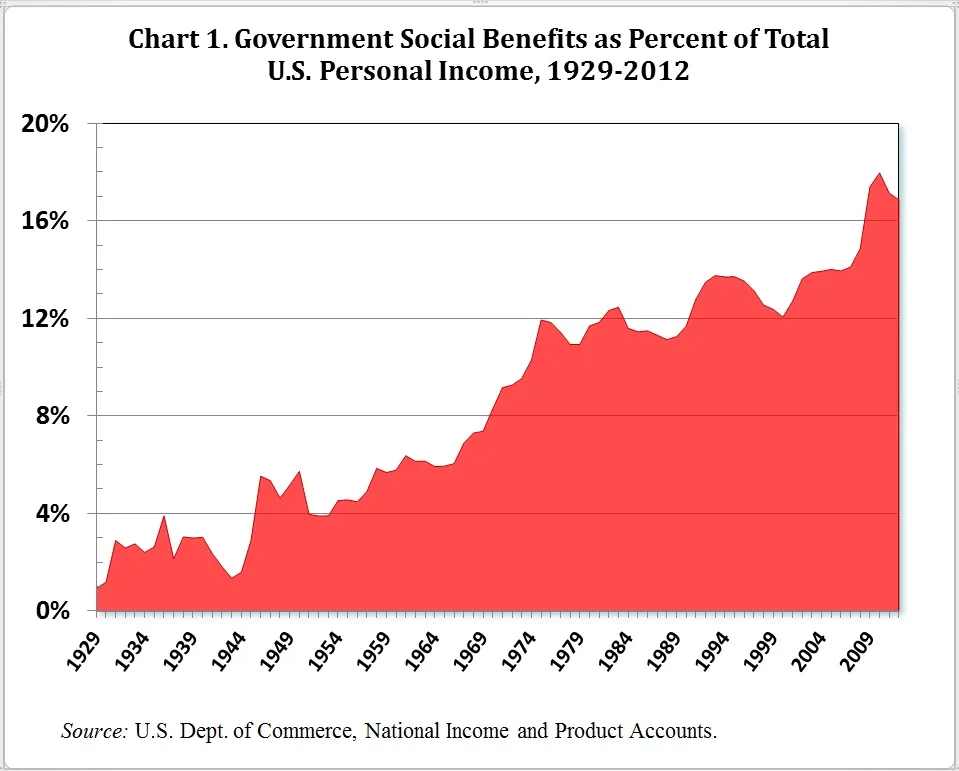
It is harder to evaluate longer term changes in American inequality under a comprehensive net income definition. So far as I know, no government agency or scholar has offered such estimates. It should be plain, however, that under a comprehensive income definition inequality is far lower today than it was in the late 1920s. In 1929 government transfer payments to households represented less than 1% of U.S. personal income. Fifty years later, in 1979, government transfers were 11% of personal income. By 2012 they were 17% of personal income.
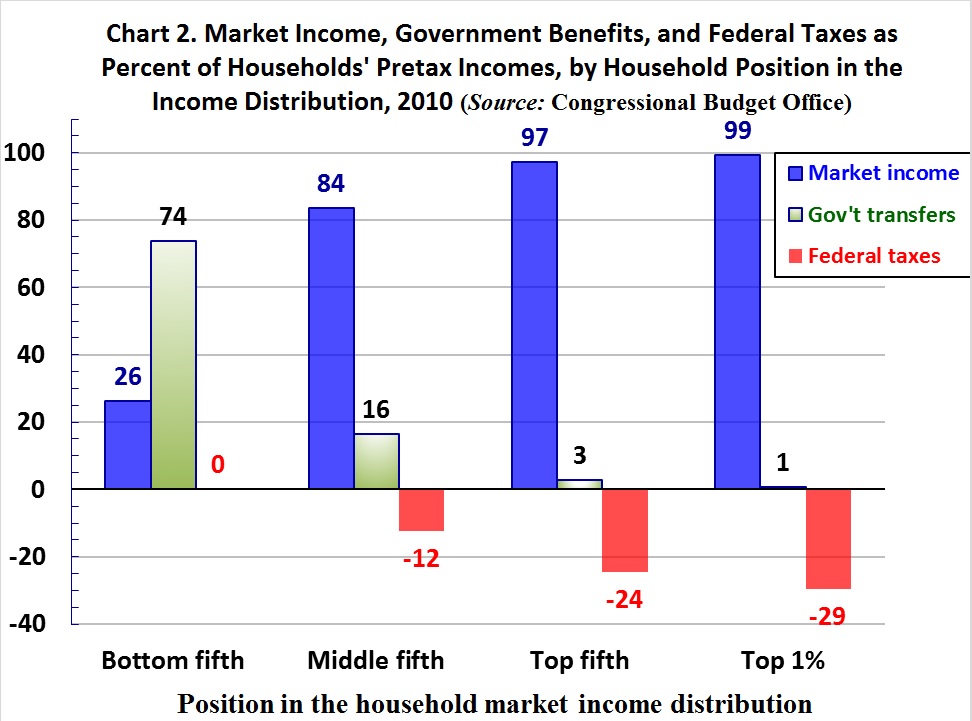
We have only one inequality estimate showing distributional trends back to the late 1920s, and that is the one calculated by Piketty and Saez. Their measure of income excludes government transfers. Everything we know about the distribution of government benefits suggests they narrow income disparities. They are a much more important component of income for low- and middle-income families than for the well-to-do, who derive nearly all their pre-tax incomes from the market. The CBO estimates show, for example, that when we rank households by their market incomes, households in the bottom one-fifth of the distribution receive almost three times as much government transfers as market income. Households in the middle fifth of the market income distribution receive about one dollar in government transfers for every $5 in market income. The households in the top 1% of market income recipients receive about $150 in market income for every $1 they receive in government transfers. These estimates are based on CBO estimates of 2010 incomes. We do not have comparable estimates for the late 1920s, but we know that government transfer benefits constituted less than 1% of personal income at that time. It follows that the final distribution of income—including tax payments and transfer benefits—was much closer to the distribution of market income. In the 1920s government transfers were far too small to have a noticeable impact on the distribution of final incomes.
Though most experts on income measurement are aware of the shortcomings of the standard income measures, it is surprising how little of this knowledge has seeped into popular discussion of inequality. Based on our best statistics it is almost certain that market income inequality, after shrinking in the four decades through 1970, began to grow again and has now reached a peak last seen in 1928. However, progressive income taxes and government redistribution are far more important in determining Americans’ incomes today than they were in the 1920s. To disregard the impact of transfers and progressive taxation on the distribution of income and family well-being is to ignore America’s most expensive efforts to lessen the gap between the nation’s rich, middle class, and poor.
Editor’s Note: This piece was originally published in RealClearMarkets.
The Brookings Institution is committed to quality, independence, and impact.
We are supported by a diverse array of funders. In line with our values and policies, each Brookings publication represents the sole views of its author(s).


Commentary
Has Rising Inequality Brought Us Back to the 1920s? It Depends on How We Measure Income
May 20, 2014