The Congressional Budget Office (CBO) long-term budget outlook generated a great deal of press about smaller near-term deficits and the impact of the Affordable Care Act on employment. What was not reported is that the CBO also provides a treasure trove of data which can help us divine the future of monetary policy.[1] In particular, the CBO’s latest estimates of U.S. potential growth, labor force participation, and the structural or natural rate of unemployment provide insights into the amount of slack in the economy, which is a key driver of Fed policy decisions.
The Federal Reserve Act states the following monetary policy objective: “The Board of Governors of the Federal Reserve System and the Federal Open Market Committee shall maintain long run growth of the monetary and credit aggregates commensurate with the economy’s long run potential to increase production, so as to promote effectively the goals of maximum employment, stable prices, and moderate long-term interest rates.” Thus changes in the Fed’s view of the potential growth rate of the economy can have a significant impact on the conduct of monetary policy. For example, if the Fed believes that the long-run potential of the economy is lower, then all else equal, monetary policy may not need to be as loose as the Fed originally thought. In addition, a lower rate of potential growth implies a lower equilibrium or neutral interest rate – that is the interest rate at which monetary policy is neither loose nor tight.
Unfortunately, the Fed does not provide detailed estimates of potential GDP from which we can approximate the amount of slack, or output gap, in the economy. Therefore, we must rely on organizations such as the CBO, whose long-run estimates are currently in line with the Fed’s. Figure 1 illustrates the CBO’s potential growth estimates from 2007 to 2023. In its latest analysis, the CBO lowered potential growth by an average of 0.1 percentage point per annum over the entire period. The CBO now estimates the U.S. economy’s potential in early 2013 was 0.5% lower than its previous estimate. These changes, along with recent upward revisions to GDP, translate into about 1% less slack than we thought a year ago (Figure 2).[2] While the output gap currently stands at a substantial 3.8% of GDP, these revisions support the Fed’s choice to taper policy and will become even more meaningful when the gap closes further.[3]
Figure 1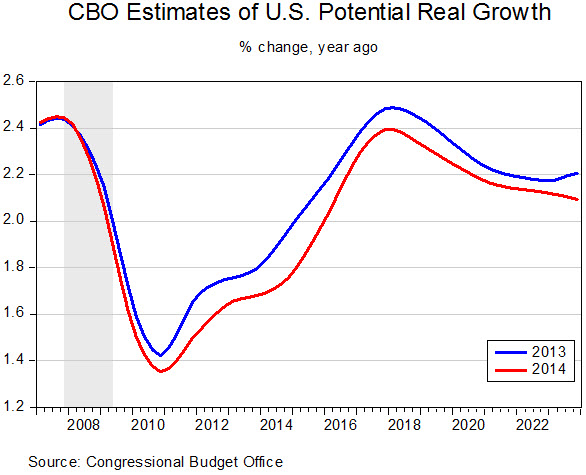
Figure 2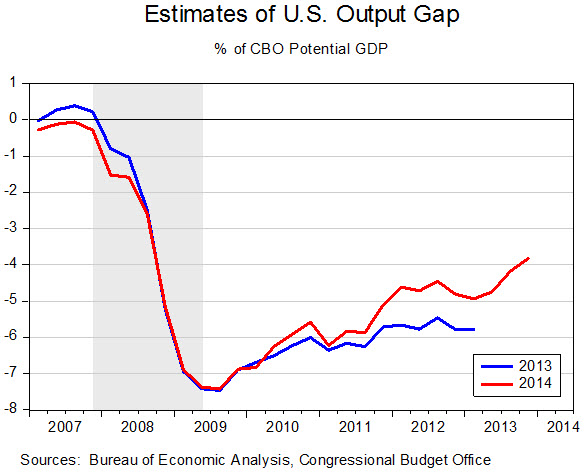
Do these new estimates change our view of future monetary policy? A simple, but highly effective way of transforming output gap estimates into monetary policy comes from the Taylor Rule, which is based on John Taylor’s 1993 paper Discretion Versus Policy Rules in Practice. It calculates a recommended federal funds rate based on only three variables: the amount of slack in the economy; the deviation of inflation from its target; and the neutral interest rate described above. While there is much disagreement about the exact definition of these variables and the appropriate weights on them, the modified Taylor Rule depicted in Figure 3 seems to do a very good job at modeling Fed behavior.[4]
Figure 3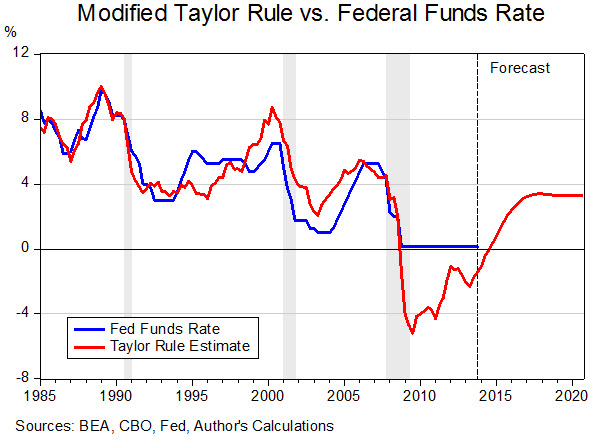
The modified Taylor Rule suggests that the fed funds rate should’ve been cut well below zero during 2008 and should remain negative today. Since it is very difficult to charge negative interest rates, the Fed came up with alternate policies, such as expansion of its balance sheet to initially ease up frozen credit markets in 2008-09, then to lower longer-term interest rates as well as encourage credit creation and risk taking today. Though the latest jobs report of weak payrolls but a lower unemployment rate present a confusing picture of the economy, the modified Taylor Rule currently recommends that since the economy is recovering and starting to eat into the spare capacity – as evident by the declining unemployment rate – interest rates should not be as negative as before. Does this mean that the Fed’s balance sheet should be shrinking or should they just be tapering?[5]
Using the latest FOMC Economic Projections (Table 1) in combination with the CBO’s estimate of potential, we can attempt to forecast monetary policy going forward (see the right hand side of Figure 3). The modified Taylor Rule forecasts that the Fed will start raising interest rates at the end of 2014, and the funds rate should be above 3% by the end of 2016. This forecast is substantially different from the expectation of the majority of FOMC members as well as the financial markets.
Table 1: Economic Projections of FOMC Members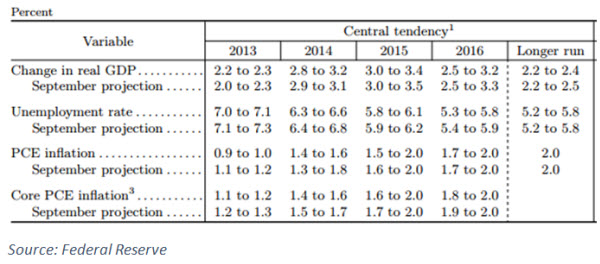
Figure 4 illustrates the FOMC’s expected path of Fed rate hikes – each dot represents an FOMC member’s view of the appropriate federal funds rate at year-end. Only two of the seventeen members of the panel believe the funds rate should be raised in 2014. While the views for 2016 are much more dispersed, only four of the seventeen members believe the funds rate should be at or above 3%.
Figure 4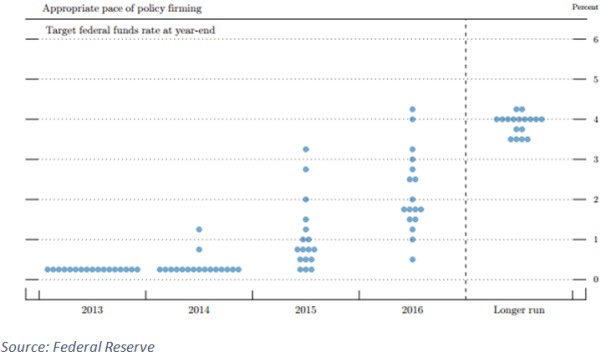
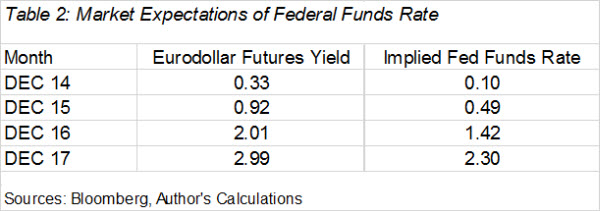
Table 2 estimates the financial market’s expectation of the federal funds rate based on the prices of Eurodollar futures contracts. These estimates are consistent with the views expressed by FOMC members. There is little chance that the Fed will raise rates in 2014 and only a couple of interest rate increases are priced in for 2015. By the end of 2016 the market expects the funds rate to be roughly 1.5% compared to the modified Taylor Rule estimate of over 3%. The market continues lag even in 2017 when the modified Taylor Rule indicates policy should’ve settled into neutral.
What accounts for the difference between the modified Taylor Rule, the FOMC and the markets? The Fed has a stated policy of being ‘looser for longer.’ Their view is that if they promise to keep the funds rate near zero for longer than they normally would, they are likely to bring longer-term interest rates down and thereby stimulate the economy further.[6] While I am extremely sympathetic to this type of response function, my concern is that the Fed will end up in a position in which it will have waited so long to tighten, that it will end up over-tightening, risking a recession.
Policymaking in the latter half of 2015 and 2016 will be particularly tricky. Based on the CBO’s potential growth estimates and the Fed’s economic projections presented in Table 1 above, by the end of 2016 the output gap will be less that 1%. At the same time, the FOMC expects the unemployment rate will be close to its longer run or natural rate of roughly 5.5% (Table 1). Despite this, the FOMC projects the funds rate will be well below its neutral level of roughly 4% (Figure 4).
Is this likely to occur? One possibility is that the Fed gives up on ‘looser for longer’ sooner than they or the market expect and move back to their historical pattern modelled by the modified Taylor Rule in Figure 3. The second is that they continue ‘looser for longer,’ have a hard time reversing this policy, and end up over-stimulating the economy. This could lead to spiking inflation and then ultimately a potentially deep recession engineered by the Fed to regain its credibility.
In my opinion, the more likely outcome is that the Fed finds itself behind the curve sometime in 2016 and ends up tightening aggressively, raising interest rates by potentially several percentage points over the course of 12-to-18 months. While this is consistent with the ‘looser for longer’ framework, it seems that neither the FOMC nor the financial markets expect this outcome in 2016 or 2017.[7] A surprise of this magnitude risks potential economic and financial market disruptions. Furthermore, given the long and variable lags between changes in monetary policy and its impact on the economy, it’s hard to gauge the effectiveness of policy when it is changing so rapidly. This creates a different danger that, as in the past, impatient market participants and even policy makers themselves question the efficacy of the recent aggressive policy. As a result, inflation becomes a concern and policymakers over-tighten, risking a recession.
Where does this leave us today? At present, even with CBO’s the downward revisions to economic potential, the amount of slack is significant and merits the Fed’s extremely loose policy stance. However, if the economy performs as the Fed expects over the next 18-to-24 months, the Fed will then face a difficult choice of whether to revert to its time tested Taylor Rule type tightening path or continue with a policy that offers higher potential rewards, but greater risk.
[1] For the full CBO report see http://www.cbo.gov/sites/default/files/cbofiles/attachments/45010-Outlook2014.pdf
[2] Unfortunately, because of comprehensive revisions to GDP which occurred last summer we cannot calculate an output gap for today using the 2013 CBO potential estimates. Thus the blue line in Figure 2 ends in 2013q1.
[3] The CBO’s downward revisions to potential are not necessarily new information to the Fed as the FOMC started ratcheting down its estimate of potential in September 2013.
[4] The rule described in Taylor’s paper is r = p + 0.5y + 0.5(p – 2) + 2; where r is the federal funds rate, p is the inflation rate and y is the output gap. The variant in Figure 3 is r = p + y + 0.5(p – 2) + potential growth. The output gap and potential growth come use the CBO estimates, while inflation is measured using the core PCE deflator, which is the Fed’s preferred measure of inflation.
[5] Unfortunately, there is not enough historical precedent to know how to calibrate balance sheet policy correctly. It’s not clear how much weight one should put on a change in the size of the balance sheet (the stock) vs. a change in the rate of expansion or contraction of the balance sheet (the flow). If you believe the stock only matters, then the taper shouldn’t have a big impact as the balance sheet is very large and still growing. If you believe solely in the flow, then the taper is very important as the size of the balance sheet is irrelevant. In my opinion the transmission channel is some combination of the stock and flow.
[6] For Janet Yellen’s description of this optimal control based policy see http://www.federalreserve.gov/newsevents/speech/yellen20120411a.htm
[7] See for example Figure 8 in the slide show attached to Janet Yellen’s speech above. Unfortunately the FOMC does not present forecasts for 2017, so we can only speculate from their language and the gradual tightening expected in 2016.
The Brookings Institution is committed to quality, independence, and impact.
We are supported by a diverse array of funders. In line with our values and policies, each Brookings publication represents the sole views of its author(s).


Commentary
The CBO Could be the Fed’s Crystal Ball
February 7, 2014