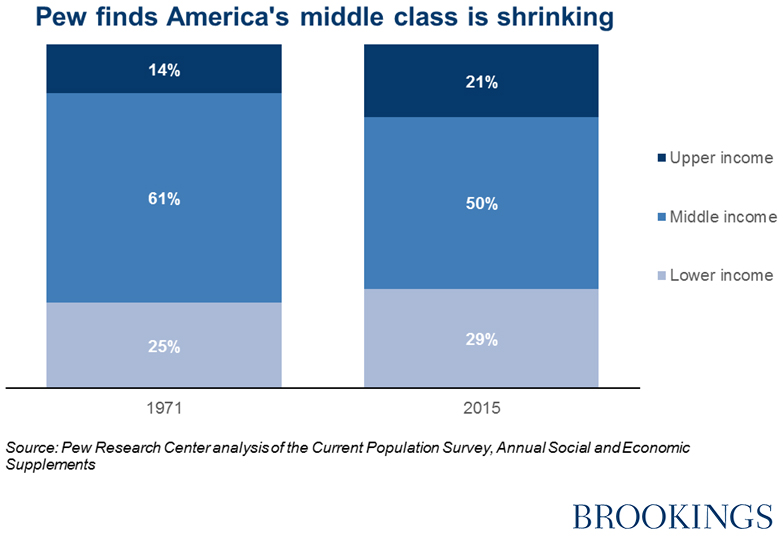
The condition of the American middle class is a near-obsession of politicians and policy wonks alike. Whenever the middle class is mentioned, words like ”struggling,” “stagnant,” and “squeezed” are rarely far away. A recent report from the Pew Research Center went a step further and declared that the middle class is actually shrinking. Of course, a great deal here depends on definitions. In their report “The American Middle Class is Losing Ground,” the authors define middle-class households as those earning between two-thirds and two-times the American median income, adjusted for household size. As the numbers living on incomes below and above these demarcation lines have grown, so the middle class has shrunk:
 There are many other ways of defining what it means to be ‘middle class’. One is to ask people to categorize themselves. Surveys from Pew show that almost nine out of ten Americans say they are part of the middle class, a number that does not appear to have changed much since the 1930s. Other scholars, including Alan Berube and Alec Friedhoff of Brookings have used the third (i.e. middle) quintile of the national income distribution to define the middle class. This allows them to compare different cities to the national distribution (see the interactive here). Defined this way, the middle class cannot shrink: 20 percent of us will always be in the middle quintile, whereas the decreasing size of Pew’s middle class reflects the stretching out of the income distribution as inequality increases. Each approach clearly has its drawbacks and advantages.
Where Pew’s middle-class lives
We took Pew’s definition of the middle-class and applied it to the American Community Survey. The results aren’t exactly comparable: Pew used the 2015 Current Population Survey Annual Social and Economic Supplement, which is conducted in March and asks people about their market income in the past 12 months; we use the 2014 ACS, which is conducted throughout the year and asks a similar question. But we use the same definition of the middle-class. In the 2014 ACS, we found that roughly 30% of households were upper income, 48% were middle income, and 22% were lower income. So where do the middle class, on Pew’s definition, live? The short answer: Utah. Using the 2014 American Community Survey, we calculate the size of the middle class in each of the 100 largest metro areas:
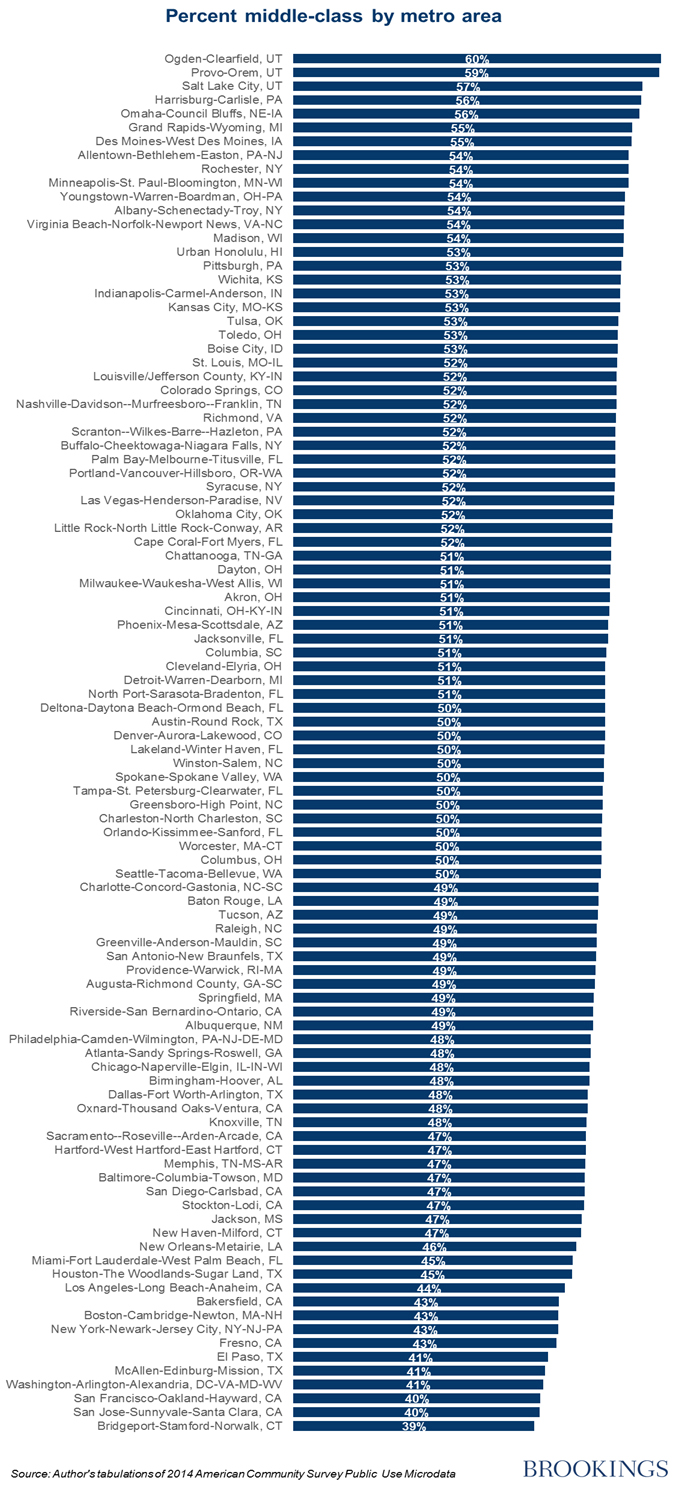
The top three cities, in terms of middle class size are all in Utah. Bumping along at the bottom are San Francisco, San Jose, and Bridgeport. Of course these are hardly poor cities, unlike some the others towards the bottom of the list, like McAllen and Bakersfield. This suggests that the size of the middle class varies for different reasons in different cities. Crudely put, some have too many rich people to have a large middle class, while other have too many poor. A closer look at the population share falling in the low, middle, and upper classes in the top 100 cities confirms this story:
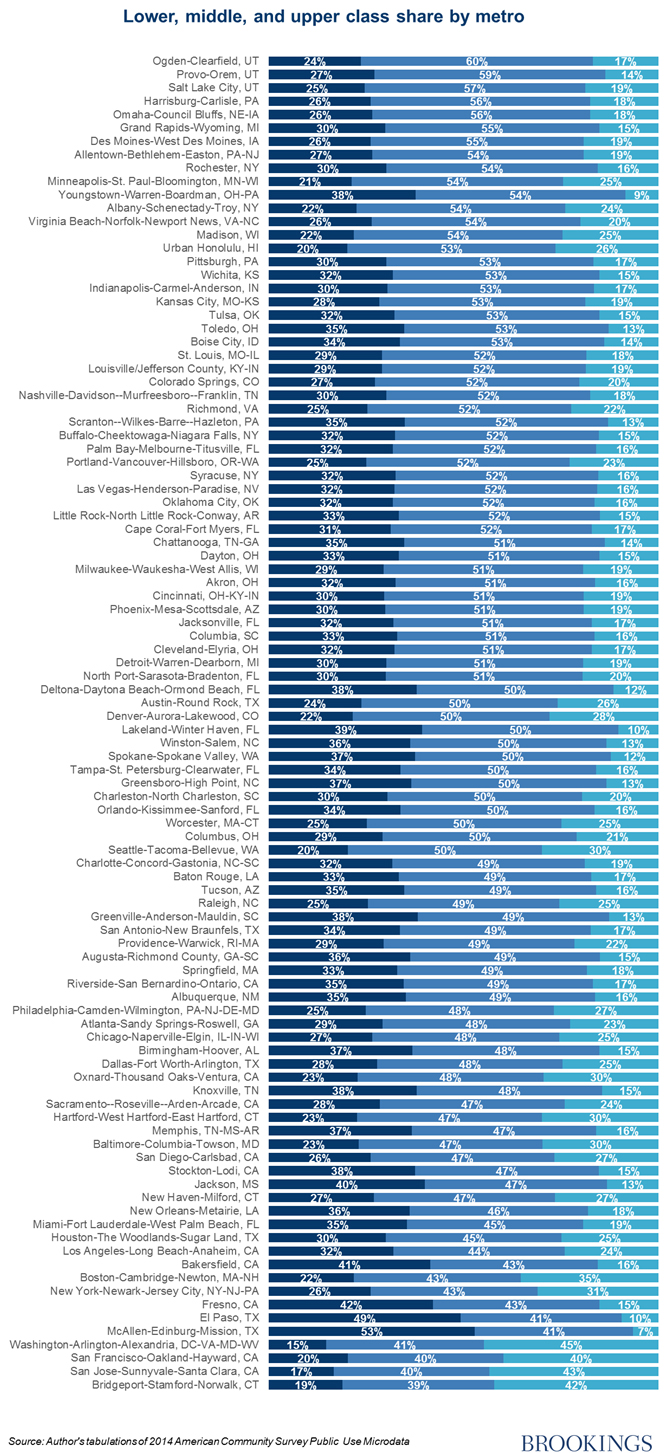
The four least middle-class cities are highly prosperous, with more than twice as many people in the upper class as the lower class. By contrast, the next three—McAllen, El Paso, and Fresno—have few folk in the upper class, but lots in the lower class category. At the top of the scale, the three Utah cities have slightly more people in the lower class than the upper class. This confirms the findings in a another recent paper by Berube and Nathalie Holmes, showing that income inequality is lowest in these Utah cities, but high and rising in cities like Boston, Miami, and San Francisco.
Be careful what you measure
Two implications can be drawn here. First, great care is needed in discussion of the size, state, or trajectory of the middle class, and indeed in debates over income inequality. Different definitions and measures can yield quite different results. This is not to say that one is necessarily better than the other—simply that it is important to be clear about the purpose of the exercise. Second, the variance in the economic distributions of America’s cities highlights the need for metro-level responses. As Berube and Holmes put it:
“Cities situated similarly on our simple inequality measure may have very different tools available to them for confronting inequality’s underlying drivers and implications. Indeed, reducing poverty and improving economic mobility may be more relevant goals for many cities than reducing inequality per se; Providence may actually need more high-income households in order to boost its tax base and improve the quality of its public services.”
There is world of difference between a city with a middle class that is shrinking because more of its citizens are escaping upward to the upper class, and one where increasing numbers are falling into poverty. Policy-makers at the city level need to understand their own particular issues with the distribution of income, and in particular with the distribution of opportunity.
Related Content

Related Books

Authors

The Brookings Institution is committed to quality, independence, and impact.
We are supported by a diverse array of funders. In line with our values and policies, each Brookings publication represents the sole views of its author(s).


Commentary
The American middle-class is still thriving in Utah
March 10, 2016