There’s no question that recent months have been great for drivers’ pocketbooks and wallets. From early 2014 to early 2015, retail gas prices dropped from a peak of $3.60 per gallon to a low of $2.20. In inflation-adjusted terms, gas was as cheap as during the mid-2000s.
But as summer travel season gets into full swing, gas prices are going up. This isn’t unusual, as gas prices always increase in the summer. The real question is whether it’s a summer blip or a sustained jump.
If it’s the latter, most consumers will have little choice but to adjust once more to higher gas prices. The question is how much that will affect spending, and if there’s anything we can do about it.
That analysis starts with elasticity of demand. Since so many of us drive to get to work, pick up our kids, shop for groceries—basically, to do anything—we have little choice but to buy the same amount of gas even when the price goes up. It’s also why we immediately either pocket the savings, as we’ve done this past year, or increase spending on other things when gas prices go down.
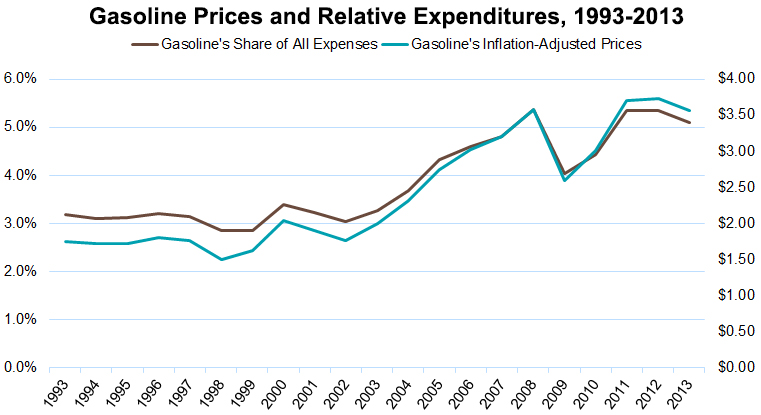
Using data from the Energy Information Administration and the Bureau of Labor Statistics, we can see just how inelastic our demand for gas is. There’s a close correlation between the retail price of gas and how much the average American family spends on it relative to all other expenses. Essentially, the two have moved in lock-step over the past 20 years.
Source: Brookings analysis of Energy Information Administration and Bureau of Labor Statistics data
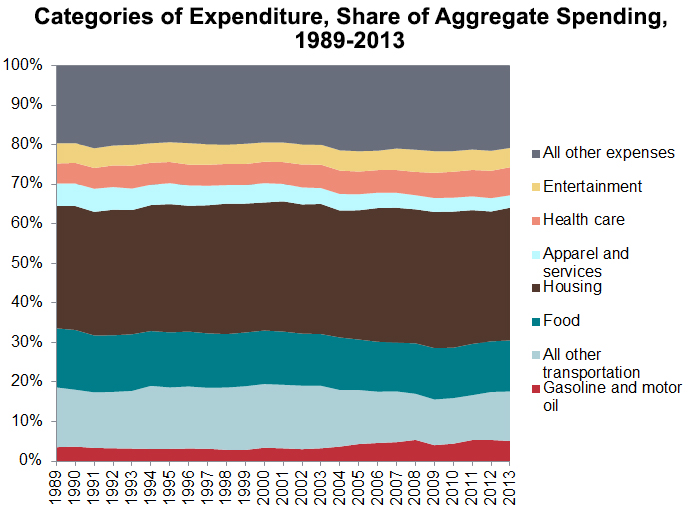
Yet while most Americans have little choice about how much they spend on gas, it’s still a relatively small portion of all household expenses. In the last 25 years of the Consumer Expenditure Survey, gas represents only about 5 percent of total household spending, putting it more in line with categories like entertainment and apparel versus major expenses like housing and food.
Source: Brookings analysis of Bureau of Labor Statistics data
Combined, these two charts tell us that gas prices matter—but only to a degree. There’s no question that sustained price increases will hit consumers, and they’re likely to crowd out more elastic categories like entertainment and apparel. But the real economic impact of more expensive gas can only be understood when compared to other, larger expense categories like housing.
At the same time, the significance of gas prices shouldn’t be understated, either. So finding ways to reduce demand—or increasing the elasticity of demand so that we can buy less when prices rise—is the most promising way to dull the impact of rising gas prices.
In this case, that means finding alternatives to driving. Growing broadband adoption gives people opportunities to work and shop from home. New transit investments, bike lanes, and denser development patterns can make people less reliant on cars for their trips. If we can figure out how to maintain economic activity with less driving, we can reduce relative expenditures on gas and clean the environment in the process.
Of course, this will be easier said than done. The country’s built an entire transportation and planning infrastructure around the car, hurting transit in the process and stretching distances between people and jobs. But as these charts show, finding those alternatives could provide the same economic jolt that lower gas prices did in 2014.
The Brookings Institution is committed to quality, independence, and impact.
We are supported by a diverse array of funders. In line with our values and policies, each Brookings publication represents the sole views of its author(s).


Commentary
What gas prices really mean to the American household
June 23, 2015