New TechTank Blog Posts Are Available Here
According to the recent report of nonpartisan analysts Kantar Media CMAG, ACA opponents have spent 450 million dollars on anti-Obamacare ads so far. Spending on negative ads outpaced positive ones by more than 15 to 1. This map shows the spending on negative ads in each state.
How Have Ads Impacted the ACA Enrollment in Different States?
I used the ACA enrollment data released by the Department of Health and Human Services, to calculate the ACA enrollment ratio as the number of enrollees divided by the total number of people who could have potentially enrolled in the ACA. This number includes the ones who were either uninsured or had purchased private insurance. Although more than 8 million Americans have signed-up to purchase health insurance through the marketplaces during the first open enrollment period, this nationwide number masks tremendous variation in participation across states. While the enrollment percentage in Minnesota is slightly above five percent, in Vermont, close to fifty percent of all eligible individuals have signed up for the ACA.
I also calculated the per capita spending on anti-Obamacare ads as the total amount of spending in each state divided by its population. By spending close to a dollar per resident, District of Columbia outpaced all of the fifty states in per capita spending on anti-Obamacare ads, yet over 11% of its eligible population signed-up for Obamacare.
The following plot compares the per capita spending on anti-ACA ads and the enrollment ratio in 49 states. I removed DC and Vermont since they had abnormally high ad spending or enrollment ratios.
Enrollment Ratio and Per Capita Anti-ACA Advertising
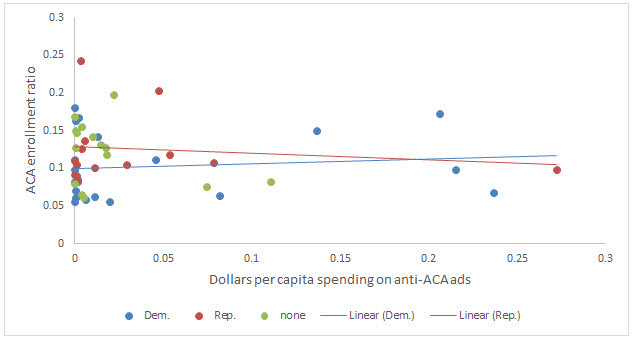
The blue dots represent the states in which Senate Democrats are up for re-election in 2014, while the red dots represent the states in which Republican Senators are running for re-election. The states in which no Senate midterm elections are held are shown in green.
The four states with the highest per capita spending on anti-ACA ads are Kentucky, Arkansas, Louisiana, and North Carolina. Interestingly, in all of these four states, the midterm Senate elections are expected to be very competitive. Although the volume of spending on anti-ACA ads is driven by the competitiveness of the Senate midterm elections and may be effective in reducing the votes for the targeted political figure, they may not necessarily reduce the popularity of the ACA. The blue and red lines show the association between the anti-ACA ads spending and the ACA enrollment ratio in states with Democratic and Republican Senators running for re-election. While the negative ads reduce the enrollment in red states, they have an opposite effect in blue states.
In fact, after controlling for other state characteristics such as low per capita income population and average insurance premiums, I observe a positive association between the anti-ACA spending and ACA enrollment. This implies that anti-ACA ads may unintentionally increase the public awareness about the existence of a governmentally subsidized service and its benefits for the uninsured. On the other hand, an individual’s prediction about the chances of repealing the ACA may be associated with the volume of advertisements against it. In the states where more anti-ACA ads are aired, residents were on average more likely to believe that Congress will repeal the ACA in the near future. People who believe that subsidized health insurance may soon disappear could have a greater willingness to take advantage of this one time opportunity.
New TechTank Blog Posts Are Available Here
The Brookings Institution is committed to quality, independence, and impact.
We are supported by a diverse array of funders. In line with our values and policies, each Brookings publication represents the sole views of its author(s).


Commentary
Have the Anti-Obamacare Ads Backfired?
July 9, 2014