Between 2010 and 2013, the unemployment rate fell by 23% in the United States. The poverty rate, we predict, will have fallen by only one percent over the same time period. That is, for a second year in a row, we expect no significant change in either the poverty rate for all persons or for children. Whether or not this prediction is accurate will be revealed on Tuesday, September 16, when the Census Bureau publishes its 2013 Annual Social and Economic Supplement (ASEC) to the Current Population Survey.
Disentangling poverty and unemployment
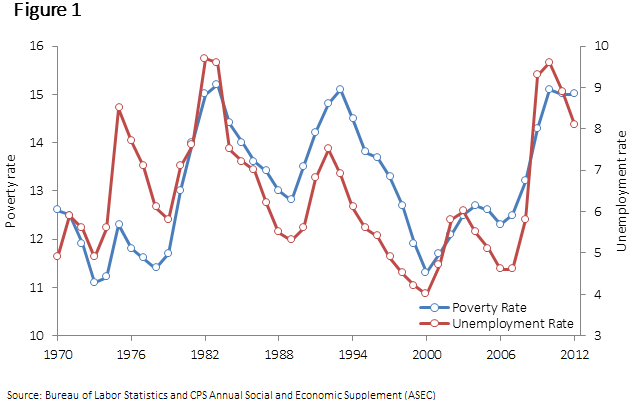
Historically, the poverty rate has moved with the unemployment rate. Since 1970, in fact, the official poverty rate has spiked during each recession. Intuitively, this makes sense—if you lose your job, then you lose access to a steady stream of income. When you find a new job—as people are wont to do in the recovery after a recession, your prospects improve. Nevertheless, as shown in Figure 1, despite the sharp decline in unemployment following the Great Recession, the headline poverty rate has remained at or near 15%.
Poverty in the United States as of 2013
Since 2009, the Center on Children and Families at Brookings has predicted the U.S. poverty rate in advance of the release of the official figure. For 2013, our estimates of the poverty rate for all persons and for children are 14.9% and 21.8%, respectively. Neither of these estimates represents a statistically significant change from 2012; the change itself falls within the Census Bureau’s margin of error.
As evidenced by these rates, poverty remains a harsh reality for many Americans. In real terms, a headline poverty rate of 14.9% translates to 47.0 million people—as many as are living in both New York and Texas combined. The children’s rate translates to 15.7 million children. In other words, as of 2013, about one in three people living in poverty in the United States was a child.
Projecting poverty forward
We use the empirically estimated coefficients of the effect of the unemployment rate on the poverty rate from Blank (2008) and forecasts of the unemployment rate from the CBO, OMB, and EIU to project the annual poverty rate for each year of the 2013-2024 time horizon. The shaded areas of Figure 2 and Figure 3 show the CBO’s unemployment forecast and our projections of the headline poverty rate and Supplemental Poverty Measure (SPM), respectively.
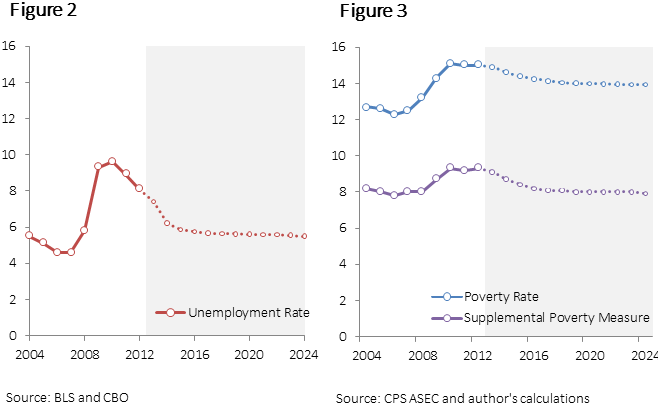
We predict that there will be a gradual decline in the headline poverty rate for the foreseeable future; however, we do not expect it to return to its pre-Great Recession level by 2024 despite the fact the unemployment rate is projected to do so. This finding reinforces the idea that there are other significant drivers of the poverty rate in addition to the state of the job market—specifically, the composition of families and the generosity of the safety net.
The safety net in action
As shown in Figure 3, during the Great Recession, the rise in the SPM, which includes noncash benefits and refundable taxes, was much less drastic than that of the headline poverty rate. Whereas the official poverty rate rose by 2.7 percentage points between 2006 and 2010, the SPM rose by 1.5 percentage points. Furthermore, we predict that, unlike the headline poverty rate, the SPM will return to its pre-Great Recession level by 2020.
Taken together, these two results suggest that we have done a reasonable job of supporting people with various forms of cash (tax credits) and noncash assistance (health care, housing, nutrition, child care) despite a severely depressed economy and an unprecedented lack of jobs. Whether these programs will be enough to fight the ongoing tide of demographic changes (e.g., more single parent families) is doubtful. Other efforts, such as using education and training to help young adults be more self-sufficient, will almost certainly be necessary.
The Brookings Institution is committed to quality, independence, and impact.
We are supported by a diverse array of funders. In line with our values and policies, each Brookings publication represents the sole views of its author(s).


Commentary
Poverty: It’s More than a Job Market Story
September 12, 2014