

The U.S. Department of Education recently released its annual report on the federal Pell Grant program, which provides detailed information about the program’s finances and who is receiving grants. The most recent report includes data from the 2013-14 academic year, and I summarize the data and trends over the last two decades in this post.
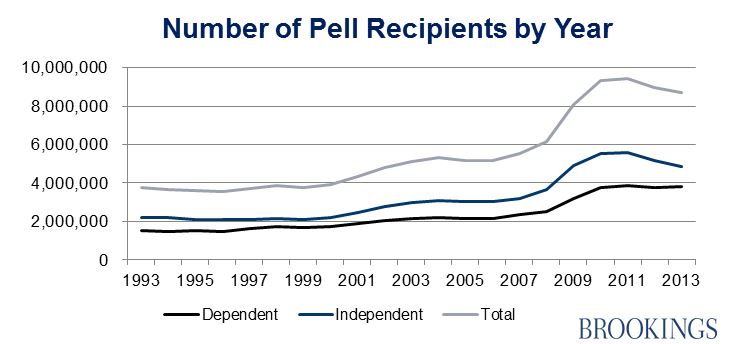
For the second year in a row, the number of Pell recipients fell, going from a peak of 9.44 million students in 2011-12 to 8.66 million in 2013-14. This drop in recipients is almost entirely due to students who are considered independent for financial aid purposes (typically students who are at least 24 years of age, are married, or have a child). The number of independent Pell recipients fell by 13% in the last two years (to 4.87 million), while the number of dependent Pell recipients fell by just 27,000 students to 3.83 million, as shown in the chart below.
Why has the number of Pell recipients declined over the past two years after such a sharp increase between 2008 and 2010? Two factors are at play. First, enrollment at vocationally-oriented colleges (primarily community colleges and for-profit colleges) increases during recessions as displaced workers choose to receive additional training instead of trying to find a job in an awful economy. When the economy gets better, more of these individuals go back to work and forgo college. Second, as the economy has improved, it is likely the case that some families that barely qualified for the Pell Grant during the recession no longer qualified after obtaining a better job.
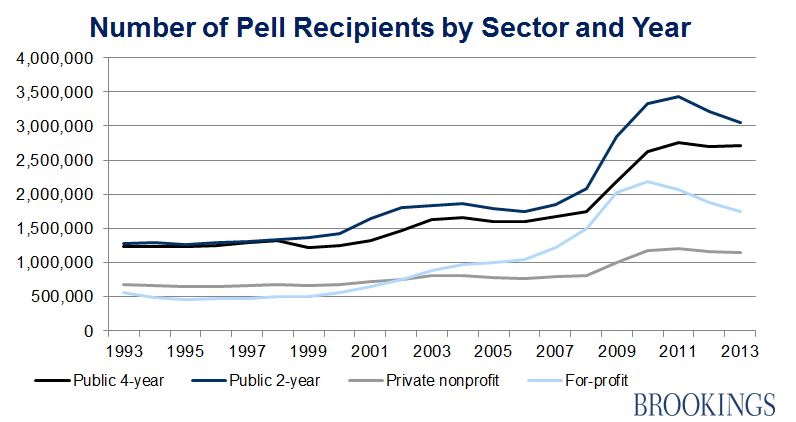
The next chart shows that the decline in the number of Pell recipients over the last two years is largely due to community colleges and for-profit colleges. The number of Pell recipients at community colleges has declined by 11 percent since 2011-12, while the number at for-profit colleges has declined by 20 percent since 2010-11 after more than doubling in the previous five years. This is consistent with enrollment at some of the largest for-profit chains cratering in the last few years due to both the colleges’ actions (such as the University of Phoenix enacting a trial period for students) and actions from regulators (as evidenced in the recent collapse of Corinthian Colleges).
Expenditures for the Pell Grant program declined for a third consecutive year, going from $35.7 billion (in nominal dollars) in 2010-11 to $31.5 billion in 2013-14. However, in inflation-adjusted dollars, Pell spending has still more than doubled since 2007-08.
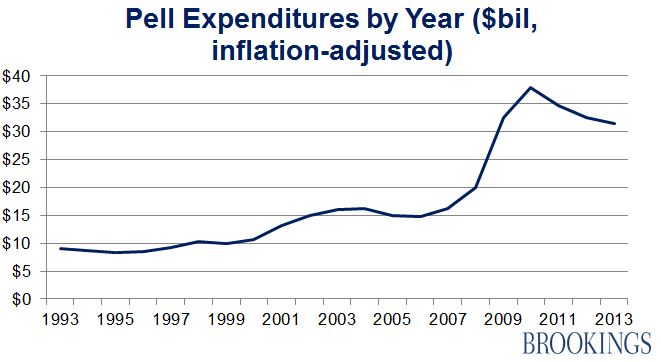
The big spike in Pell expenditures around 2009 was due to three factors. First, the start of the Great Recession both induced more students to enroll in college and resulted in more students with financial need who met the Pell Grant eligibility criteria. Second, changes to federal laws that took effect in 2009-10 increased the maximum Pell Grant by over $600 and allowed more students to automatically qualify for the maximum Pell Grant by increasing the income threshold (from $20,000 to $30,000) for an automatic zero expected family contribution. Third, students were allowed to receive a Pell Grant on a year-round basis instead of just two semesters during the academic year, driving up short-term costs but potentially helping students complete their studies quicker. In 2011, the year-round Pell provision was repealed and the income threshold for an automatic zero EFC dropped to $23,000 as cost-saving measures. Congress has shown bipartisan interest in allowing year-round Pell again, but changing the income threshold for an automatic zero EFC appears to be off the table for now.
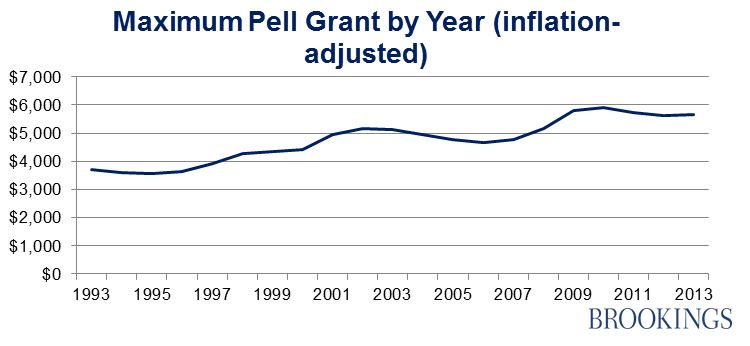
The final chart shows the maximum Pell Grant award (in inflation-adjusted dollars) between 1993-94 and 2013-14. Contrary to what many might expect, the maximum award has increased from $3,696 in 1993-94 to $5,645 today; the average award has also increased from $2,419 to $3,634. But the increase in the Pell Grant’s real value has not kept up with the increasing price of college in all sectors of higher education. As a result, its purchasing power has fallen by two-thirds since 1979.
For those who are interested in learning more about how much in Pell Grant revenue individual colleges receive, I highly recommend the Title IV program volume reports available on Federal Student Aid’s website. In addition to Pell Grant revenue, this site has information on student loan awards going back to the 1999-2000 academic year.
The Brookings Institution is committed to quality, independence, and impact.
We are supported by a diverse array of funders. In line with our values and policies, each Brookings publication represents the sole views of its author(s).