The mortgage interest deduction (MID) is one of the nation’s largest federal tax expenditures, allowing taxpayers whose total itemized deductions exceed the standard deduction to deduct interest on their primary residence or secondary home up to certain limits. Using zip-code level data on taxes and demographics, Benjamin Harris—a fellow in Economic Studies—and Research Assistant Lucie Parker examine characteristics of the MID in a new Urban-Brookings Tax Policy Center paper. Their findings include:
• Twenty percent of zip codes claim roughly half of the aggregate MIDs
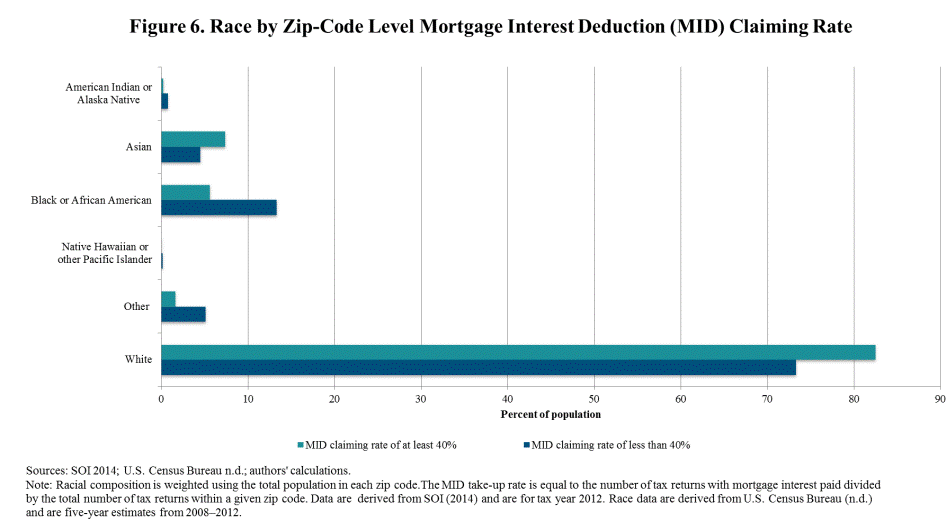
• Zip codes with high claiming rates tend to have disproportionately white, middle-aged, and married taxpayer
• Counties west of the Mississippi River and on the East Coast disproportionately benefit from the MID
The table below shows the top ten U.S. counties by share of taxpayers claiming the MID.
|
County, State |
MID Share |
County notes (pop. figures from 2013 unless otherwise specified) |
|
Douglas County, CO |
49.3 |
Douglas Co., pop. ~306,000, borders Denver’s south side and includes Castle Rock. According to the American Community Survey, this county has the highest median household income outside the East Coast, and the ninth highest nationally. |
|
Loudoun County, VA |
47.6 |
Loudoun Co. in Northern Virginia has a population of about 348,000; its largest town and county seat, Leesburg, has about 48,000 residents. Gen. George C. Marshall, Army chief of staff during World War II, owned a home here throughout and after the war. |
|
Forsyth County, GA |
46.3 |
Located northeast of Atlanta, Forsyth is the wealthiest county in Georgia. Its namesake, John Forsyth, was the 13th U.S. secretary of state, serving under Presidents Andrew Jackson and Martin van Buren. He represented the government in the 1841 Amistad case. |
|
Delaware County, OH |
46.2 |
Delaware County, one of the fastest growing in Ohio, sits on the northern side of Columbus and has a population just under 185,000. The nineteenth U.S. president, Rutherford B. Hayes (1877-81), was born in Delaware, the county seat. |
|
Calvert County, MD |
45.2 |
Calvert County runs along the western shore of the Chesapeake Bay, south of Annapolis. Roger Brooke Taney, chief justice of the United States from 1836 to 1864, was born here. He presided over the Dred Scott v. Sandford decision in 1857. |
|
Elbert County, CO |
44.9 |
With a population of about 23,000 (2010 Census), Elbert County is the smallest county in the top ten. It is due east of Douglas County. |
|
Kendall County, IL |
44.7 |
Kendall County, west of Chicago, had about 115,000 residents in 2010. According to the U.S. Census, from 2000 to 2010, it had the fastest population growth of any U.S. county. The Fox River runs through it. |
|
Scott County, MN |
43.8 |
Scott County is on the southwestern side of Minneapolis. According to U.S. Census data, the county experienced a 10 percent drop in household wealth in 2010. It is one of at least six U.S. counties named after 19th-century Army General Winfield Scott. |
|
Hunterdon County, NJ |
43.8 |
Hunterdon County in northwestern New Jersey had one of the lowest child poverty rates in 2011, per Census data. The son of famed aviator Charles Lindbergh was kidnapped here in 1932, and the “Trial of the Century” of Bruno Hauptmann for the crime transpired in Flemington, the county seat. |
|
Carver County, MN |
43.6 |
Immediately to the west of Scott County, Carver County has about 95,000 residents. In 1858, at his farm here, German immigrant Wendelin Grimm planted America’s first winter-hardy alfalfa crop. |
The research by Harris and Parker also demonstrates the difference in racial composition between two groups of MID zip codes—those with a claiming rate of at least 40 percent and those with less than 40 percent. “Among high-claiming zip codes,” they find, “5.6 percent of the population is African American, and 82.5 percent of the population is white” while in the lower-claiming areas, “13.4 percent … is African American, and 73.3 percent … is white.”
Get all of their analysis and data here, and visit this interactive map to explore county-level data.
See also their research on EITC claiming by zip codes.
The Brookings Institution is committed to quality, independence, and impact.
We are supported by a diverse array of funders. In line with our values and policies, each Brookings publication represents the sole views of its author(s).


Commentary
10 U.S. Counties with the Highest Mortgage Interest Deduction Claim Rate
December 10, 2014