
Lessons learned from
the use of nontraditional data
during COVID-19
Over the last decade, an explosion of data collection has led to a robust set of nontraditional data sources for both monetary and fiscal policymakers to incorporate into their decisionmaking. In normal times, existing and time-tested datasets compiled by government statistical agencies often do a good job of capturing the evolution of the economy at a monthly or quarterly frequency, accurately and without bias. However, when the economy turns quickly—times when policymakers need to be particularly responsive—nontraditional data sources may be able to fill important gaps.
The COVID-19 crisis provided a test case of the usefulness of these alternative data sources. Nontraditional data sources aided—or, in some cases, did not aid—policy decisionmaking during the pandemic. These alternative data sources provided a view into economic activity weeks or months before most traditional data would become available. They also illuminated household and business activity at a granular level, helping to clarify the mechanisms affecting the pandemic economy. Having access to nontraditional data specific to this episode also allowed policymakers insight into how the virus and associated health policies were evolving. One important question is whether these data were valuable only because of the unusual and rapid nature of the recent downturn or whether they will be important in future economic crises.
Recession Remedies podcast episode: How did COVID-19 demonstrate the value of nontraditional data?
The benefits and pitfalls of nontraditional data sources
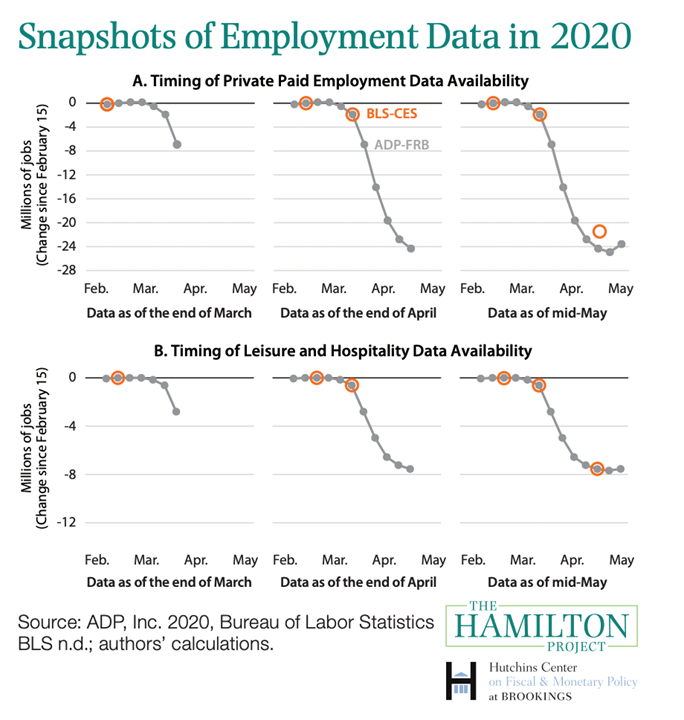
- Timely measurement of the economy is aided by the use of nontraditional datasets to learn, in close to real time, about aggregate developments in the economy that will be reflected only later in traditional data. The benefit of such timely measurement is important to policymakers, especially in times of sharp contractions, such as March 2020.
- The granularity of nontraditional data sources means that, due to their nature, some nontraditional data sources may provide reads on aspects of firm or consumer behavior for which there is no standard government data source (even with a lag). The finer granularity could be related to frequency (e.g., daily data), geography (e.g., data broken down by region), or individual characteristics. Generally, being able to do granular analyses in almost real time could allow for faster evaluations of the costs of shocks or the benefits of policies, which in turn could serve to fine-tune subsequent policy actions.
- The availability of data from so many different sources allows policymakers to answer specific, unanticipated questions that are unique to a particular crisis. For these unique uses, it is not clear that investment in generating these statistics during normal times would be worth the cost, underscoring the importance of quick access in times when they are.
- Unlike government statistics, most alternative data sources are not designed with the purpose of generating statistics but are instead a byproduct of another use (such as card transactions). As such, the data are not designed to be representative of consumers or firms and may be hard to interpret or, worse, misleading.
Lessons learned from the use of nontraditional data during COVID-19
At the onset of any crisis, economic policymakers must identify whether they are confronting a demand shock or a supply shock and the magnitudes and likely persistence of those shocks. As the episode unfolds, policymakers also want to understand how the shocks are propagating to the broader economy. Consequently, much of the nontraditional data used in the pandemic recession will likely prove useful in the future: daily point-of-sale card swipe data, surveys of consumer sentiment, credit card data, and weekly automotive transactions should give an early warning of a downturn.
High-frequency, granular data will probably continue to reveal aspects of business cycle dynamics that we can learn from for many years. Understanding the propagation of shocks to the rest of the economy may be aided by nontraditional data on payrolls, business exits/entries, or supply chain disruptions. These are some of the series policymakers need to have and understand for every crisis, and they should plan for the next crisis by investing in nontraditional data sources now—to build longer time series of timely indexes to supplement traditional data sources, to improve the usability of existing data, to validate the granular details that may be available and become important during a downturn, and to hone their skills in working with these data.
When the economy turns quickly—times when policymakers need to be particularly responsive—nontraditional data sources may be able to fill important gaps.
It is also important to understand the pitfalls of using nontraditional data. The absence of a long time series in many of these series hinders seasonal adjustment, makes levels difficult to interpret, and impedes comparisons at a business cycle frequency. These data can also be unreliable because they are nonrepresentative, methodologically inconsistent, highly variable or noisy, or susceptible to discontinuation. The resources to develop the human capital to address these issues are large—and that is over and above the cost of the data itself.
Even if these nontraditional data sources have limited use during an expansion, it is worth developing them to be prepared for the next crisis, the next government shutdown, or the unexpected. Some shocks, often supply shocks, seem more idiosyncratic across episodes, and so the relevant data are as well. In the 1970s, timely data on global oil markets and inflation expectations would have been valuable but were largely unavailable. In the most recent recession, data on COVID-19 hospitalizations and public shutdowns were valuable but seem unlikely to be important in future cyclical events. It is hard to know what types of idiosyncratic series will be valuable in future episodes, but a culture that embraces transparency and data sharing can only help.
For more information or to speak with the authors, contact:


About the Authors