
Delivering to deserts: New data reveals the geography of digital access to food in the U.S.
The rise of e-commerce services and the global COVID-19 pandemic have transformed how Americans eat. Over one-third of U.S. adults have used delivery apps to order from a restaurant or store in the past year, and online grocery spending more than quadrupled between August 2019 and November 2021. The massive growth of digital food services—ranging from grocery pickup and delivery to meal kits and restaurant deliveries—is redefining how Americans get their food.
Delivery is no longer just for the pizza shop down the street. Web- and app-based services can now drop a variety of fresh groceries, prepared foods, and everything in between at customer’s doorsteps, turning our preexisting understanding of food access on its head. Food now meets people where they are.
Digital food access could be a game-changer for people who struggle with brick-and-mortar food access barriers, including those living in disinvested areas historically defined as “food deserts” and individuals facing mobility challenges or time constraints. But at the same time, there are few neighborhood-level assessments of the digital food services footprint and whether those service maps align with the communities of greatest need.
This brief aims to address that gap. Using data on delivery zones from four of the most prominent digital food delivery companies and platforms—Amazon (Amazon Fresh and Whole Foods), Instacart, Uber Eats, and Walmart—we assess the geography of digital food access across the country. We find:
- Digital food services are now available to almost all people. Even when studying just these four providers, 93% of America’s population has access to rapidly delivered fresh groceries or prepared foods through at least one of the four platforms. Competition and choice are also common, with half of the country’s population living in ZIP codes served by all four of the companies we analyzed.
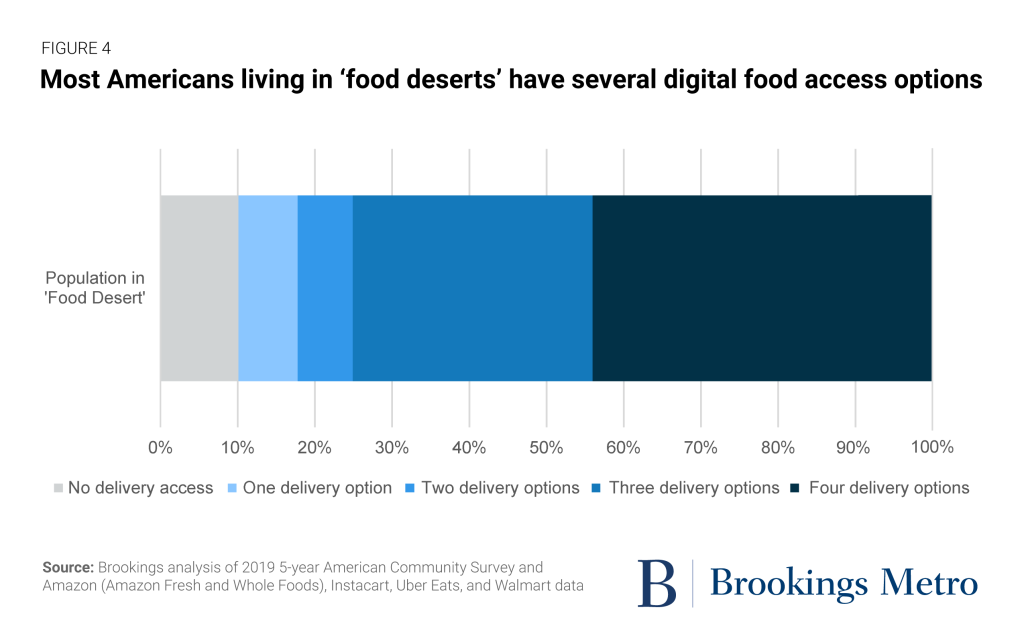
- Delivery zones reach most Americans living in traditionally defined “food deserts.” We found that 90% of people living in low-income, low-access tracts have at least one digital food access option—and the service rate exceeds 95% in food deserts within metropolitan areas. Yet these service maps still leave nearly 4.5 million food desert residents outside of delivery zones—the majority of whom live in rural areas.
- Broadband is a frequent barrier to digital food access, even when delivery services are available. The household broadband adoption rate across the U.S. is 86%—lower than digital delivery availability. In some cases, such as rural and isolated neighborhoods, the lack of broadband and delivery service is aligned. In many metropolitan areas, however, broadband adoption gaps are a distinct geographic barrier to digital food access.
The results of this analysis affirm the enormous opportunity for digital food services to feed more people, save consumers time, and unlock new business opportunities within the food industry. However, expansive delivery zones alone will not address food insecurity. Issues such as affordability, digital connectivity, and land use can restrict the economy-wide benefits of these emerging services. We explore the system-wide ripple effects of these last-mile transformations in a companion brief.
Mapping the food delivery landscape
As we found in previous research on food access measurement, the geography of digital food access across the country has been a black box. National-level statistics such as online grocery market share, consumer surveys, and the expansion of the U.S. Department of Agriculture’s (USDA) SNAP Online Purchasing Pilot during the COVID-19 pandemic suggest a certain level of ubiquity. But digital food access is determined first and foremost by private companies’ delivery zones, which are not publicly published.
Models assuming delivery availability within a certain milage radius of grocery chains known to sell food online are an insufficient approximation. Not every store has the same delivery footprint, and these footprints are often communicated to consumers at a ZIP code level. Further, as warehousing and logistics evolve, not all food delivery relies on the brick-and-mortar food retail backbone.
So we went to the source and asked four of the country’s most well-known food delivery companies—Amazon (Amazon Fresh and Whole Foods), Instacart, Uber Eats, and Walmart—for their delivery footprints. All four companies provided us with the ZIP codes where they delivered fresh or prepared food in Quarter 3 of 2021. It’s worth noting that this delivery footprint reflects rapid last-mile delivery of a variety of foods, including fresh and prepared foods, to consumers’ doorsteps—not simply access to shelf stable and pantry foods through traditional package shipment models. Finally, while Amazon, Instacart, and Walmart are eligible retailers through the SNAP online purchasing program, this delivery data is not limited to SNAP-eligible foods, and instead is intended to provide a first glimpse at the landscape of a variety of delivered foods, including both grocery items and prepared meals.
The delivery zone analysis immediately revealed two fundamental realities of digital food access: 1) most Americans live in delivery zones, and 2) where there’s one food delivery option, there tend to be others as well.
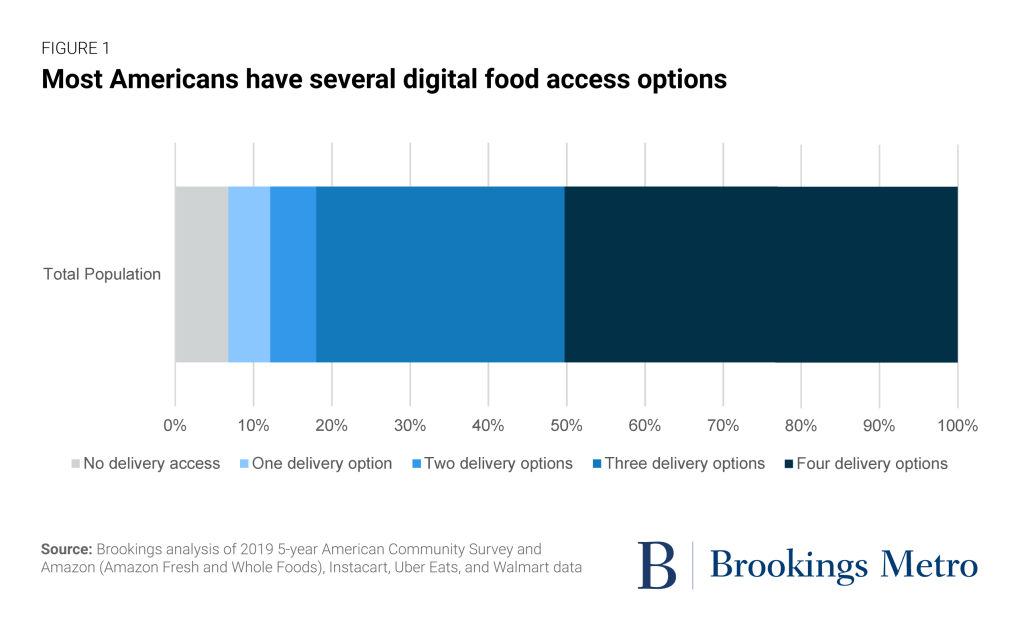
The vast majority (93%) of America’s population has access to food through at least one of the four platforms. Most of those with access to delivery have ample options; half of Americans live in places served by all four of the companies we analyzed, and another 32% have access to three of the four. While our companion brief on the broader impacts of digital food access explores questions and concerns of market concentration, this delivery data shows that competition exists in a huge number of American neighborhoods. Simply put, most Americans have choices when it comes to purchasing food online.
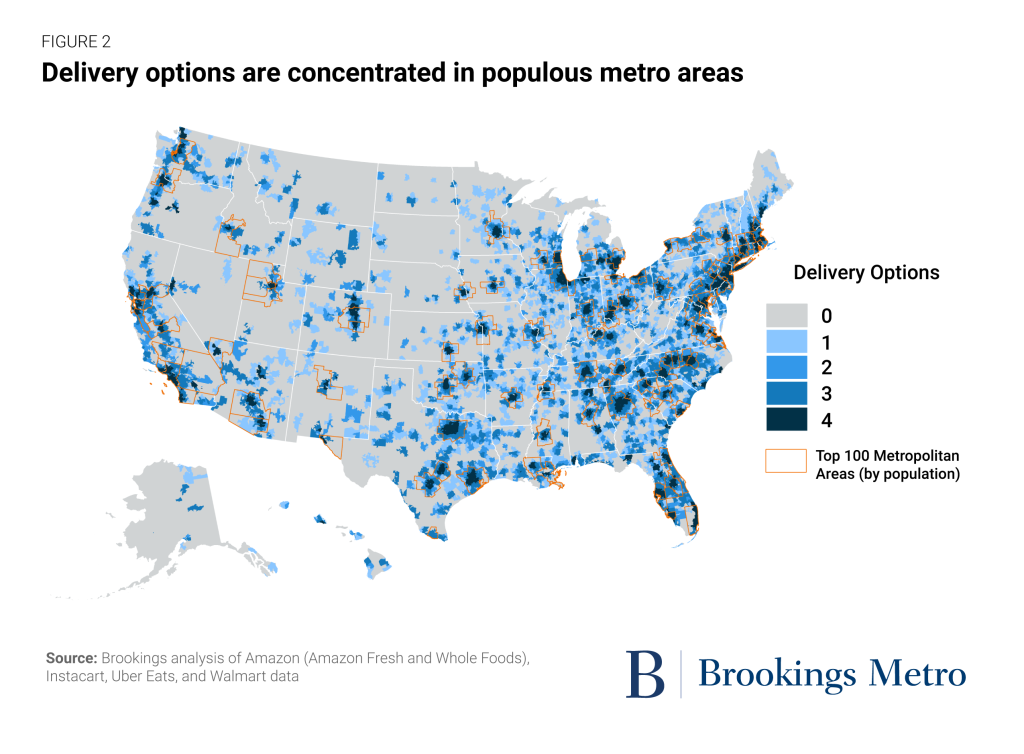
Mapping the delivery zones of these four companies reveals another important pattern: Delivery options are especially concentrated in populous places, particularly our country’s largest metro areas. Even though these companies’ delivery zones only cover about 30% of land area in the continental U.S., Alaska, and Hawaii, the national map looks much like a nighttime satellite image of the country. Places with very low population densities—large portions of South Dakota and Alaska, for instance—tend to have poor delivery coverage, while the darker colors perfectly align with urban centers.
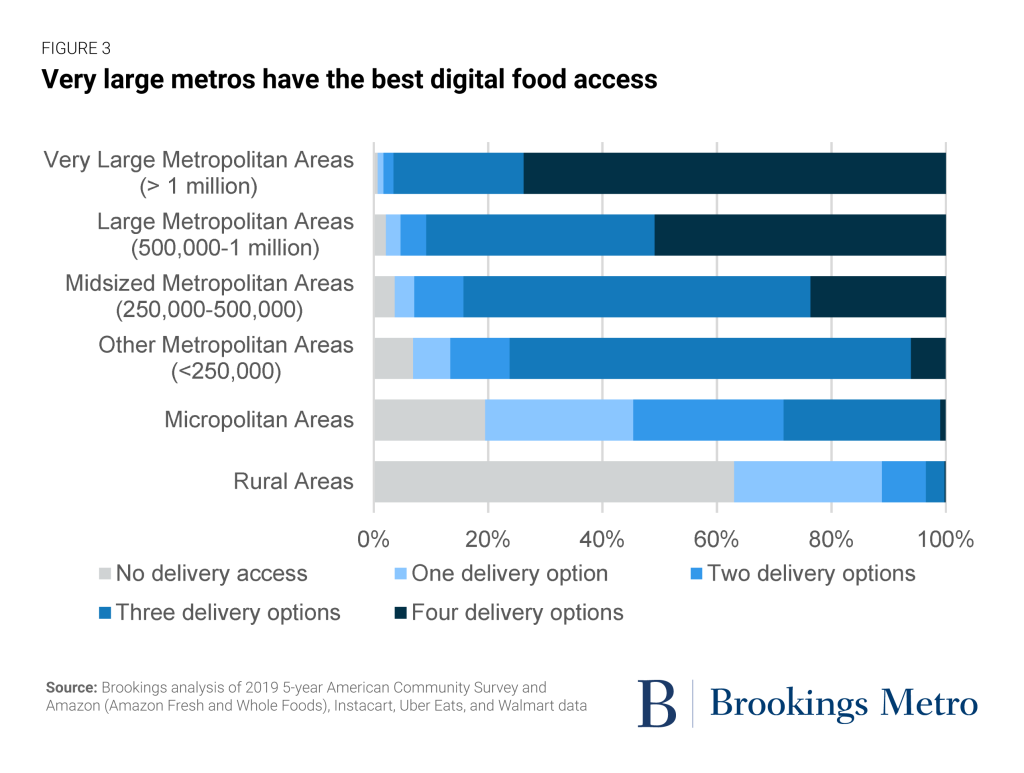
The largest metro areas have particularly robust digital food access (Figure 3). In midsized metro areas with populations between 250,000 and 500,000, 96% of people have access to at least one delivery option, and 24% have access to all four of the options analyzed. These numbers rise for larger metro areas, with 99% of those living in very large metro areas (those with populations over 1 million) having access to food delivery. Particularly in the most populous places, Americans have a variety of digital food access options; nearly three-quarters (74%) of the population of very large metro areas can choose between all four.
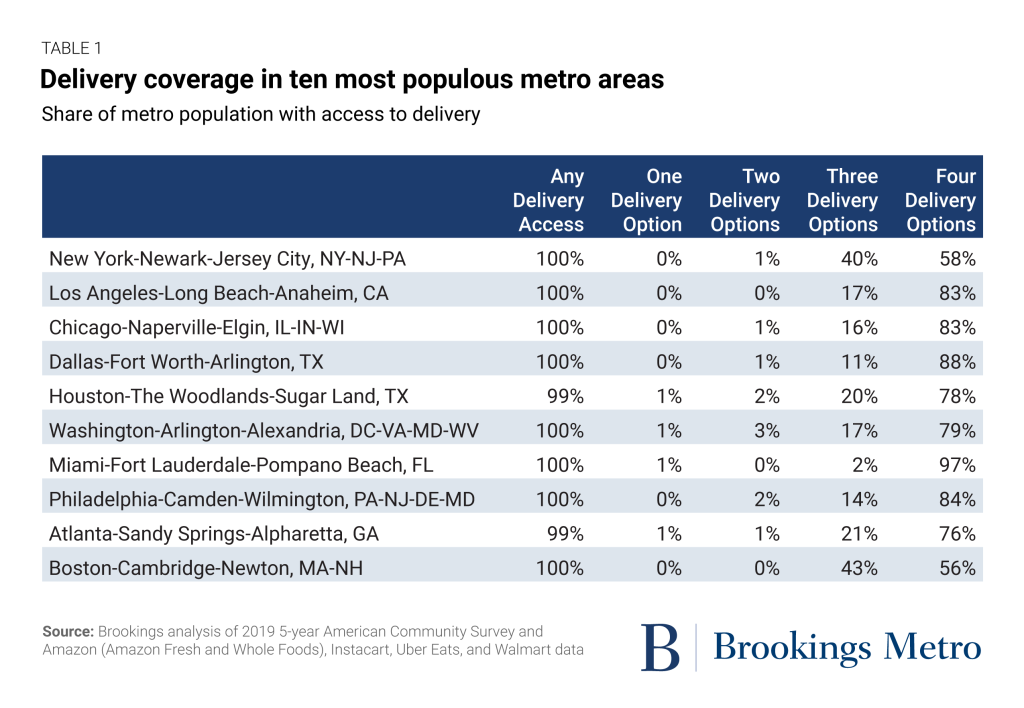
Among the top 10 most populous metro areas, between 99% and 100% of the population has access to at least one delivery option (Figure 4). In each of these areas, a plurality of the population has access to all four delivery options. By contrast, some midsized metro areas such as Duluth, Minn. (79%) have notably less comprehensive delivery coverage, and even less populous metro areas such as Sierra Vista-Douglas, Ariz. have coverage as low as 58%. Only 37% of those living in rural areas have access to even one of the four delivery services.
Delivery zones reach many Americans living in traditionally defined ‘food deserts’
Like much of our country’s built environment, the brick-and-mortar food retail environment has been shaped by decades of systemic discrimination such as redlining and disinvestment, disproportionately impacting BIPOC populations. Highly visible research, activism, and reporting brought the term “food desert” into everyday vernacular as a shorthand for neighborhood-level disparities in access to fresh, healthy food. While we’ve found the term insufficient—it erases community resilience and agency and oversimplifies the complex relationship between food access and food security—the field has produced sophisticated geographic analyses highlighting neighborhoods with significant geographic barriers to food access.
To better understand the overlap between delivery data and food deserts, we used the USDA Food Access Research Atlas (formerly the Food Desert Locater) to identify 10,126 census tracts across the country facing significant access challenges in the brick-and-mortar food retail environment. This USDA-defined dataset includes low-income census tracts where over 100 housing units lack vehicle access and live further than half a mile from the nearest supermarket, or where many residents are more than 20 miles from the nearest supermarket. Together, these tracts are home to 13.6% of the country’s population, or roughly 44.3 million people. To compare the delivery data reported in ZIP codes, we translated Zip Code Tabulation Areas (ZCTAs) to census tracts using the Census Bureau’s ZCTA relationship files.
Our analysis found that 90% of people living in these low-income, low-access tracts have at least one digital food access option, and 44% of residents have access to all four options analyzed.
Digital food access is likely to be a particularly viable option in metropolitan areas, which have even more robust delivery coverage within their food deserts. There is at least one digital food access option for 96% of the population living in food deserts in midsized metro areas. The population share reaches 99% in very large metro areas. Moreover, metropolitan digital food access can also bring consumer choice for food desert residents with digital connectivity. For example, in very large metro areas, 79% of people living in food deserts live within the delivery zone of all four companies analyzed.
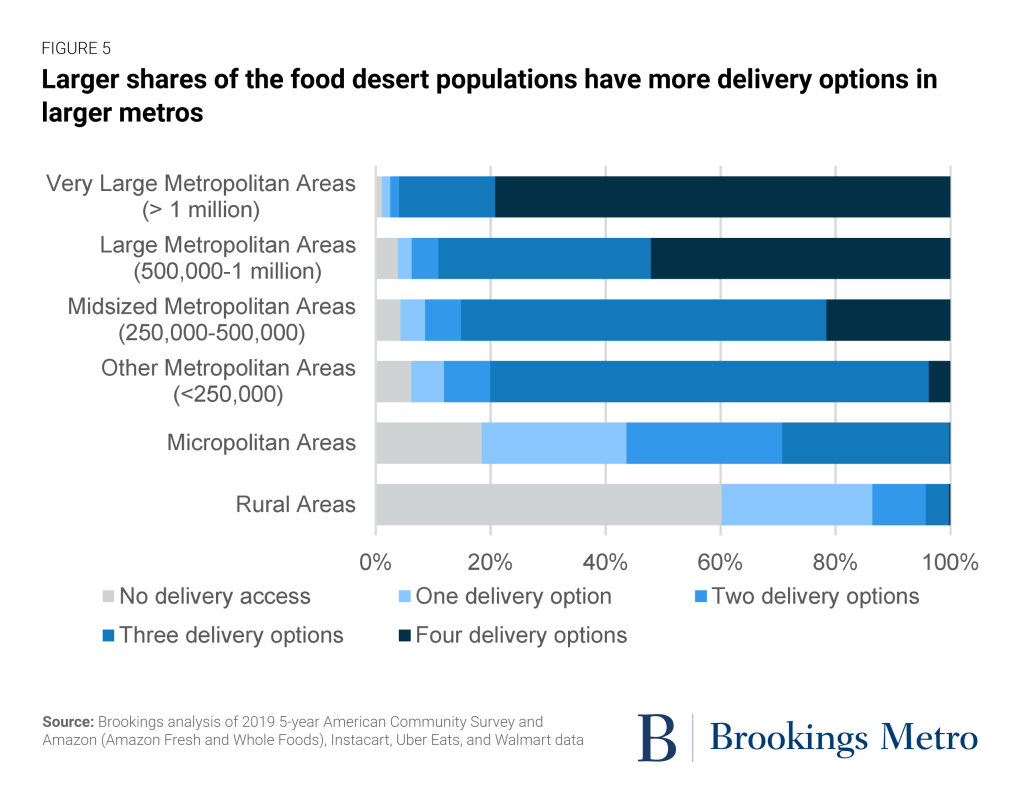
Yet even with delivery services available in most food deserts, the emerging technology is far from a universal solution. Out of the 10,126 USDA-defined low-income, low-access tracts, 759 have no digital food access options—and those tracts house over 2.9 million people. More than 84% of these tracts with no delivery coverage are situated in rural and micropolitan areas, with the remaining 119 in metropolitan areas. We also found another 652 tracts have mixed availability, meaning some but not all of the population lives within a delivery ZIP code. Based on our methodology, we estimate that nearly 4.5 million residents of traditionally defined food deserts lack access to delivery options.
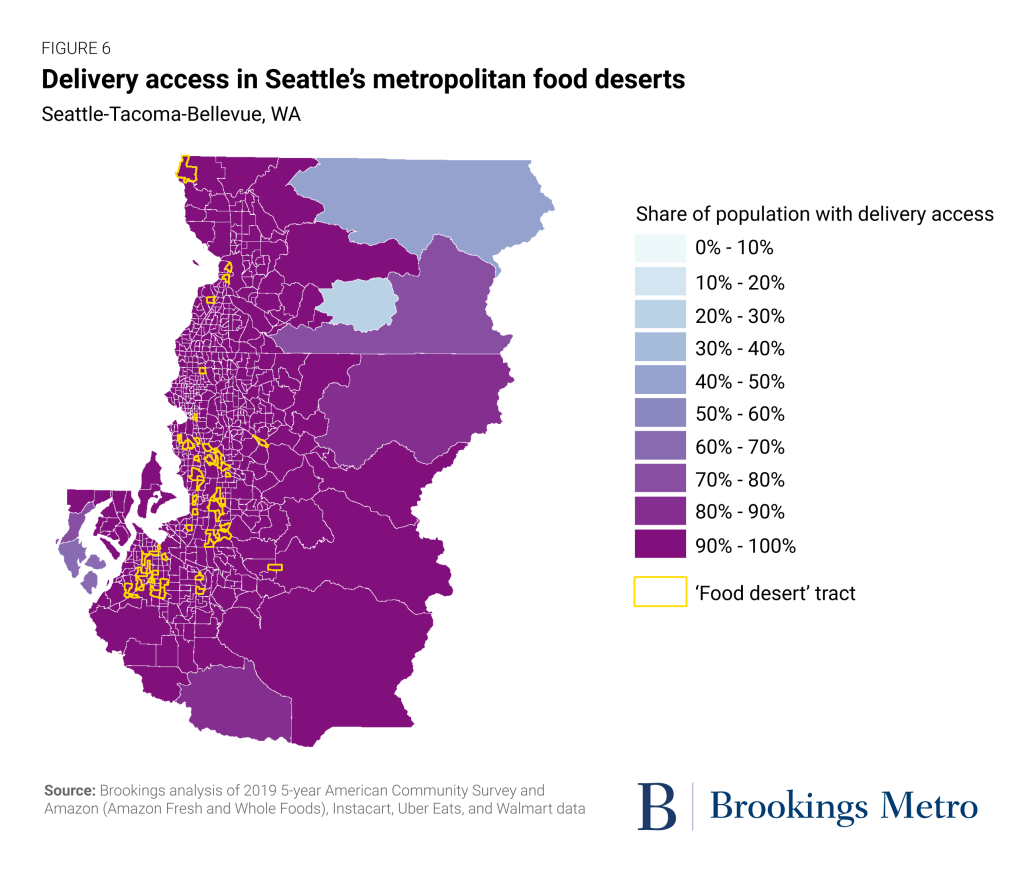
The Seattle metro area is emblematic of these national patterns. Known for its innovation-focused industries and generally high educational attainment, it’s not surprising the Pacific Northwestern hub has notably high delivery coverage overall, with 99.7% of the total population living in places with at least one delivery option. That coverage blanket benefits the region’s 55 traditionally defined food deserts, each of which have at least one delivery option. And for all but 15 of these food desert tracts, over 90% of the population has access to all four of the delivery options analyzed. The net result is delivery services can bring food to 320,000 residents of traditionally defined food deserts in the Seattle-Tacoma-Bellevue metro area.
Broadband is a frequent barrier to digital food access
Just as living within a certain geographic proximity to a grocery store does not mean someone has perfect access to food in the brick-and-mortar food system, not everyone living in a delivery zone has perfect digital access to food. That is especially the case for the roughly 17 million American households who did not have mobile or in-home broadband service before the pandemic began. While failing to adopt broadband can have many root causes—including physical infrastructure gaps, high prices, no computing device, or a digital skills deficit—the end result is a direct barrier to purchasing food online.
In general, digital food delivery service is more prevalent in American neighborhoods than broadband subscriptions. Across all tracts, the population served by at least one delivery zone is 93%, but only 86% of households hold broadband subscriptions. This still leaves the vast majority of tracts with a mix of both multiple food delivery options and high broadband adoption rates; these are the places most likely to have seamless digital access to food.
However, the mix of broadband and digital food gaps does create two types of neighborhoods that are under-resourced, with low broadband adoption. The most extreme are places with low delivery coverage and low broadband adoption, which are frequently neighborhoods with lower population densities. In these places, the extended distances between housing units increases the per-mile cost of delivering both broadband and food. Due to the relatively stronger food service map, though, the more typical under-resourced case is neighborhoods with food options but low broadband adoption. These are neighborhoods with a high potential for digital food access solutions if broadband adoption rates are increased.
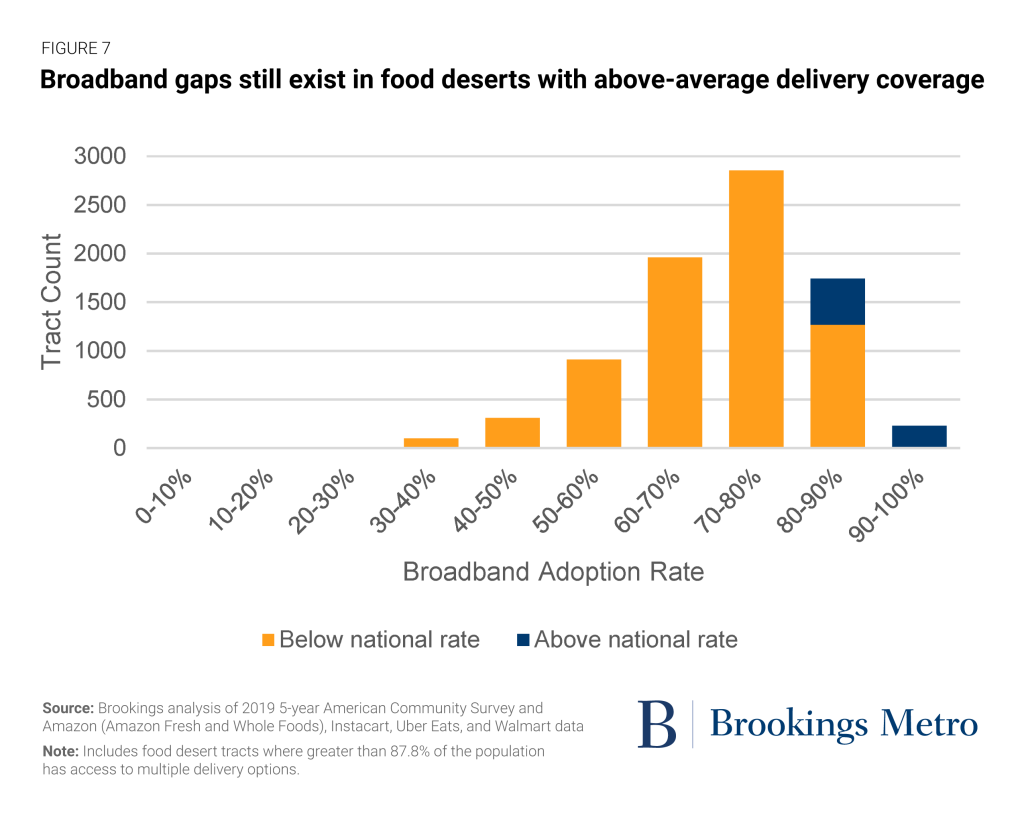
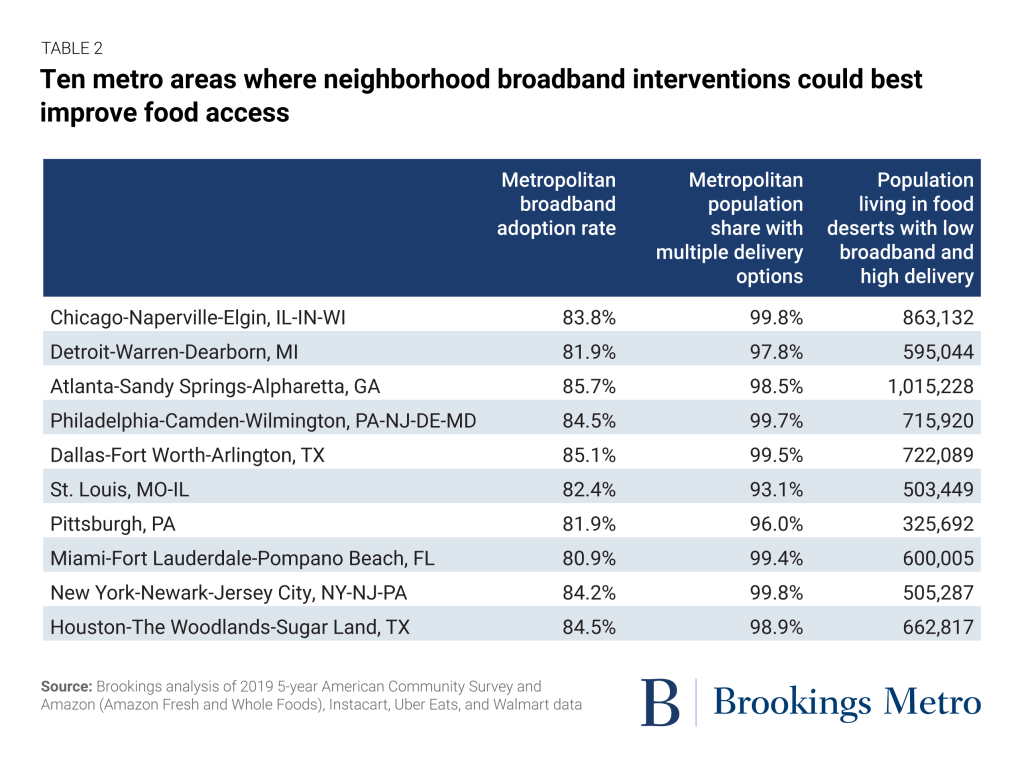
As we think through the potential of digital food access strategies to bridge the gaps of the traditional food retail environment, neighborhoods with low brick-and-mortar access, low broadband adoption, and high pre-existing delivery coverage stand out. Cross-sectoral strategies to increase broadband adoption and food access could have the highest impact in these communities. Figure 8 shows the distribution of broadband adoption rates among low-income, low-access tracts (i.e., food deserts) with delivery coverage above the national rate (more than 87.8% of the population has access to multiple delivery options). Practitioners should consider prioritizing the 7,421 tracts (orange) with broadband adoption below the national rate for targeted cross-sectoral pilot programs.
Many of these low-income, low-access tracts with high delivery coverage but low broadband adoption are concentrated in very large metro areas. For instance, while the Chicago-Naperville-Elgin metro area has two or more delivery options for over 99.8% of its population and a respectable 83.8% broadband adoption rate, disparities show up at the neighborhood scale. In one Chicago neighborhood with full delivery coverage (100% of the population is served by all four analyzed delivery zones), only 30.2% of households have broadband subscriptions. Another 28 census tracts in the metro area have between 36% and 50% broadband adoption, yet 100% delivery access across all four services. In total, 237 of the metro area’s traditionally defined food deserts have more delivery options, but lower broadband adoption, than the national rate. These neighborhoods, clustered in the urban core, are well situated to experience multiple benefits from broadband interventions; investing in broadband is also investing in digital food access for these places.
The maps below offer a glimpse into the digital food access environment in the country’s 384 metro areas by combining indicators of brick-and-mortar access gaps (food deserts) with measures of household broadband adoption rates and delivery coverage.
FIGURE 10
Broadband adoption and digital food access in metro areas
Select a metro area from the dropdown below and use the slider to reveal digital food access.
Source: Brookings analysis of 2019 5-year American Community Survey and Amazon, Instacart, Uber Eats, and Walmart data
Implications
Food insecurity is a persistent barrier to universal public health and economic prosperity. The data within this brief affirms the enormous potential digital food services offer to address this barrier. Well over 90% of the domestic population can now access digital food deliveries, with near universal access rates in the largest metro areas.
Yet new physical technologies and digital services alone will not solve food insecurity. Local, state, and federal leaders—along with their industry partners—must consider how to reform complementary public policies to ensure the digital food system is accessible to all, provides the kind of high-quality food choices individuals need and want, and builds a stronger food economy for workers and business owners. That demands addressing prerequisites to digital delivery access such as broadband adoption and digital device ownership, as well as emerging environmental, economic, and social impacts of this new system.
Household affordability is one immediate priority. Food delivery adds value for many consumers, but higher prices will only put delivery further out of reach for many food-insecure households. Broadband suffers from similar cost barriers, as price is frequently cited as the number one reason households do not subscribe to wireline or wireless service. Policymakers and practitioners should be willing to experiment with pricing subsidies—such as the SNAP Online Purchasing Pilot and the new broadband Affordable Connectivity Program—to see how the two interrelate to extend digital food access to those most in need.
Sprawling and low-density development patterns are a major consideration too. Digital food systems operate within the established built environment in any given community—and since density of food purveyors and consumers is highest in larger metro areas, it’s no surprise that those neighborhoods currently see the greatest number of delivery options. That creates structural advantages for residents of those densely built places, while potentially limiting digital service adoption for residents of isolated or low-density places. The relationship between population density and digital services could also have knock-on effects for vehicle miles traveled, both for individuals and the delivery drivers who serve them.
Finally, practitioners and researchers should continue to study how the digital food economy is impacting regional business environments. Food service, restaurants, and retail are enormous employers across the country (13.8 million workers in total), and many more work in the agricultural, processing, wholesale, and transportation components of the industry. Food is also an area open to entrepreneurship—the retail side in particular. As digital services continue to grow their share of total food retail sales, it’s imperative to keep track of how the overall industry ecosystem evolves. Elements such as small business opportunities within digital platforms, access to financial capital, and workforce conditions and opportunities must all be monitored.
These are just a subset of the major issues at play when industrial and technological transformation at this scale takes places across a foundational economic sector like food. We explore many of those conditions within the digital food system in greater detail in a companion brief.
Conclusion
Even before the COVID-19 pandemic, the digital food economy was poised to transform how Americans eat, travel, and socialize. Now, after the pandemic increased demand for delivery, digital food services have become a substantial force within the broader American food economy faster than many predicted. For the vast majority of American households, food delivery is now just a few clicks away.
The rise of this new component of the food system offers great promise to address food insecurity at the scale America needs—but digital innovations alone will not solve many long-standing issues. It’s time for regulators, local practitioners, and industry leaders to build strategies that tap digital services to build a healthier future for all.
About the Authors