CHAPTER 2
IMPORTS FROM ASIA
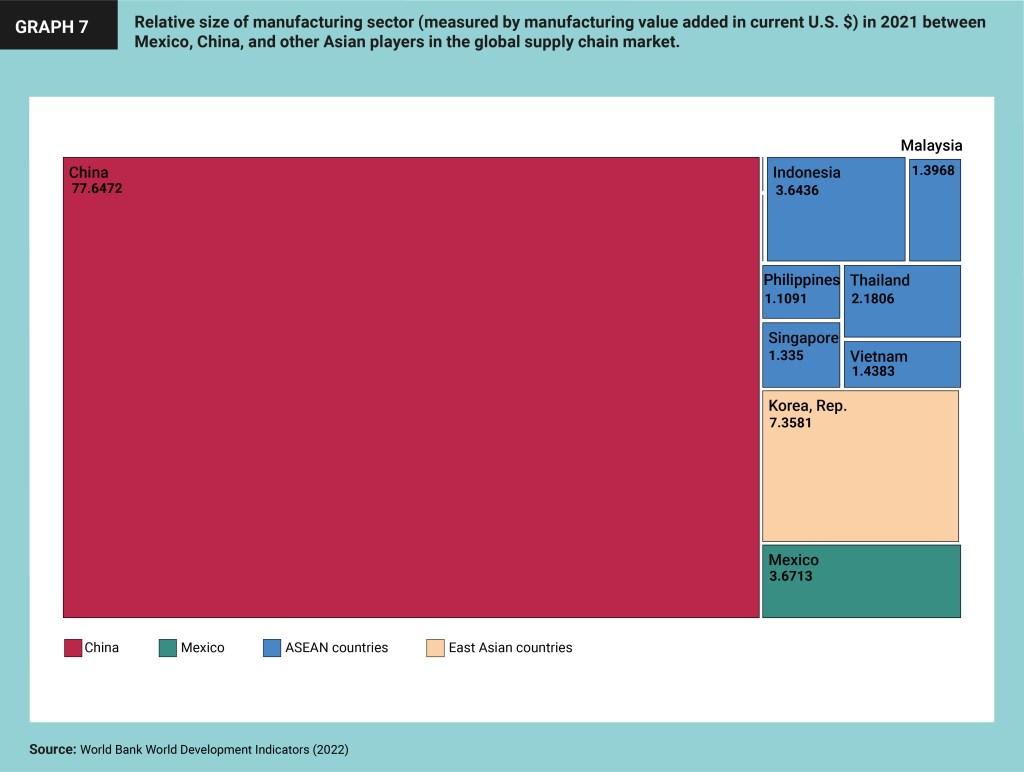
The future of Asia-Pacific value chains
Asia-Pacific value chains have undergone a series of shocks in recent years, including the COVID-19 pandemic, environmental disasters, and geostrategic tensions between China and the U.S. As a result there has been much speculation about how these supply chains might evolve: Will some “reshore” to the U.S. or “nearshore” to partners in North America? Will there be significant shifts of value chains out of China? If so, where will they go? It is still early days, but we can already bring some evidence to bear on these questions, which is the purpose of this piece.
Reshoring
Reshoring of manufacturing back to the U.S. has become an important focus of policy. In his 2022 State of the Union address, President Biden stated that “it’s time to bury the label rust belt. It’s time to see what used to be called the rust belt become the home of a significant resurgence of manufacturing. Instead of relying on foreign supply chains, let’s make it in America.” Buy American provisions have been included in significant pieces of recent legislation such as the infrastructure bill and the climate-focused bill (named the Inflation Reduction Act). President Trump used similar rhetoric to extol protectionist policies such as import tariffs on steel and aluminum or the 25 percent tariff on about half of what the U.S. imports from China. These policies have been in place since 2018, long enough to see if they are having the effect of promoting a generalized reshoring of manufacturing. By generalized reshoring I mean a widespread nascent trend that is visible in the macroeconomic data.
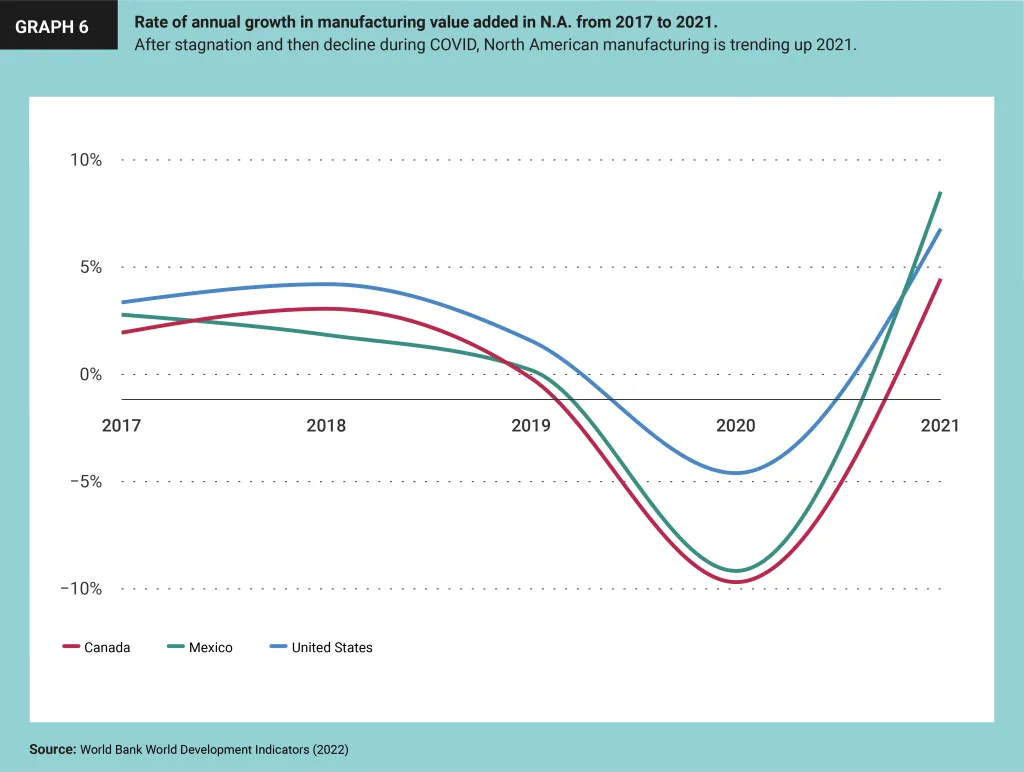
As of mid-2022, there is no evidence of a generalized resurgence of manufacturing in the U.S. The index of real manufacturing output from the St. Louis Federal Reserve Bank shows remarkable stability in U.S. manufacturing output over the past decade. There was some decline in the early days of COVID, but then a quick rebound. As for trend: Real manufacturing output was 4 percent higher in mid-2022, compared to a decade earlier. Growth of 4 percent over a decade is quite slow and means that manufacturing continued a long trend of decline as a share of the U.S. economy. While manufacturing output has stagnated, manufactured imports have surged. It used to be that the manufacturing trade deficit was a significant part of the overall U.S. trade deficit, but there were other important factors as well, notably imports of crude oil. But now the U.S. is largely self-sufficient in energy, so the overall trade deficit consists almost exclusively of the manufacturing trade deficit, which reached $900 billion in 2020.
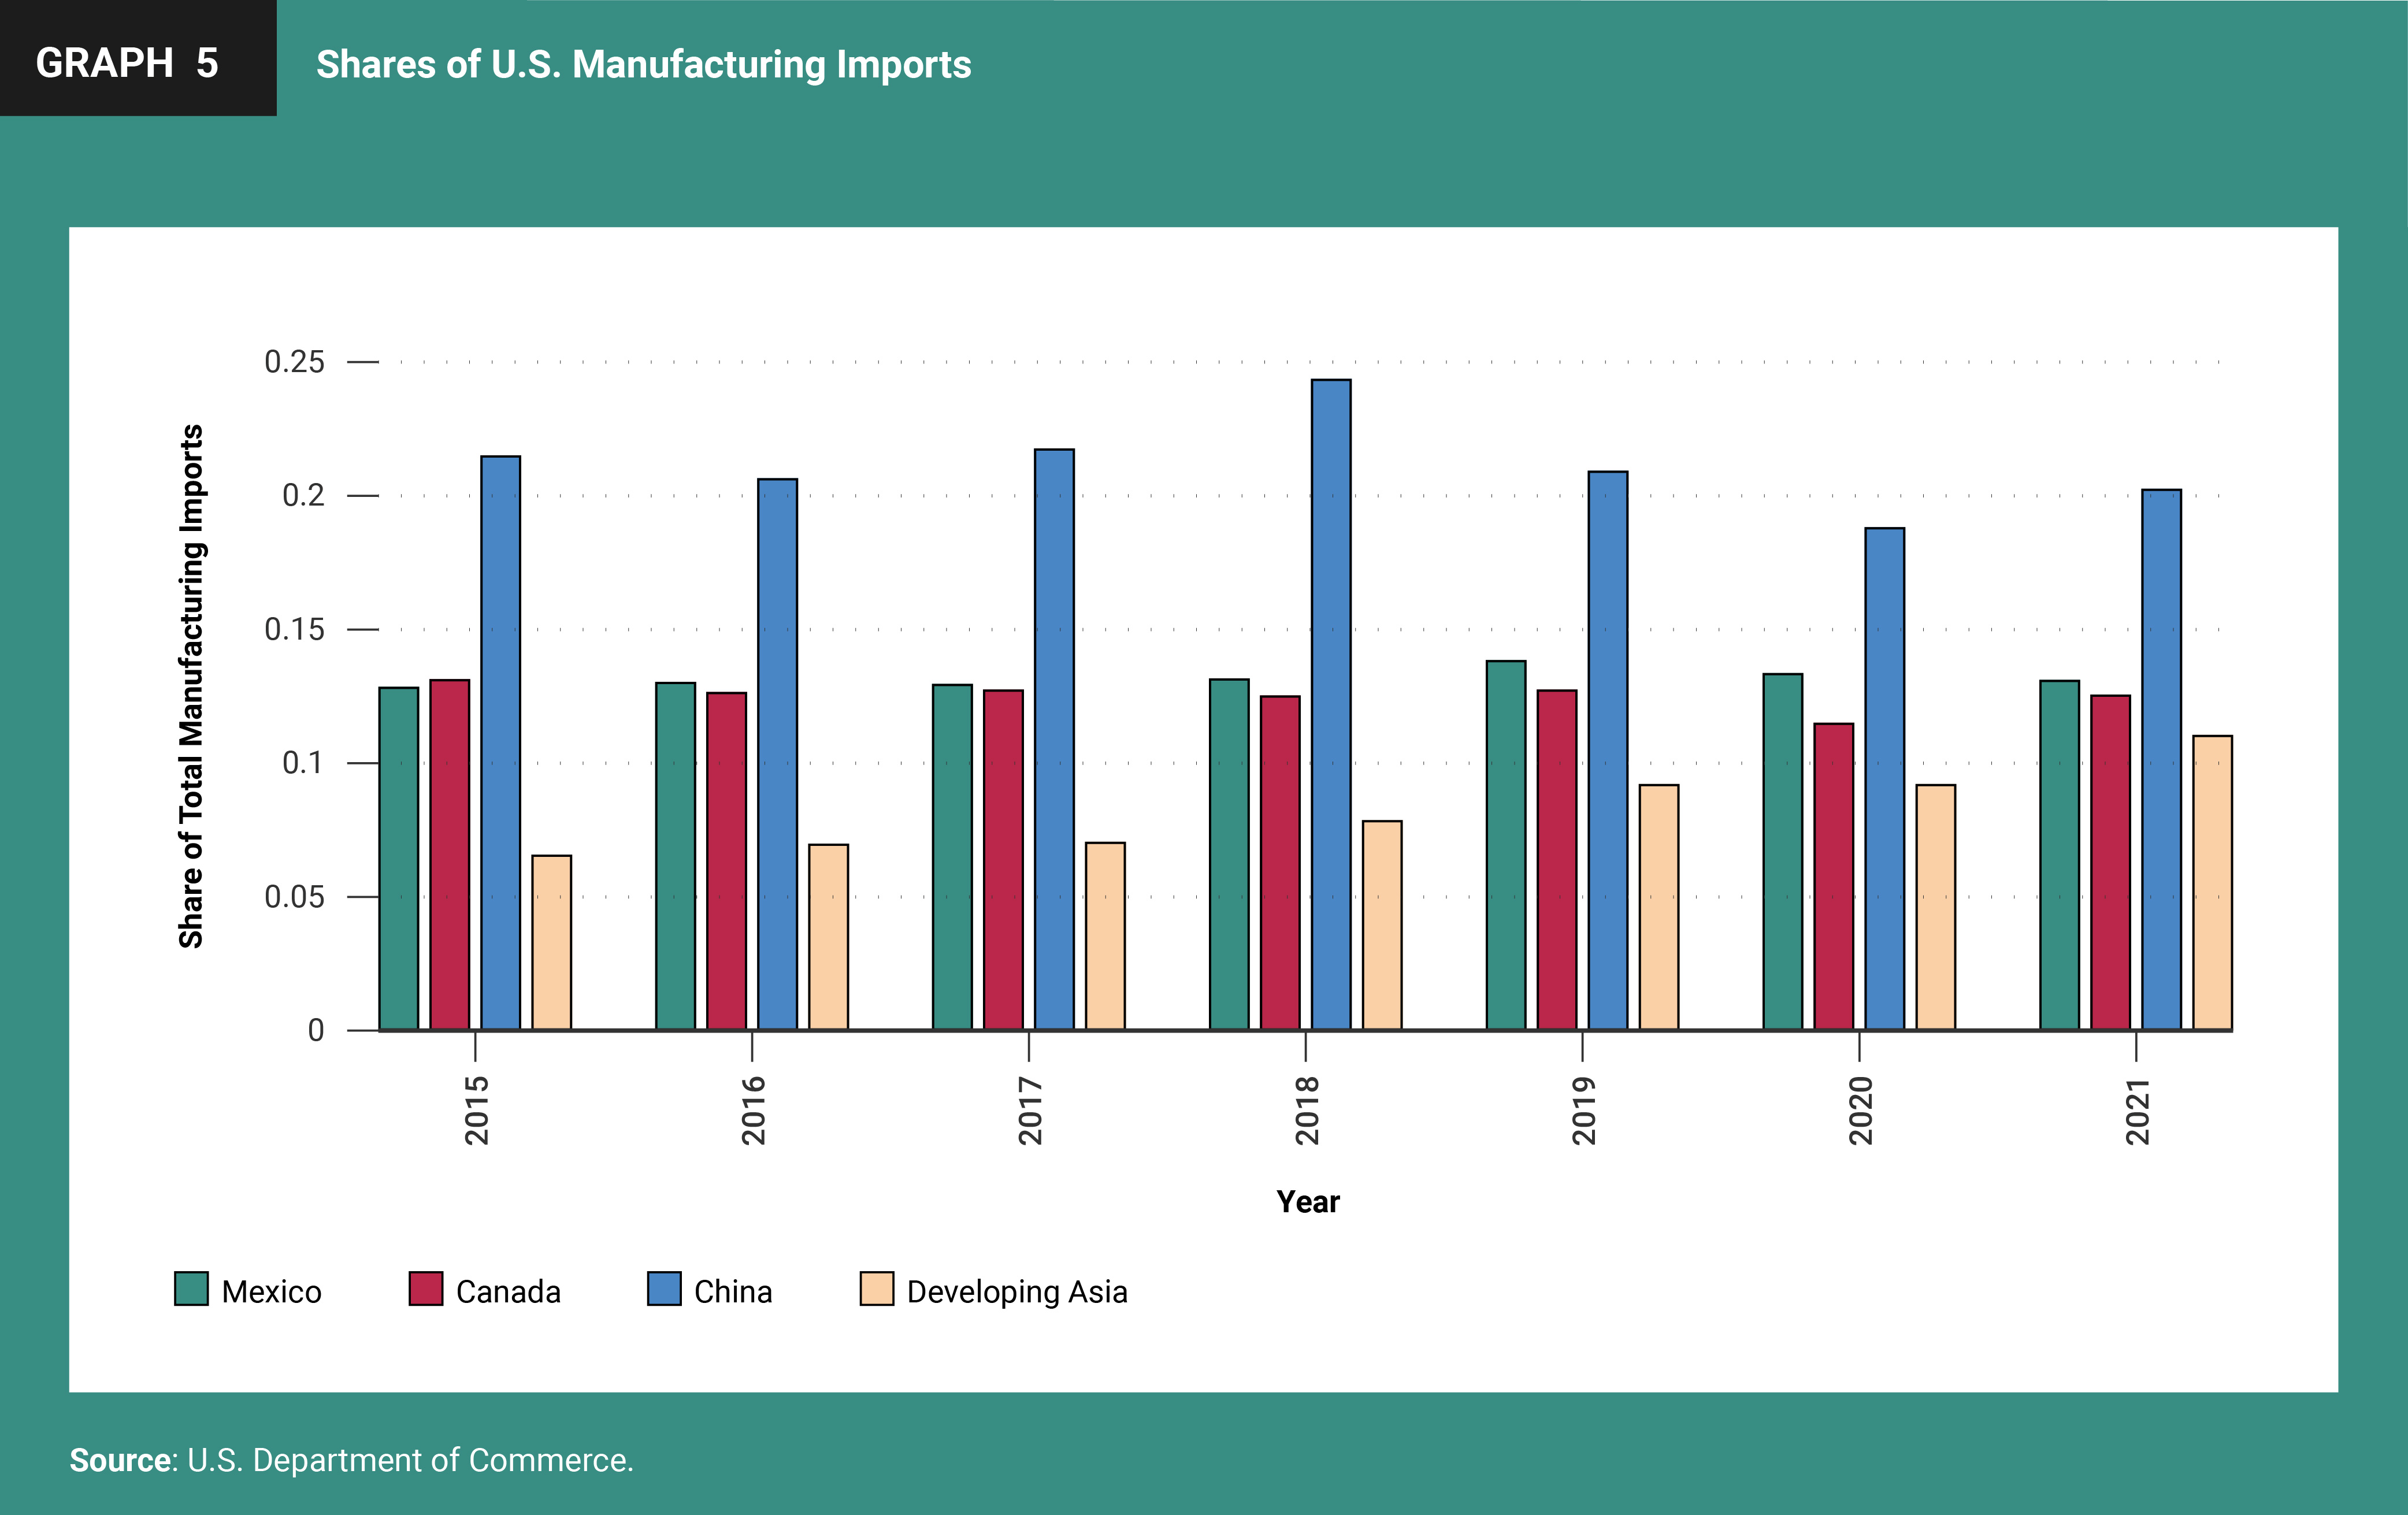
Between 2018 and 2021, China’s share of U.S. manufactured imports declined from 24 percent to 20 percent.
This overall trade deficit equals the gap between investment and savings in the U.S. In other words, the trade deficit enables the U.S. to invest more than its saves. For there to be generalized reshoring of manufacturing to the U.S., would require a change in this savings-investment balance. The U.S. could invest less, but that would be bad for long-run growth, and no one is advocating this. Holding the investment rate constant, savings would have to rise to reduce the manufacturing trade deficit. That is, Americans would have to consume less of their income. The most direct path to achieve this would be to increase taxes and reduce government spending. It is hard to find any politician in America advocating this kind of fiscal tightening. The actual budgets passed by the U.S. Congress generally go in the other direction, increasing fiscal deficits. So, generalized reshoring and a reduction of the U.S. trade deficit is unlikely.
While generalized reshoring is unlikely, it is still possible to subsidize the expansion of particular industries, such as semiconductors or electric vehicles, as done in the recent CHIPS bill and Inflation Reduction Act passed by Congress. But without a change in the macroeconomic stance, it is likely that these policies will crowd out other manufacturing sectors, with the result that the overall size of U.S. manufacturing is unaffected. Subsidizing particular industries could bid up wages for certain types of labor and/or appreciate the exchange rate, with the result that other sectors become less competitive and hence contract. Also, the subsidies have to be paid for, either directly through taxation (or cutting other expenditures) or indirectly through inflation. Either way, paying for the subsidies will tend to reduce other consumption and hence lead to some contraction of other industries. There is no free lunch, so subsidizing the expansion of, say, semiconductors will lead to contraction of other sectors, including some manufacturing industries.
Nearshoring
There is also talk in the U.S. about “nearshoring,” that is, bringing back some manufacturing production from far-away Asia to nearby economies, especially Mexico and Canada. The renewal of the North American free-trade arrangement under the name USMCA fueled this talk. But note that the revised trade agreement did not involve any new trade liberalization of significance, and in fact introduced protectionist measures in the auto sector.
So far, there is little evidence of “nearshoring.” Mexico and Canada each have high shares of U.S. manufacturing imports, around 13 percent, that have been stable for a long time. Between 2015 and 2021 the combined share did not budge from its 26 percent level (Graph 5). There is good reason for this. Canada is a high-wage economy not well suited to producing the kinds of products that the U.S. imports from Asia. Mexico is a low-wage developing country, but it has a lot of weaknesses in its investment climate, as discussed in the next section.
Shift of some supply chains out of China
Despite 25 percent tariffs on Chinese products being in place for four years, they have had only a modest effect on both the volume and value of U.S.-China trade. They have certainly had some effect as U.S. imports from China have declined modestly, and there has clearly been diversion of certain products to Southeast Asia. Between 2018 and 2021, China’s share of U.S. manufactured imports declined from 24 percent to 20 percent. While overall imports have held up, there is a lot of variation by product category. U.S. imports from China of telecommunication equipment or semiconductors are down 50-60 percent, and surely this reflects in part the technology war. On the other hand, imports of other products such as computers or agricultural machinery have risen briskly. During the COVID-19 pandemic, demand shifted to the kinds of goods that China exports, including TVs, exercise equipment, and furniture.
For the sensitive products like semiconductors and telecommunication equipment, it seems that some production shifted out of China to other Asian developing economies, most notably Vietnam. U.S. imports from Vietnam increased by more than 100 percent between 2018 and 2021, reaching $100 billion and making Vietnam America’s sixth largest source of imports. Referring back to Graph 5, China’s share of U.S. manufactured imports fell four percentage points between 2018 and 2021, while imports from other Asian developing countries rose an equivalent amount, with Vietnam leading the pack. The large increase in imports came in quite a few categories, including toys, sports equipment, furniture, and cell phones. But particularly large increases were registered in the three product lines where U.S. imports from China declined: Computer accessories, semiconductors, and telecommunication equipment. Vietnam is a much smaller economy than China; additional imports from Vietnam made up about 40 percent of the shortfall in imports from China in these product lines. Some production has moved to other ASEAN countries, such as Thailand and Malaysia, but Vietnam so far has been the big winner.
The economic conflict between the U.S. and China is more of a tech war than a trade war in the sense that a few specific hi-tech categories have been affected a lot, while overall trade has continued at a high level. But some hi-tech products have been sharply affected by tariffs, subsidies, and other protection. A good example is the solar industry. The U.S. imposed tariffs on Chinese solar products in 2012 to counteract subsidies that the industry had gotten as it developed. Since then, China’s exports of solar panels to the U.S. have fallen to nearly zero, while those from Southeast Asia soared, with Vietnam as the main supplier. In March 2022, the U.S. Commerce Department initiated an investigation into whether Chinese solar photovoltaic (PV) makers were shifting production to Southeast Asia to avoid tariffs, with the implication that solar PV imports from those countries could be subjected to tariffs as well. The result was a collapse in solar imports and a drop in investments in solar installation and energy storage, putting at risk thousands of jobs as well as U.S. targets for switching from fossil fuels to renewable energy. On June 7, 2022, the White House announced that it would suspend solar tariffs on Southeast Asian nations for 24 months. Hence the U.S. will continue to import solar panels from ASEAN countries, often from Chinese firms.
These adjustments in supply chains are visible in the data, especially when one takes into account value added exports. For example, Vietnam’s gross exports to the U.S. have been growing rapidly, at 24.7 percent per year over 2010-2021. The growth rate of the value added in Vietnam’s exports to the U.S. was distinctly slower, at 19.0 percent (Dollar 2022). The latter figure is calculated using trade in value added (TIVA) data from the ADB. The difference between the two figures indicates that the imported content in Vietnam’s production is on the rise. Furthermore, China’s share of the imported content in Vietnam’s exports has risen rapidly, according to the same source.
In 2017, China accounted for 10.8 percent of the imported content in Vietnam’s exports; by 2021 that figure had nearly doubled to 20.3 percent. These trends are consistent with some parts of value chains shifting out of China to Vietnam but remaining connected to China because it is Chinese firms making the new investment and/or Chinese firms supplying key intermediate inputs and machinery. Also, over the same period, China’s exports to Vietnam, both gross (24.6 percent) and value added (22.0 percent) have been rising rapidly.
Evolution of supply chains up to now cannot be characterized with a single generalization. There is no large-scale onshoring or near-shoring to the U.S. though there might be some specific products for which such a characterization would be valid. U.S. efforts to subsidize specific industries such as semiconductors or electric vehicles are not likely to increase total manufacturing production in the U.S. as long as the macroeconomic stance is unchanged. In other words, the U.S. is likely to import more of other manufactured products, providing opportunities to developing countries that can take advantage of it. Some value chains are getting shorter, but others are getting longer. For example, the products whose final assembly moved to Southeast Asia now have longer supply chains. Many developing countries in Asia have wages below those of China, as Chinese wages have risen with productivity. These countries can potentially attract more investment and have a greater role in supply chains, but cheap labor is not enough, as evidenced by the many low-income countries that cannot get a foothold in supply chains. What are some of the factors that determine where production moves?
Global supply chains are largely organized by multinational companies, hence openness to direct foreign investment is critical (Xing et al., 2021). Most countries have gotten this message and are open to direct investment in manufacturing. But manufacturing supply chains also increasingly rely on service inputs–for example, finance, transportation, and telecom. Many developing countries are still quite closed in key service sectors, with the result that their overall openness is only partial.
Other important aspects of the investment climate are logistics, Intellectual Property Rights (IPR) protection, and quality and extent of education. Table 1 shows some relevant indicators for the ASEAN countries plus Mexico, China, and India. High-income countries such as Japan, South Korea, and Singapore are listed for comparison. Among the developing countries, China stands out as having the best logistics and human capital. Its measure on the Logistics Performance Index is the same as South Korea, even though the latter country is at a much higher level of development. Among the lower wage economies, Vietnam stands out as having relatively good logistics. India has weak performance in this area, a reason why Indian manufacturing continues to punch below its weight.
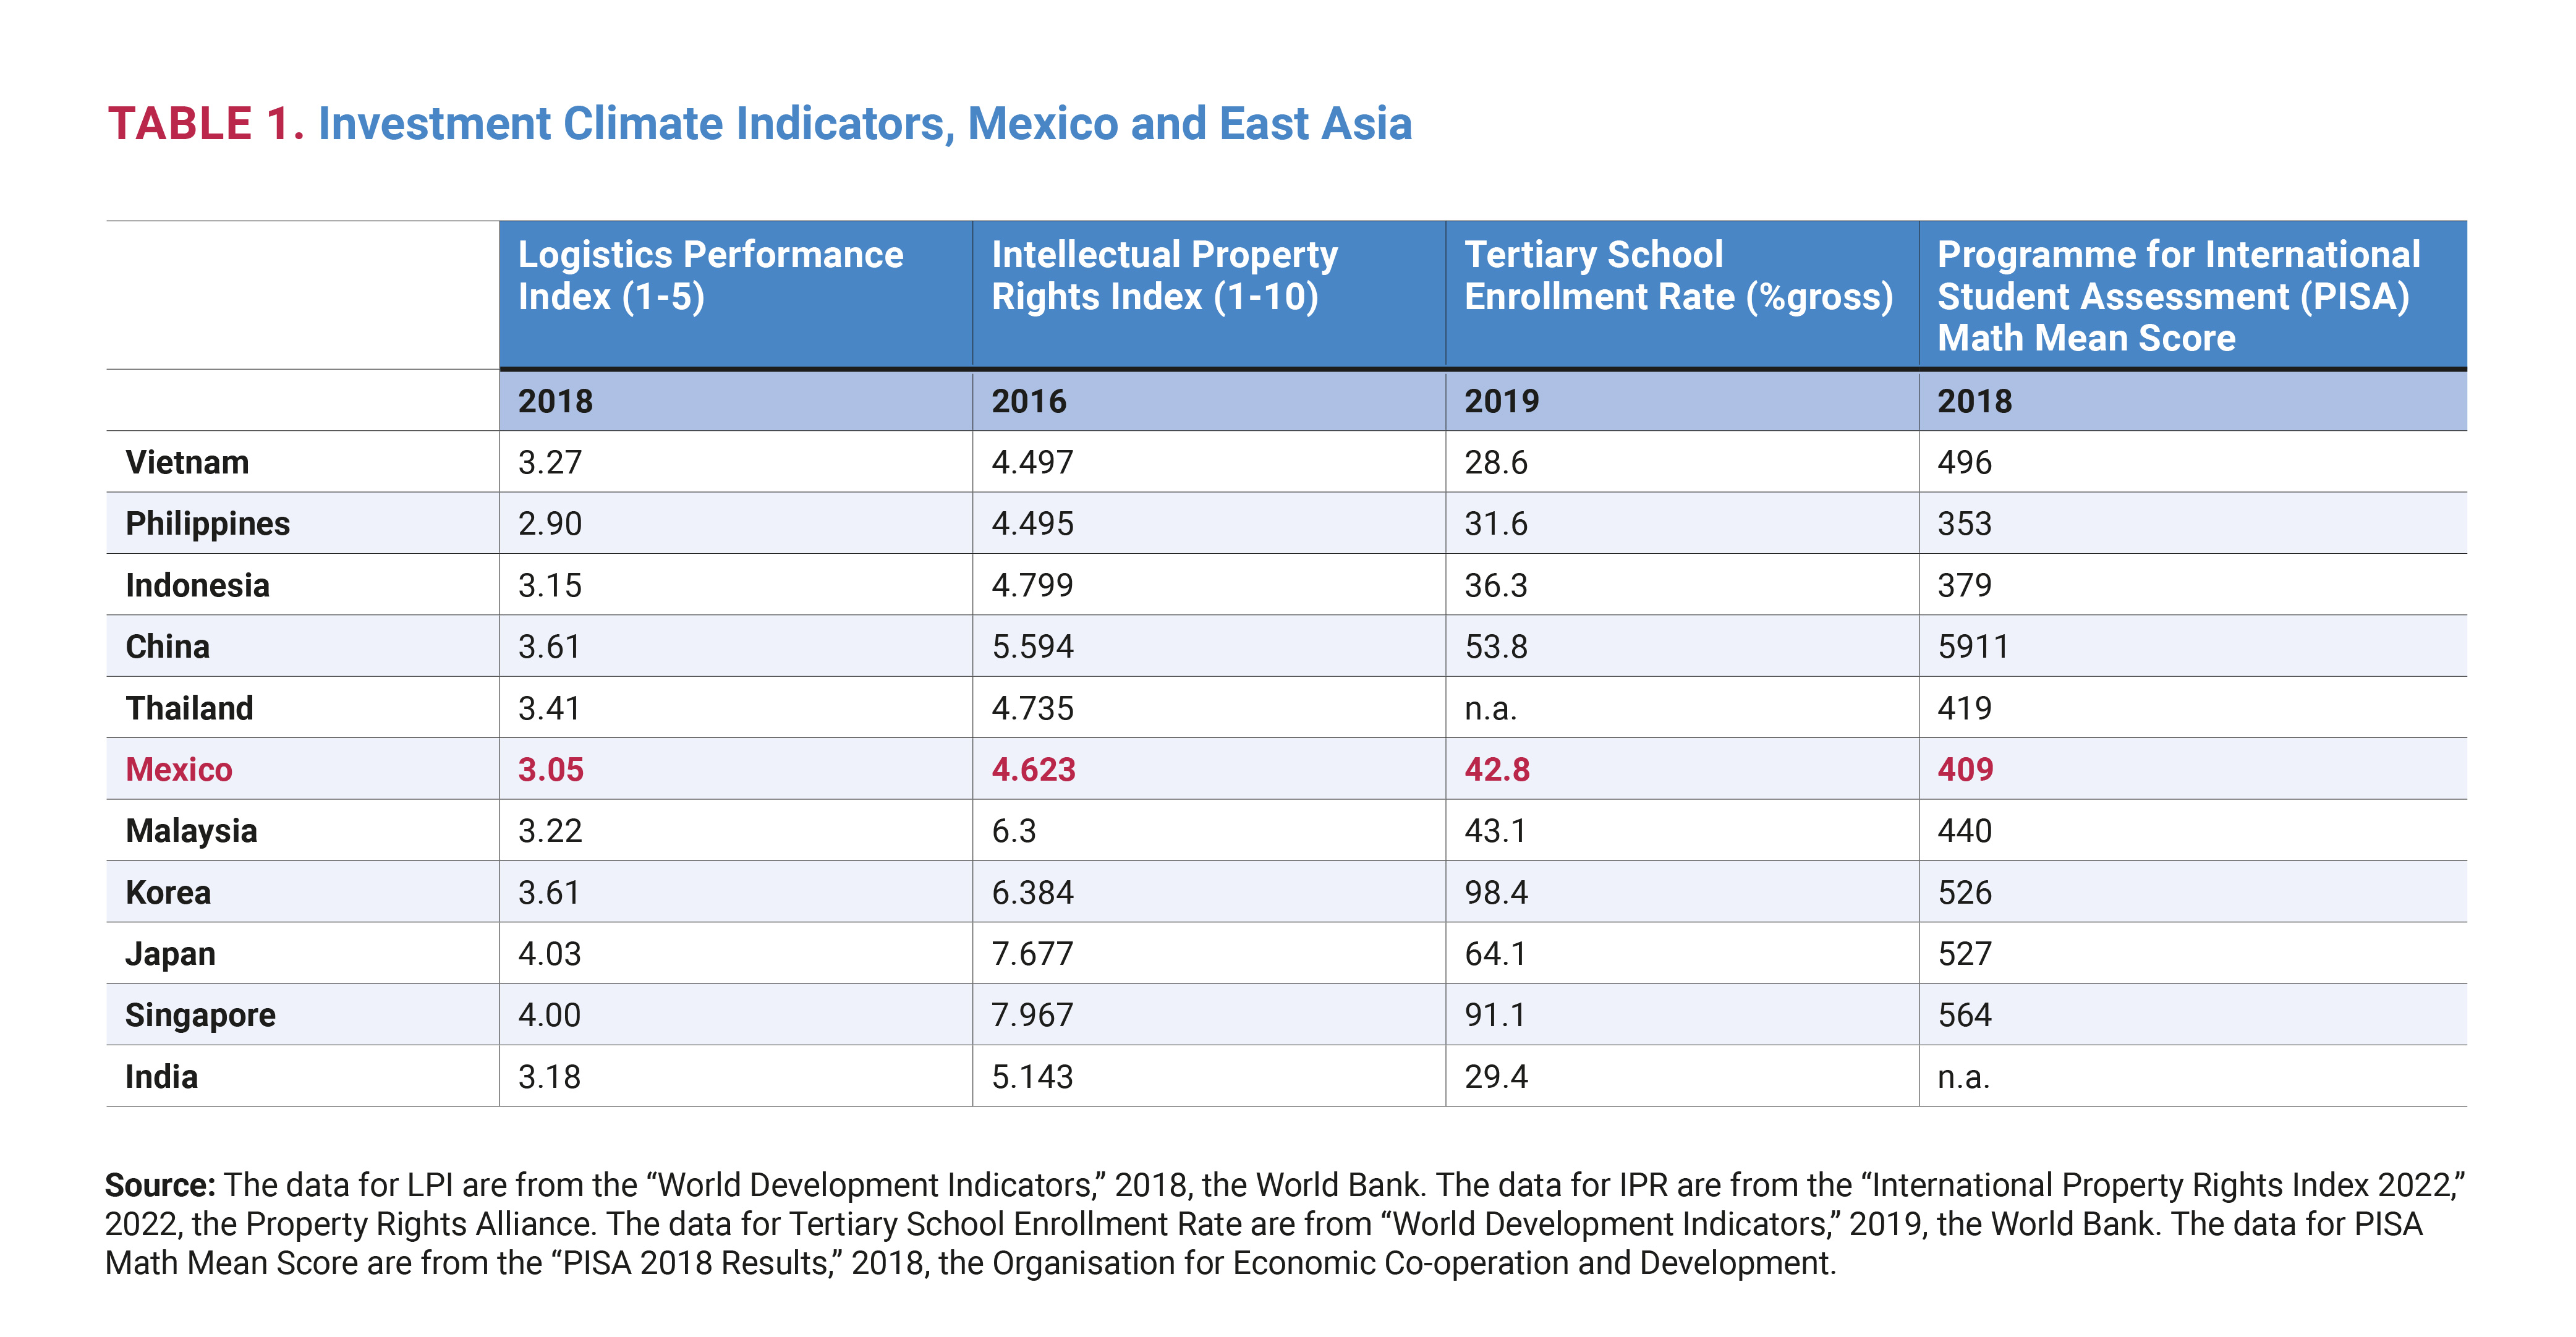
Mexico has various weaknesses in its investment climate. For example, Schott (2021) considers Mexico’s potential as a manufacturing hub, but finds it hampered by investment climate weaknesses: “intrusive Mexican business regulations, inadequate and irregular power supplies, and clogged road and rail networks.” The U.S. State Department’s 2021 assessment of Mexico’s investment climate likewise notes that “uncertainty about contract enforcement, insecurity, informality, and corruption continue to hinder sustained Mexican economic growth.”
Another important issue is intellectual property rights (IPR) protection. Multinational corporations (MNCs) are bringing their intellectual property to the value chains and reasonably good IPR protection is one factor that attracts them to particular locations. Developing countries typically have weaker protection than advanced economies, but among developing countries there is much variation. China stands out with relatively good IPR protection. At the other end of the spectrum, Mexico is rather poor. This hampers the potential for significant near-shoring back to North America. Vietnam looks pretty good on all the measures, which is why it has received most of the shift in production occasioned by the tech war. But it would need to improve in all areas if it wants to keep expanding its role in supply chains, especially hi-tech ones.
Finally, there is the important issue of human capital. The table includes two indicators: Tertiary school enrollment rate and PISA math scores. China stands out as having outstanding human capital indicators, with tertiary enrollment and PISA scores analogous to developed countries such as Japan and Korea. The PISA testing covers only Beijing, Shanghai, and some coastal provinces, but still these areas have a population of hundreds of millions. The outstanding human capital, plus excellent logistics and relatively good IPR protection, explains China’s position at the center of manufacturing value chains. Human capital weaknesses hold back countries such as India, Indonesia, Thailand, the Philippines, and Mexico. Suffice it to say at this point that there is no evidence of a surge in Mexican manufacturing as a result of shifts in value chains.
References
D. Dollar (2022). “Evolution of Global Supply Chains in an Era of Uncertainty,” paper prepared for the ADB Institute Annual Conference, Tokyo.
E. Prasad, 2014. The Dollar Trap: How the U.S. Dollar Tightened Its Grip on Global Finance, Princeton U. Press.
Schott, J. 2021. “Can Mexico help bring supply chains back to North America?” Peterson Institute for International Economics. Sep 21, 2021. https://www.piie.com/blogs/trade-and-investment-policy-watch/can-mexico-help-bring-supply-chains-back-north-america.
U.S. Department of State. 2021. 2021 Investment Climate Statements: Mexico. https://www.state.gov/reports/2021-investment-climate-statements/mexico/.
White House, State of the Union Address, 2022.
Y. Xing, E. Gentile, and D. Dollar, eds., Global Value Chain Development Report 2021: Beyond Production, ADB, 2021.
Viewpoints
Liz Shuler details how the USMCA can be a starting point for resilient and sustainable supply chains, domestic manufacturing, and good jobs in America.
Related