Good morning Chairman Alexander, Ranking Member Murray, and distinguished Members of the Committee. Thank you for giving me the opportunity to be here today to share my thoughts on this very important issue.
My name is Beth Akers. I am a fellow at the Brookings Institution where I carry out research on the topic of higher education, with a particular focus on student loans. I’ve been engaged in research related to higher education policy since 2008 when, in my role as Staff Economist at the Council of Economic Advisers, I assisted the Department of Education as they quickly implemented the Ensuring Continued Access to Student Loans Act. My testimony is informed by the time that I’ve spent engaged as a researcher in this field, first as a graduate student in the Economics Department at Columbia University and then as a Fellow at the Brookings Institution.
Background
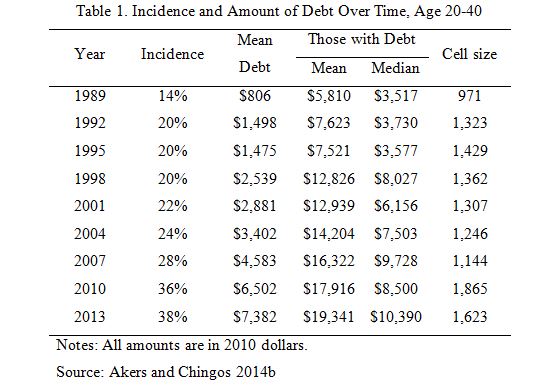
Over the past two decades there’s been a dramatic increase in the share of young U.S. households with education debt. The incidence has more than doubled, from 14 percent in 1989 to 38 percent in 2013 (Table 1). Not only are more individuals taking out education loans, but they are also taking out larger loans. Among households with debt, the mean per-person debt more than tripled, from $5,810 to $19,341 during the same period (2010 dollars). Median debt grew somewhat less rapidly, from $3,517 to $10,390 (Figure 1, Table 1). Among all households, including those with no debt, mean debt increased eightfold, from $806 to $7,382 (Table 1).
Figure 1. Trends in Education Debt over Time, 1989-2013
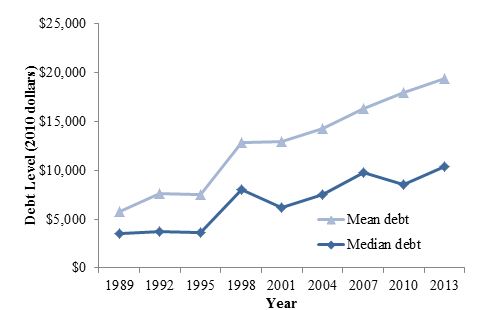
Notes: Based on households age 20-40 with education debt.
Source: Akers and Chingos 2014b
Only a trivial number of households had more than $20,000 in debt (per person) in 1989/1992, whereas in 2013, almost one third of those with debt had balances exceeding $20,000 (the change in the distribution is illustrated in Figure 2). The incidence of very large debt balances is greater now than it was two decades ago, but it is still quite rare. In 2013, seven percent of households with debt had balances in excess of $50,000 and two percent had balances over $100,000 (Akers and Chingos 2014b).
Figure 2. Distribution of Debt, 1989/1992 and 2013
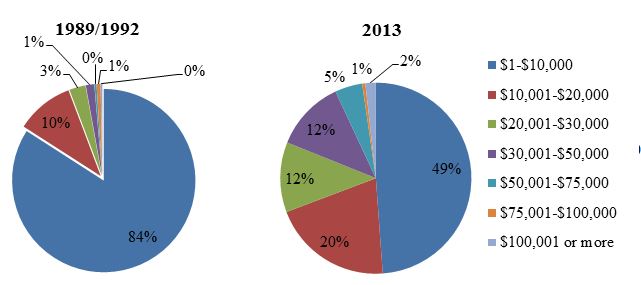
Notes: Based on households age 20-40 with education debt. All amounts are in 2010 dollars.
Source: Akers and Chingos 2014b
The large increases in education debt levels over the last two decades are often attributed to the increases in tuition charged by colleges and universities. There is also evidence that college students are relying more on debt to finance college costs and paying less out-of-pocket (Greenstone and Looney 2013b), suggesting that student behavior is changing in ways that favor loans over other ways of paying for college. Furthermore, there have been shifts in the level of educational attainment and demographic characteristics of the U.S. college-age population that could impact observed student borrowing. Estimates suggest that roughly one-quarter of the increase in student debt since 1989 can be directly attributed to Americans obtaining more education (both through increased enrollment and increased levels of attainment) while increases in tuition can explain 51 percent of the increase in debt observed during this period (Akers and Chingos 2014a).
Recognizing that the increases in borrowing are driven by multiple factors, some of which are less concerning than others, highlights an important point. The growth in student loan debt is often discussed as a problem in and of itself. However, to the extent that borrowers are using debt as a tool to finance investments in human capital that pay off through higher wages in the future, increases in debt may simply be a benign symptom of increasing expenditure on higher education. On the contrary, if these expenditures were spent in ways that don’t pay dividends in the future, then the observed growth in debt may indicate problems for the financial future of borrowers.
Evidence on Affordability
Positive Return on Investment
The most direct way to examine whether borrowers are using debt to finance investments that will pay off is to measure the financial return that their investment will yield in terms of lifetime earnings (relative to what they would have earned if they had not enrolled in a program of higher education) and compare it to the upfront cost of enrollment. Despite the recent recession, the significant economic return to college education continues to grow, implying that many of these loans are financing sound investments. In 2011, college graduates between the ages of 23 and 25 earned $12,000 more per year, on average, than high school graduates in the same age group, and had employment rates 20 percentage points higher. Over the last 30 years, the increase in lifetime earnings associated with earning a bachelor’s degree has grown by 75 percent, while costs have grown by 50 percent (Greenstone and Looney 2010). There is also an earnings premium associated with attending college and earning an associate’s degree or no degree at all, although it is not as large (Greenstone and Looney 2013a). These economic benefits accrue to individuals, but also to society, in the form of increased tax revenue, improved health, and higher levels of civic participation (Baum, Ma, and Payea 2013).
Studies that seek to identify the causal relationship between education and earnings draw similar conclusions. A recent study, published by researchers at the Federal Reserve Bank of New York in 2014, suggested that the financial return on a college degree, when expressed as a rate of return, was 15 percent and had held steady at that level (a historic high) for the previous decade. A valuable insight from this work is that the return on college has not fallen, despite the growing cost of attendance and stagnant earnings growth across the economy. This counterintuitive result is driven by the decline of earnings among workers without college degrees (Abel and Deitz, 2014). These statistics indicating large financial returns on investments in higher education suggest that, for the average student, college will pay for itself in the long run.
Month-to-month Affordability of Student Debt
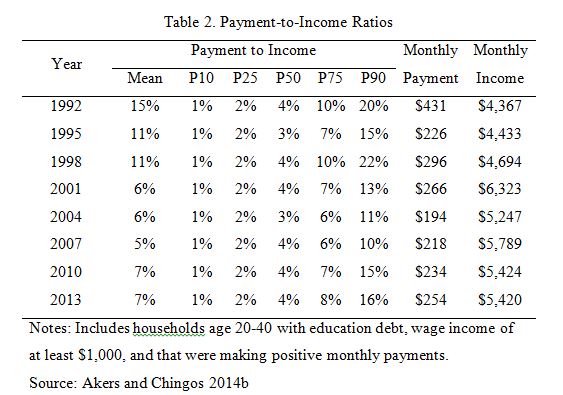
The long run financial return is an important indicator of affordability, but it could potentially obscure more transient challenges faced by households. For example, an increase in debt may be affordable in the long run but impose monthly payments that squeeze borrowers in the short run, especially early in their careers when earnings are low. However, month-to-month affordability of student debt does not seem to have declined in recent history. The ratio of monthly payments to monthly income has been flat over the last two decades (Figure 3, Table 2). Median monthly payments ranged between three and four percent of monthly earnings in every year from 1992 through 2013. Mean monthly payments, which are larger than median payments in each year due to the distribution being right-skewed, declined from 15 percent in 1992 to 7 percent in 2013 (Akers and Chingos 2014b).
Figure 3. Monthly Payment-to-Income Ratios, 1992-2013
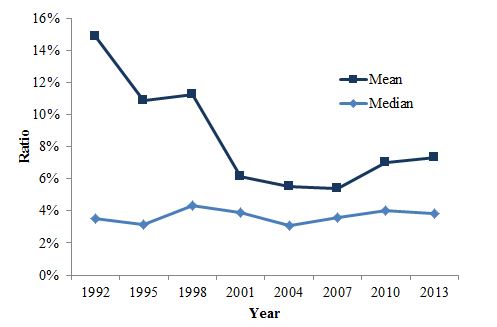
Notes: Based on households age 20-40 with education debt, wage income of at least $1,000, and that were making positive monthly payments.
Source: Akers and Chingos 2014
The ratio of monthly payments to monthly income stayed roughly the same over time, on average, at each percentile and for each education category. By this measure, the transitory burden of loan repayment is no greater for today’s young workers than it was for young workers two decades ago. If anything, the monthly repayment burden has lessened.
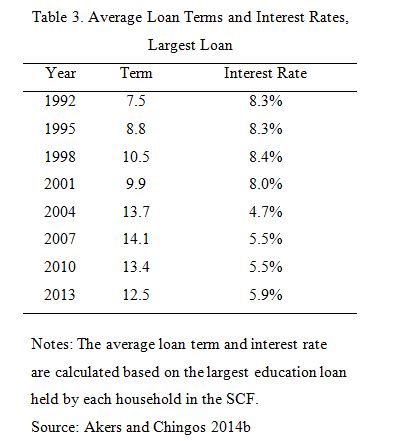
This surprising finding can be explained in part by a lengthening of average repayment terms during the same period. In 1992, the mean term of repayment was 7.5 years, which increased to 12.5 years in 2013. This increase was likely due primarily to loan consolidation, which increased dramatically in the early 2000s (Department of Education 2014, S-16). Loans consolidated with the federal government are eligible for extended repayment terms based on the outstanding balance, with larger debts eligible for longer repayment terms. Average interest rates also declined during this period, which would also lower monthly payments (Table 3).
In order to appreciate how much of a burden monthly payments place on households, it’s useful to compare student debt payments to other household expenses. In Figure 4 average monthly student loan payment (based on data from 2010) is plotted together with the average monthly expenditure in each major consumption category (this data comes from the 2012 Consumer Expenditure Survey, which is administered by the Bureau of Labor Statistics). The largest categories of monthly consumption expenditure are housing ($1,407), transportation ($750) and food ($588). Monthly student loan payments are relatively small compared to these expenses, and at $242, are closer in scale to monthly spending on entertainment ($217), apparel ($145) and health care ($296). There is relatively little variation in monthly loan payments (due to consolidation with longer repayment terms for larger debts) (Akers 2014a).
Figure 4. Average Monthly Expenditures and Student Loan Payments
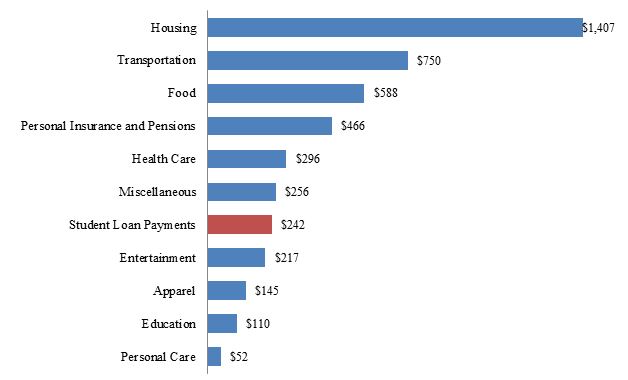
Data: 2010 Survey of Consumer Finances and 2012 Consumer Expenditure Survey
Source: Akers 2014a
Student Debt is a Poor Indicator of Economic Hardship
It might seem reasonable to be most concerned about the plight individuals with large outstanding student loan balances, but evidence suggests that these individuals may not be faring any worse than households with smaller balances or no student debt at all. The highest rates of financial distress, as indicated by late payments on household financial obligations, are seen among households with the lowest levels of student loan debt. Households with large debts tend to have higher levels of educational attainment and earnings, on average, and miss bill payments less often. Among households with outstanding education debt in the lowest quartile of the debt distribution ($0 – $3,386), 34 percent report having made a late payment on a financial obligation in the past year compared with 26 percent of households with education debt in the highest quartile (≥$18,930). Households with student loan debt do not show indications of financial distress more often than households without student loan debt (Akers 2014b).
Conclusions
This body of evidence contradicts the notion that a crisis of college affordability exists on a macro level. However, it is undeniable that many individuals and households are facing serious economic hardship that can be explained completely or in part by their spending on higher education. Like any other investment, the returns to higher education are not guaranteed. While the average student will see a large financial return on the dollars they spend on higher education, some students will find that their investment won’t pay off. We can reduce the frequency of this occurrence by ensuring that students have the information and resources they need in order to make good decisions about college enrollment. For instance, a national level data base that reports earnings by institution would succeed in helping student to avoid enrolling at institutions that do not have a track record of success. This would succeed in creating more institutional accountability without additional government intervention.
An additional way to improve outcomes for students is to simplify the federal lending program both on the front end, with the menu of services, and also on the backend with a more streamlined system of repayment. Recent work on this issue has revealed that students have relatively little understanding of their financial circumstances while they are enrolled in college. About half of all first-year students in the U.S. seriously underestimate how much debt they’ve taken on. Even more concerning is the fact that among all first-year students with federal student loans, 28 percent report having no federal debt and 14 percent report that they have no debt at all (Akers and Chingos 2014c). Removing the complexity of the federal aid system could potentially succeed in making it easier for students to comprehend their circumstances and to make better informed decisions.
However, some of the uncertainty about the payoff of college is unavoidable. For example, some students will invest in developing skills that will ultimately become obsolete due to unanticipated technological or policy innovation. It’s important that the government provide insurance against these types of occurrences both for the sake of ensuring individual welfare and also to discourage debt aversion among potential students. Income driven payment programs, like the ones currently in place for the federal student lending program, are the appropriate tool for providing a safety net to borrowers.
In sum, college is affordable in the sense that on average it will pay for itself in the long run with heightened wages. However, to ensure that college is universally affordable ex-post, it’s necessary to maintain a robust system of income driven repayment such that students are insured against their investment not paying off. Lastly, we need to ensure that both the system of federal lending and the safety nets that exist to support it are simple enough that the benefits of these policy innovations can be fully realized.
References
Jaison R. Abel and Richard Deitz, “Do the Benefits of College Still Outweigh the Costs?” Federal Reserve Bank of New York Current Issues in Economics and Finance, vol. 20, no. 3 (2014), available at http://www.newyorkfed.org/research/current_issues/ci20-3.html.
Elizabeth Akers and Matthew M. Chingos. 2014a.“Is a Student Loan Crisis on the Horizon?” Brown Center on Education Policy, Brookings Institution, available at https://www.brookings.edu/research/reports/2014/06/24-student-loan-crisis-akers-chingos.
Elizabeth Akers and Matthew M. Chingos. 2014b. “Student Loan Update: A First Look at the 2013 Survey of Consumer Finances.” Washington, DC: Brown Center on Education Policy, Brookings Institution, available at https://www.brookings.edu/research/papers/2014/09/08-student-loan-update-akers-chingos.
Elizabeth Akers and Matthew M. Chingos. 2014c. “Are College Students Borrowing Blindly?” Washington, DC: Brown Center on Education Policy, Brookings Institution, available at https://www.brookings.edu/research/reports/2014/12/10-borrowing-blindly-akers-chingos.
Elizabeth Akers. 2014a. “They Typical Household with Student Loan Debt.” Washington, DC: Brown Center on Education Policy, Brookings Institution, available at https://www.brookings.edu/research/papers/2014/06/19-typical-student-loan-debt-akers.
Elizabeth Akers, 2014b. “How Much is Too Much? Evidence on Financial Well-Being and Student Loan Debt.” Washington, DC: Center on Higher Education Reform, American Enterprise Institute, available at http://www.aei.org/publication/how-much-is-too-much-evidence-on-financial-well-being-and-student-loan-debt/.
Sandy Baum, Jennifer Ma and Kathleen Payea. 2013. “Education Pays, 2013.” Washington, DC: The College Board, available at https://trends.collegeboard.org/sites/default/files/education-pays-2013-full-report.pdf.
Department of Education. 2014. “Student Loans Overview: Fiscal Year 2015 Budget Proposal.” Washington, DC: U.S. Department of Education. http://www2.ed.gov/about/overview/budget/budget15/justifications/s-loansoverview.pdf (accessed June 13, 2014).
Michael Greenstone and Adam Looney. 2010. “Regardless of the Cost, College Still Matters.” Brookings on Job Numbers blog, October 5. https://www.brookings.edu/blogs/jobs/posts/2012/10/05-jobs-greenstone-looney.
Michael Greenstone, and Adam Looney. 2013a. “Is Starting College and Not Finishing Really that Bad?” Washington, DC: Brookings Institution, Hamilton Project, available athttp://www.hamiltonproject.org/files/downloads_and_links/May_Jobs_Blog_20130607_FINAL_2.pdf
Michael Greenstone, and Adam Looney. 2013b. “Rising Student Debt Burdens: Factors behind the Phenomenon.” Brookings on Job Numbers blog, July 5, available athttps://www.brookings.edu/blogs/jobs/posts/2013/07/05-student-loans-debtburdens-jobs-greenstone-looney.
Tables


Commentary
TestimonyReauthorizing the Higher Education Act: Ensuring College Affordability
June 3, 2015