

How to help young people transition into the labor market is receiving increased attention following the dramatic deterioration in employment among teens and young adults during and since the Great Recession.
The data below describe employment trends among young people aged 16 to 19 and 20 to 24 between 2000 and 2014 and updates previous research. According to a number of measures, teens and young adults are still struggling to gain traction in the labor market. Labor force participation and employment rates continue to trend downward, as do median annual earnings. The decline in labor force participation and employment rates was particularly pronounced among teens, and among young adults, those without post-secondary credentials fared the worst.
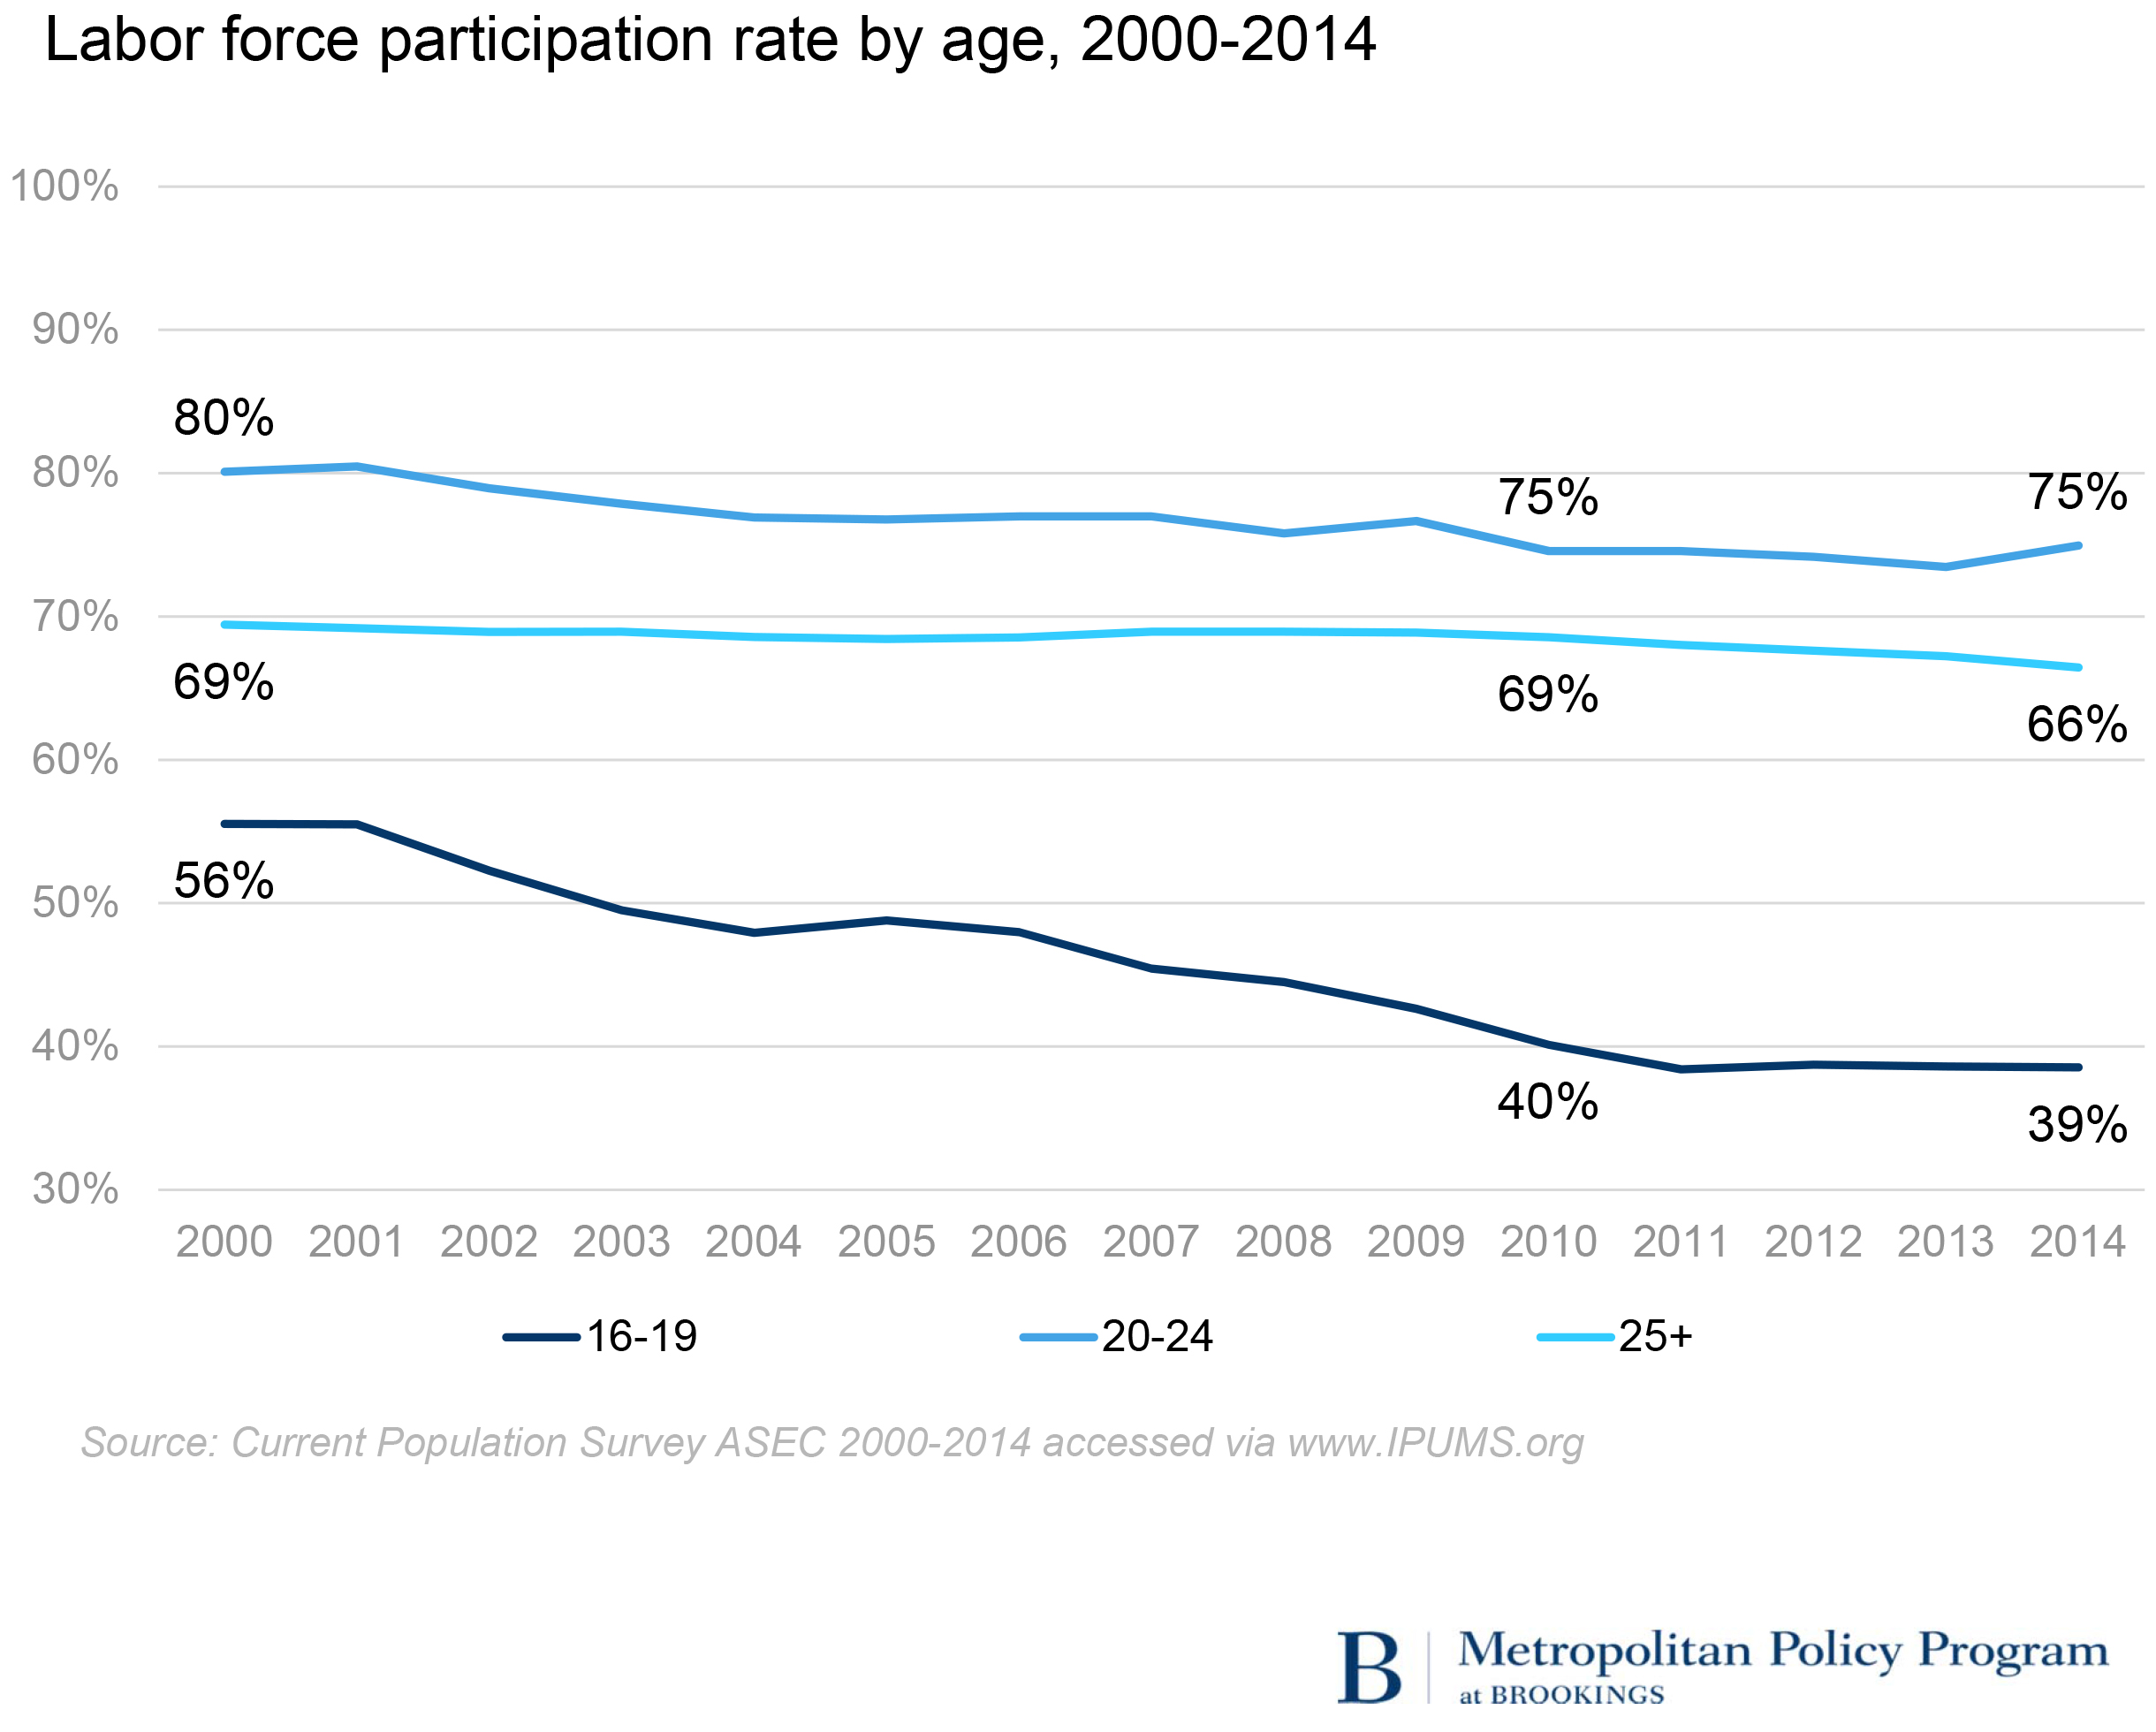
Labor force participation rates fell between 2000 and 2014 for all age groups, but most dramatically among teens
The labor force participation rate measures the share of the civilian non-institutionalized population that is either working or actively looking for work. Between 2000 and 2014, labor force participation rates were consistently highest among 20-24 year-olds, followed by individuals age 25 and over, and lowest among teens ages 16-19. Rates for teens fell by 17 percentage points between 2000 and 2014, compared to a drop of 5 percentage points among 20 to 24 year-olds and 3 percentage points among those aged 25 and older. Teens are expected to have lower labor participation rates than other age groups, as they are likely to be enrolled in school (generally high school) as their primary activity. Indeed, 84 percent of teens aged 16-19 were in school in 2014. Yet the vast majority of teens (80 percent) were also enrolled in school in 2000, when the teen labor force participation rate was much higher—56 percent, compared to 39 percent in 2014.
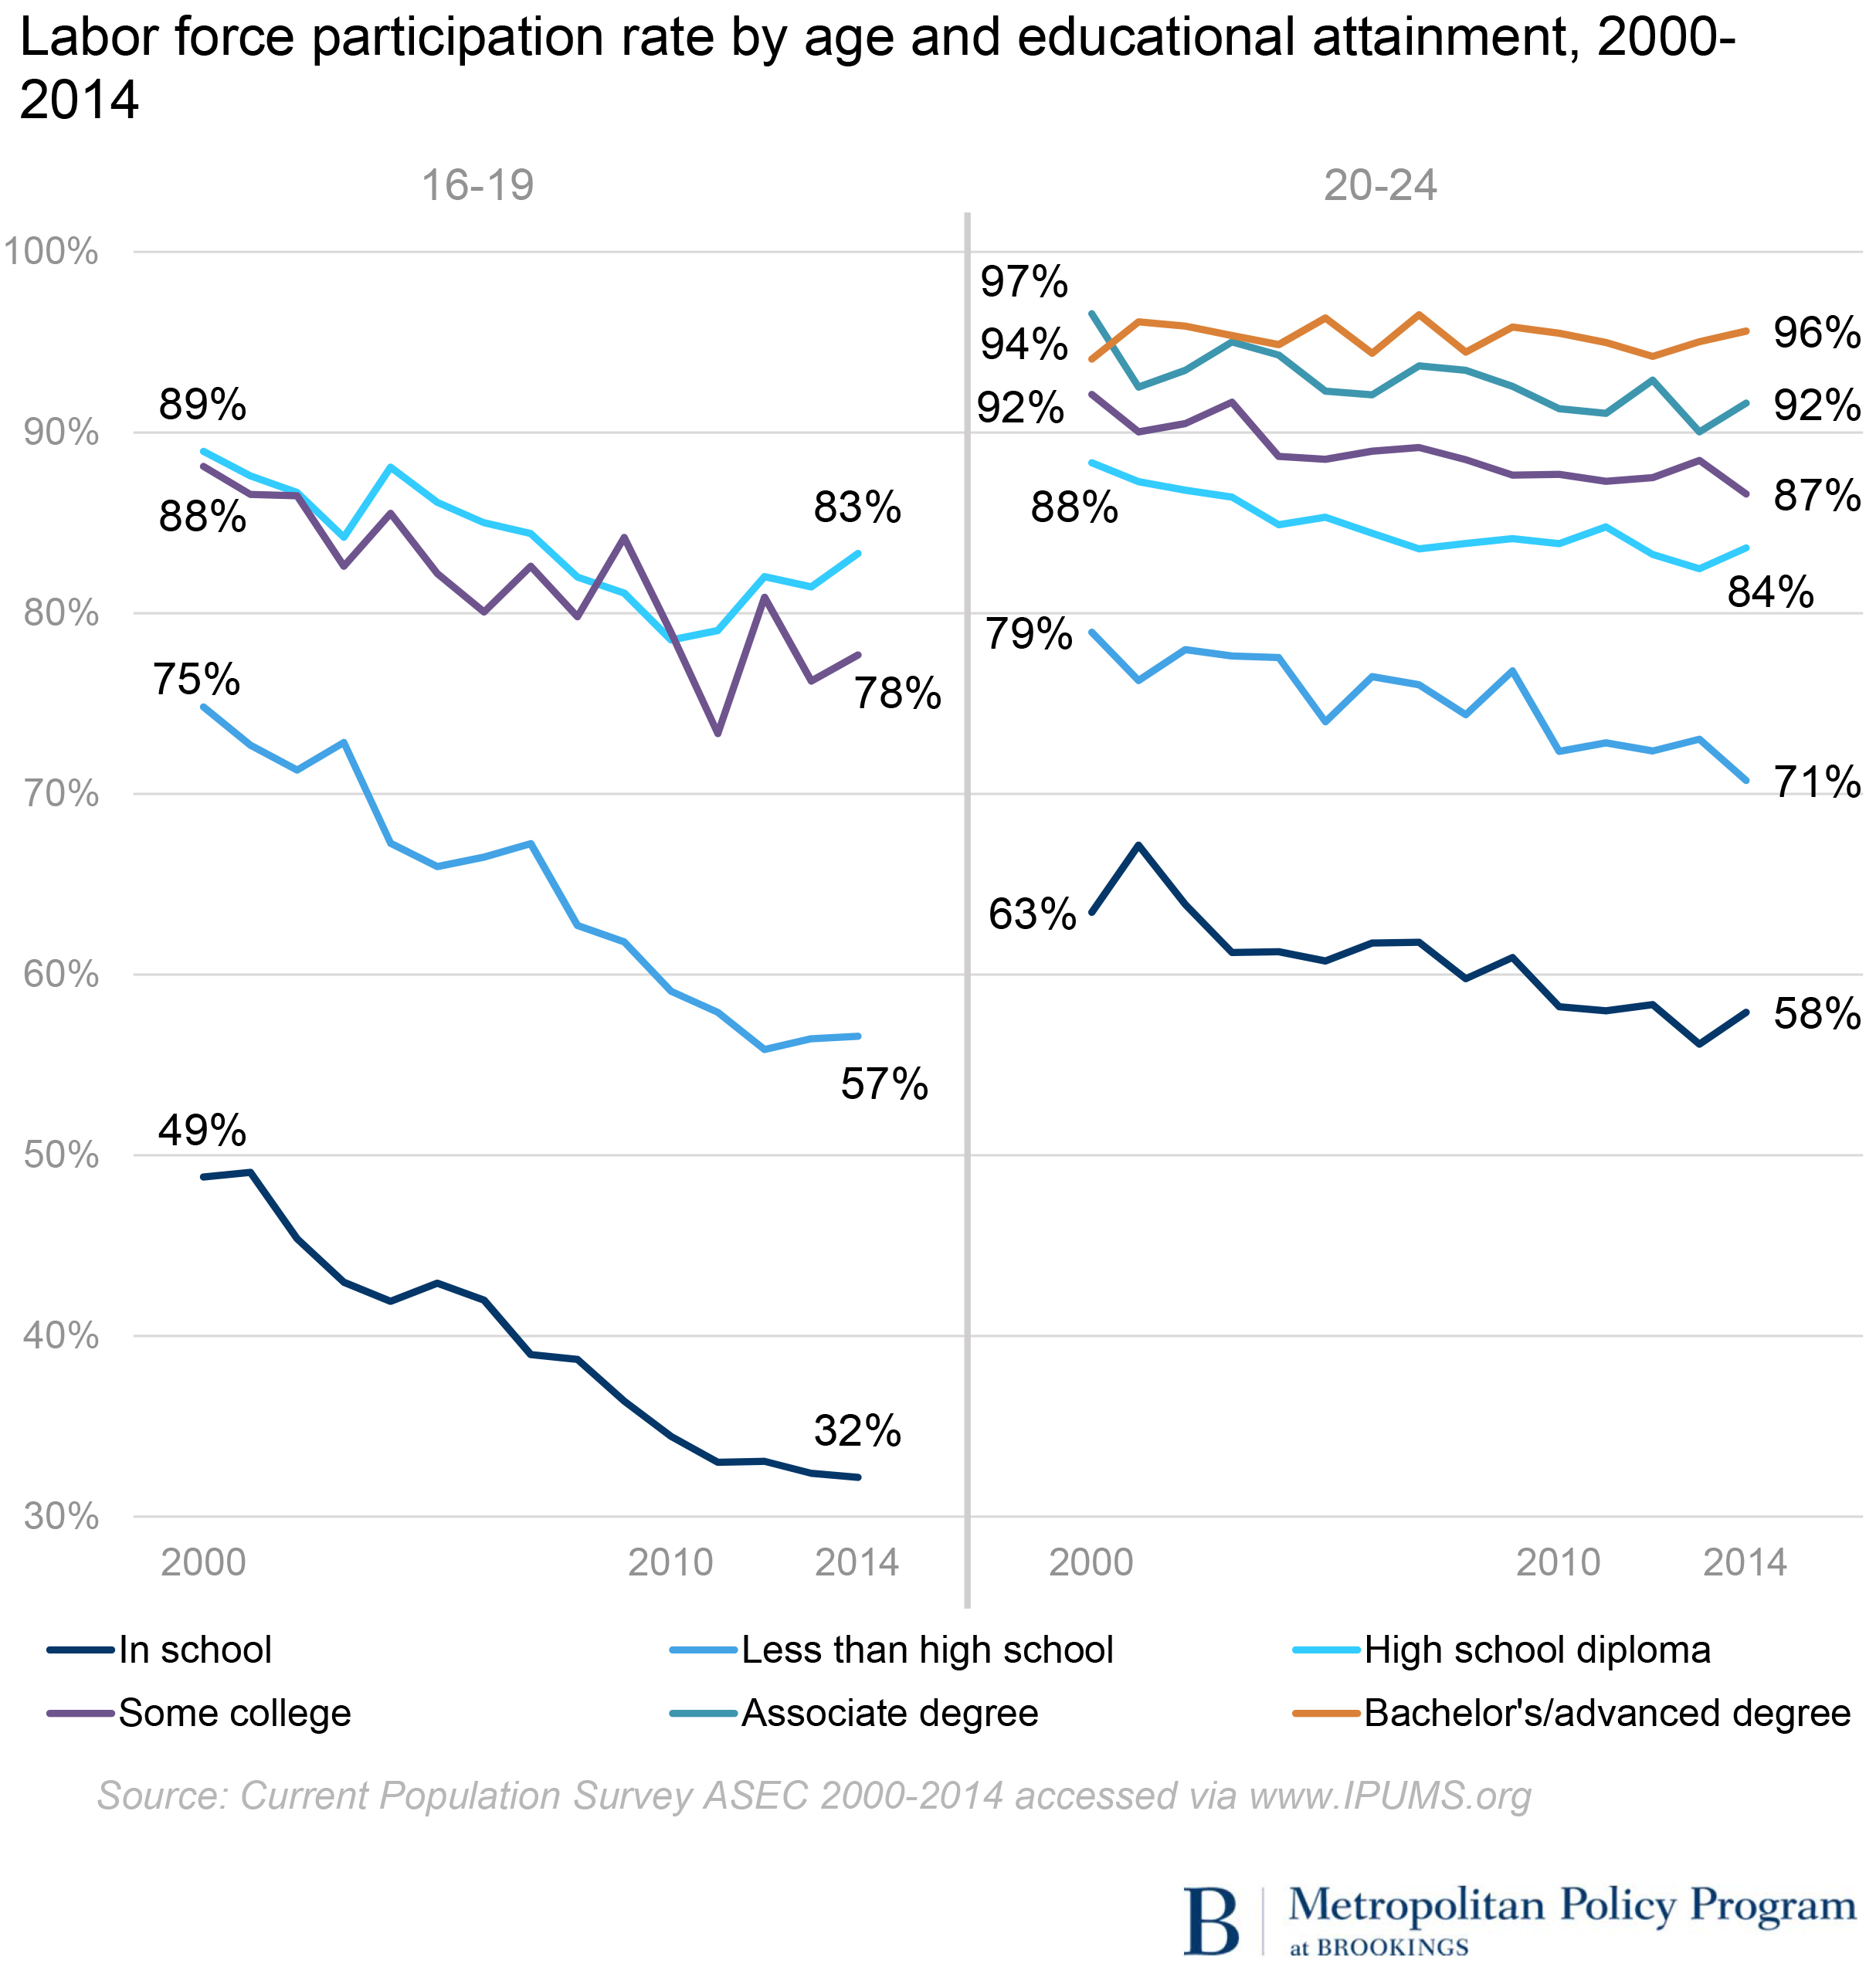
Among both teens and young adults aged 20-24, labor force participation is lowest among those enrolled in school. However, the rate is considerably higher among 20-24-year-olds than teens, showing that many young adults combine work and school, or would like to. Among both groups, the steepest drops in labor force participation were among those enrolled in school and those who dropped out of high school. While those enrolled in school may be dropping out of the labor force to focus on their studies, those without a high school diploma may have withdrawn from the labor force due to a lack of available jobs—especially good-paying jobs—given their skill level.
Looking specifically at post-recession trends, labor force participation rates declined by 2 percentage points among teens and adults over age 25 between 2010 and 2014. However, while labor force participation declined for most teens across educational categories, it increased 5 percentage points for high school graduates not enrolled in school. Among young adults, despite some fluctuation, the rate stood at 75 percent both in 2010 and 2014.
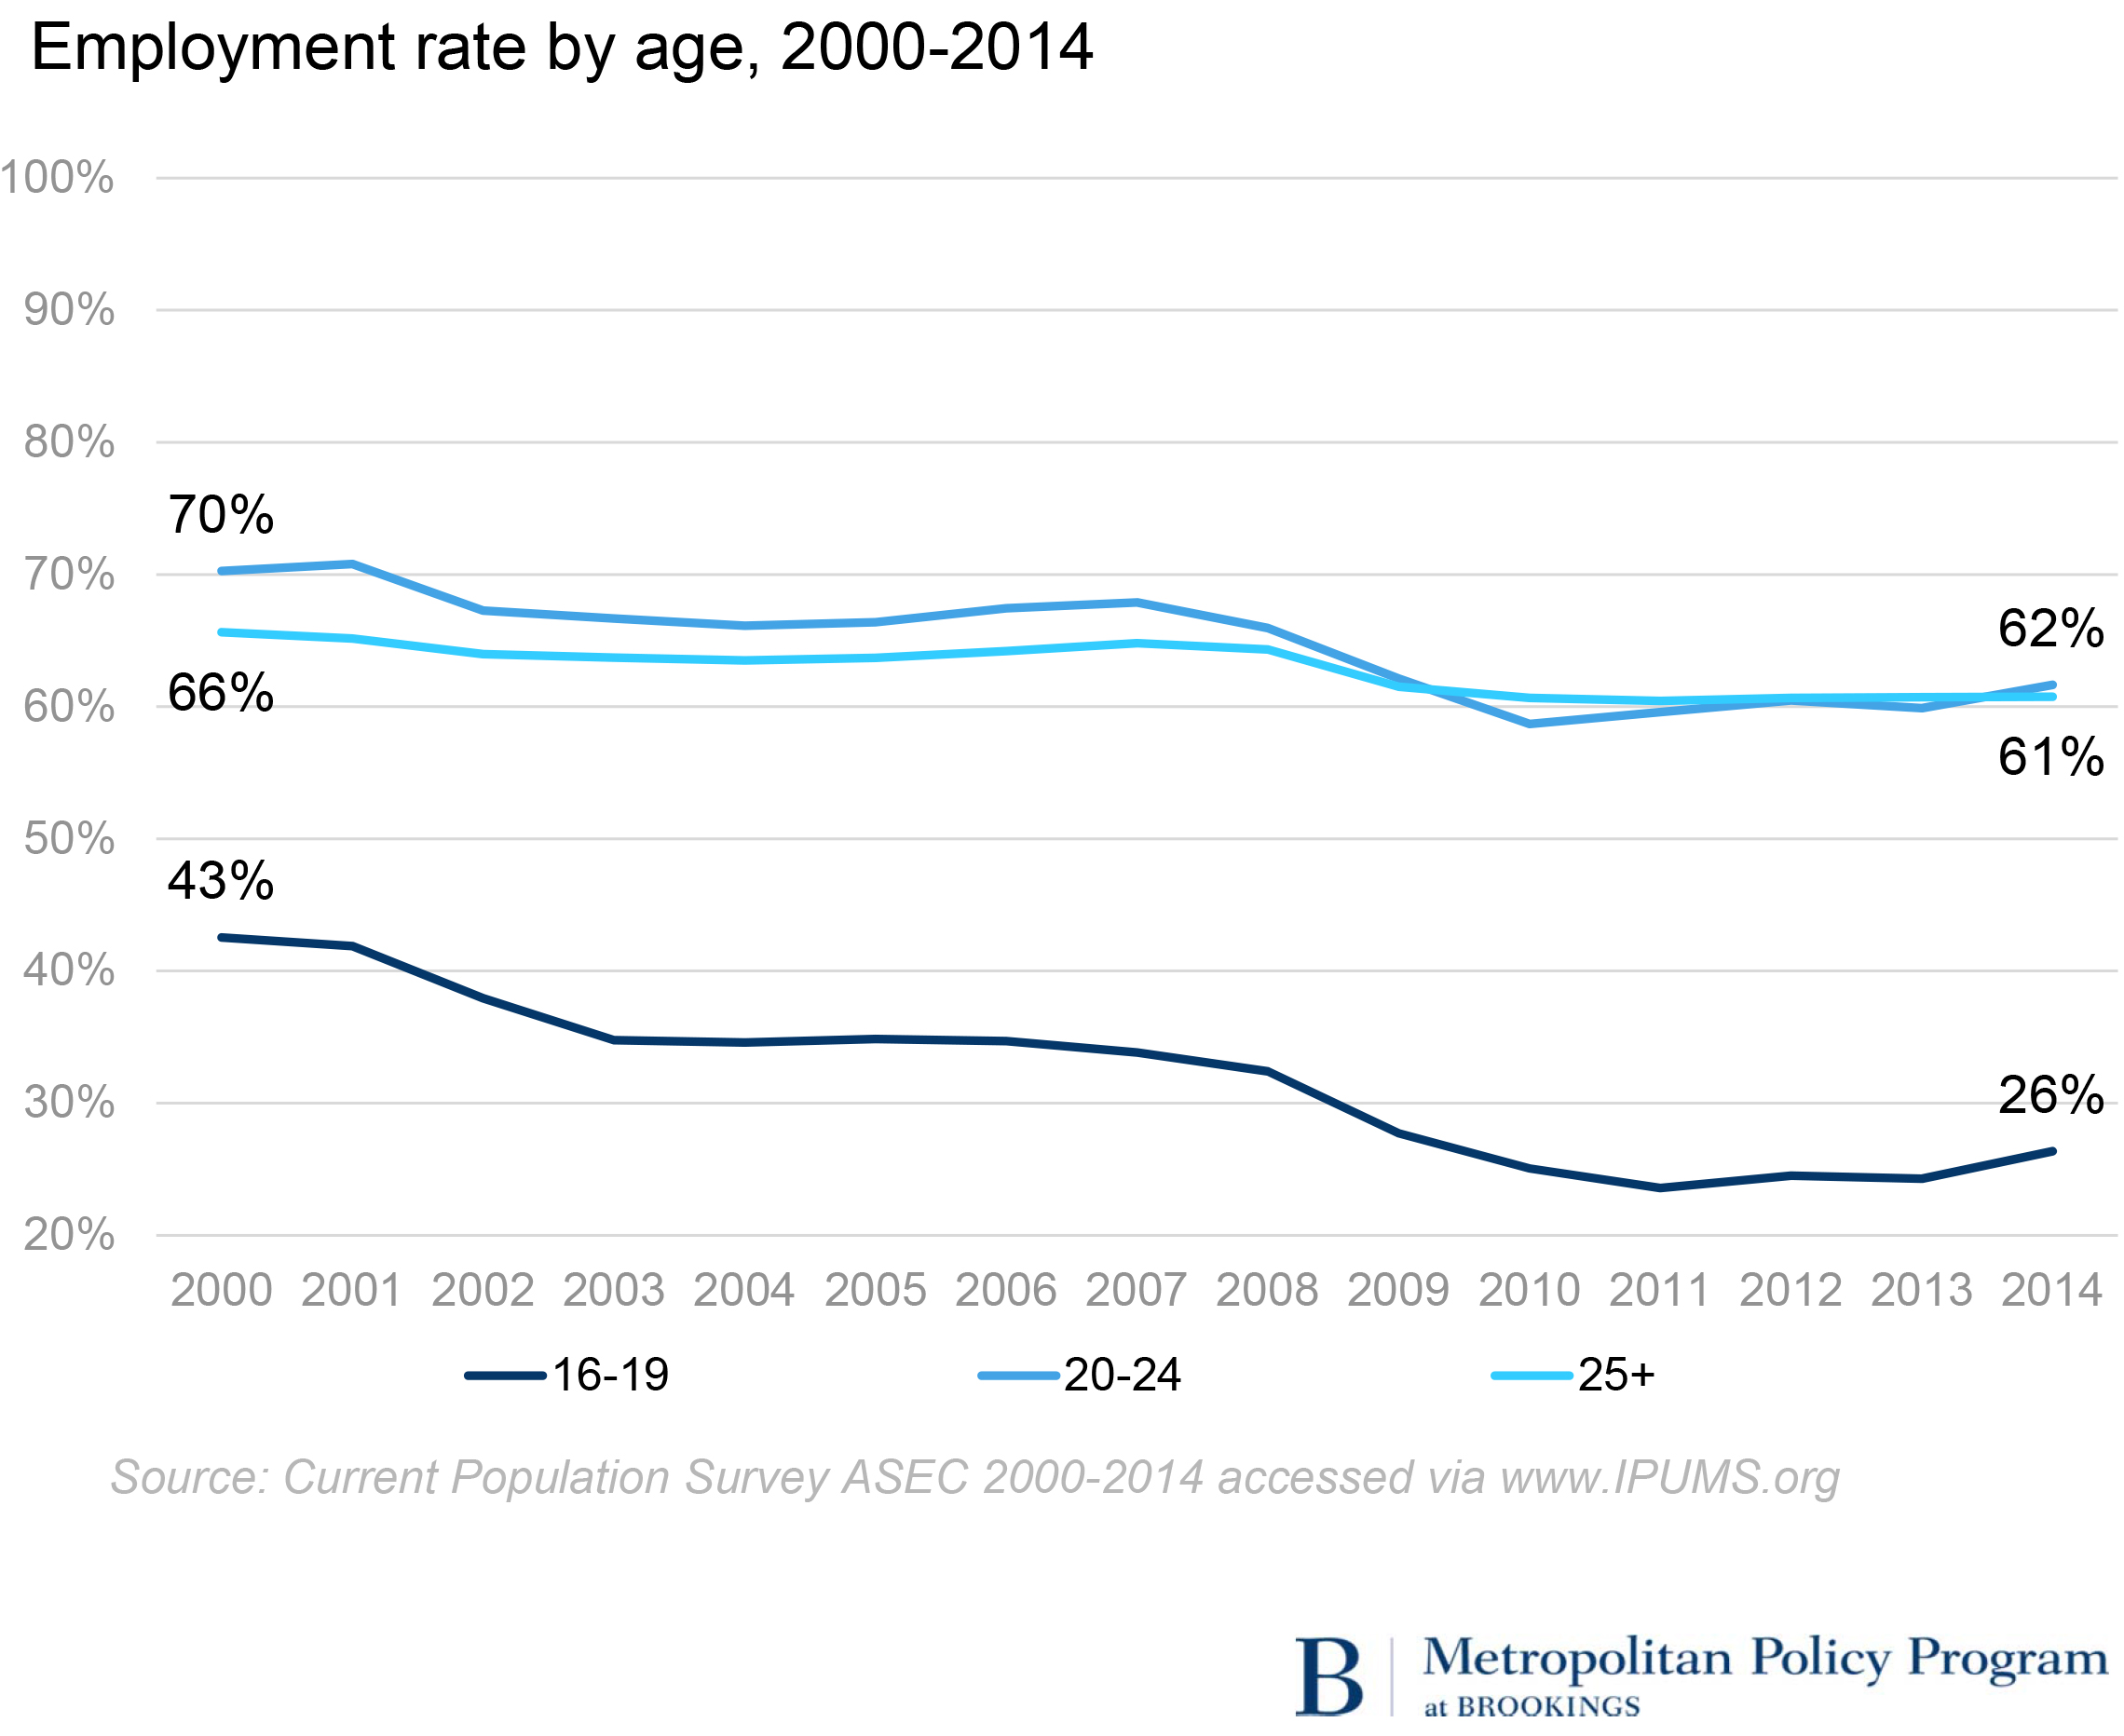
Employment rates also fell for all age groups, with the sharpest drop among teens
The employment rate is the share of the total civilian non-institutionalized population with a job. While 20 to 24-year olds had higher employment rates than those aged 25 and older in 2000, the gap narrowed over time and in 2014 they had similar employment rates—62 percent and 61 percent, respectively. Teens consistently had the lowest employment rate among the age groups and also experienced the steepest decline, falling 16 percentage points to 26 percent. In 2014, only one in four teens had a job.
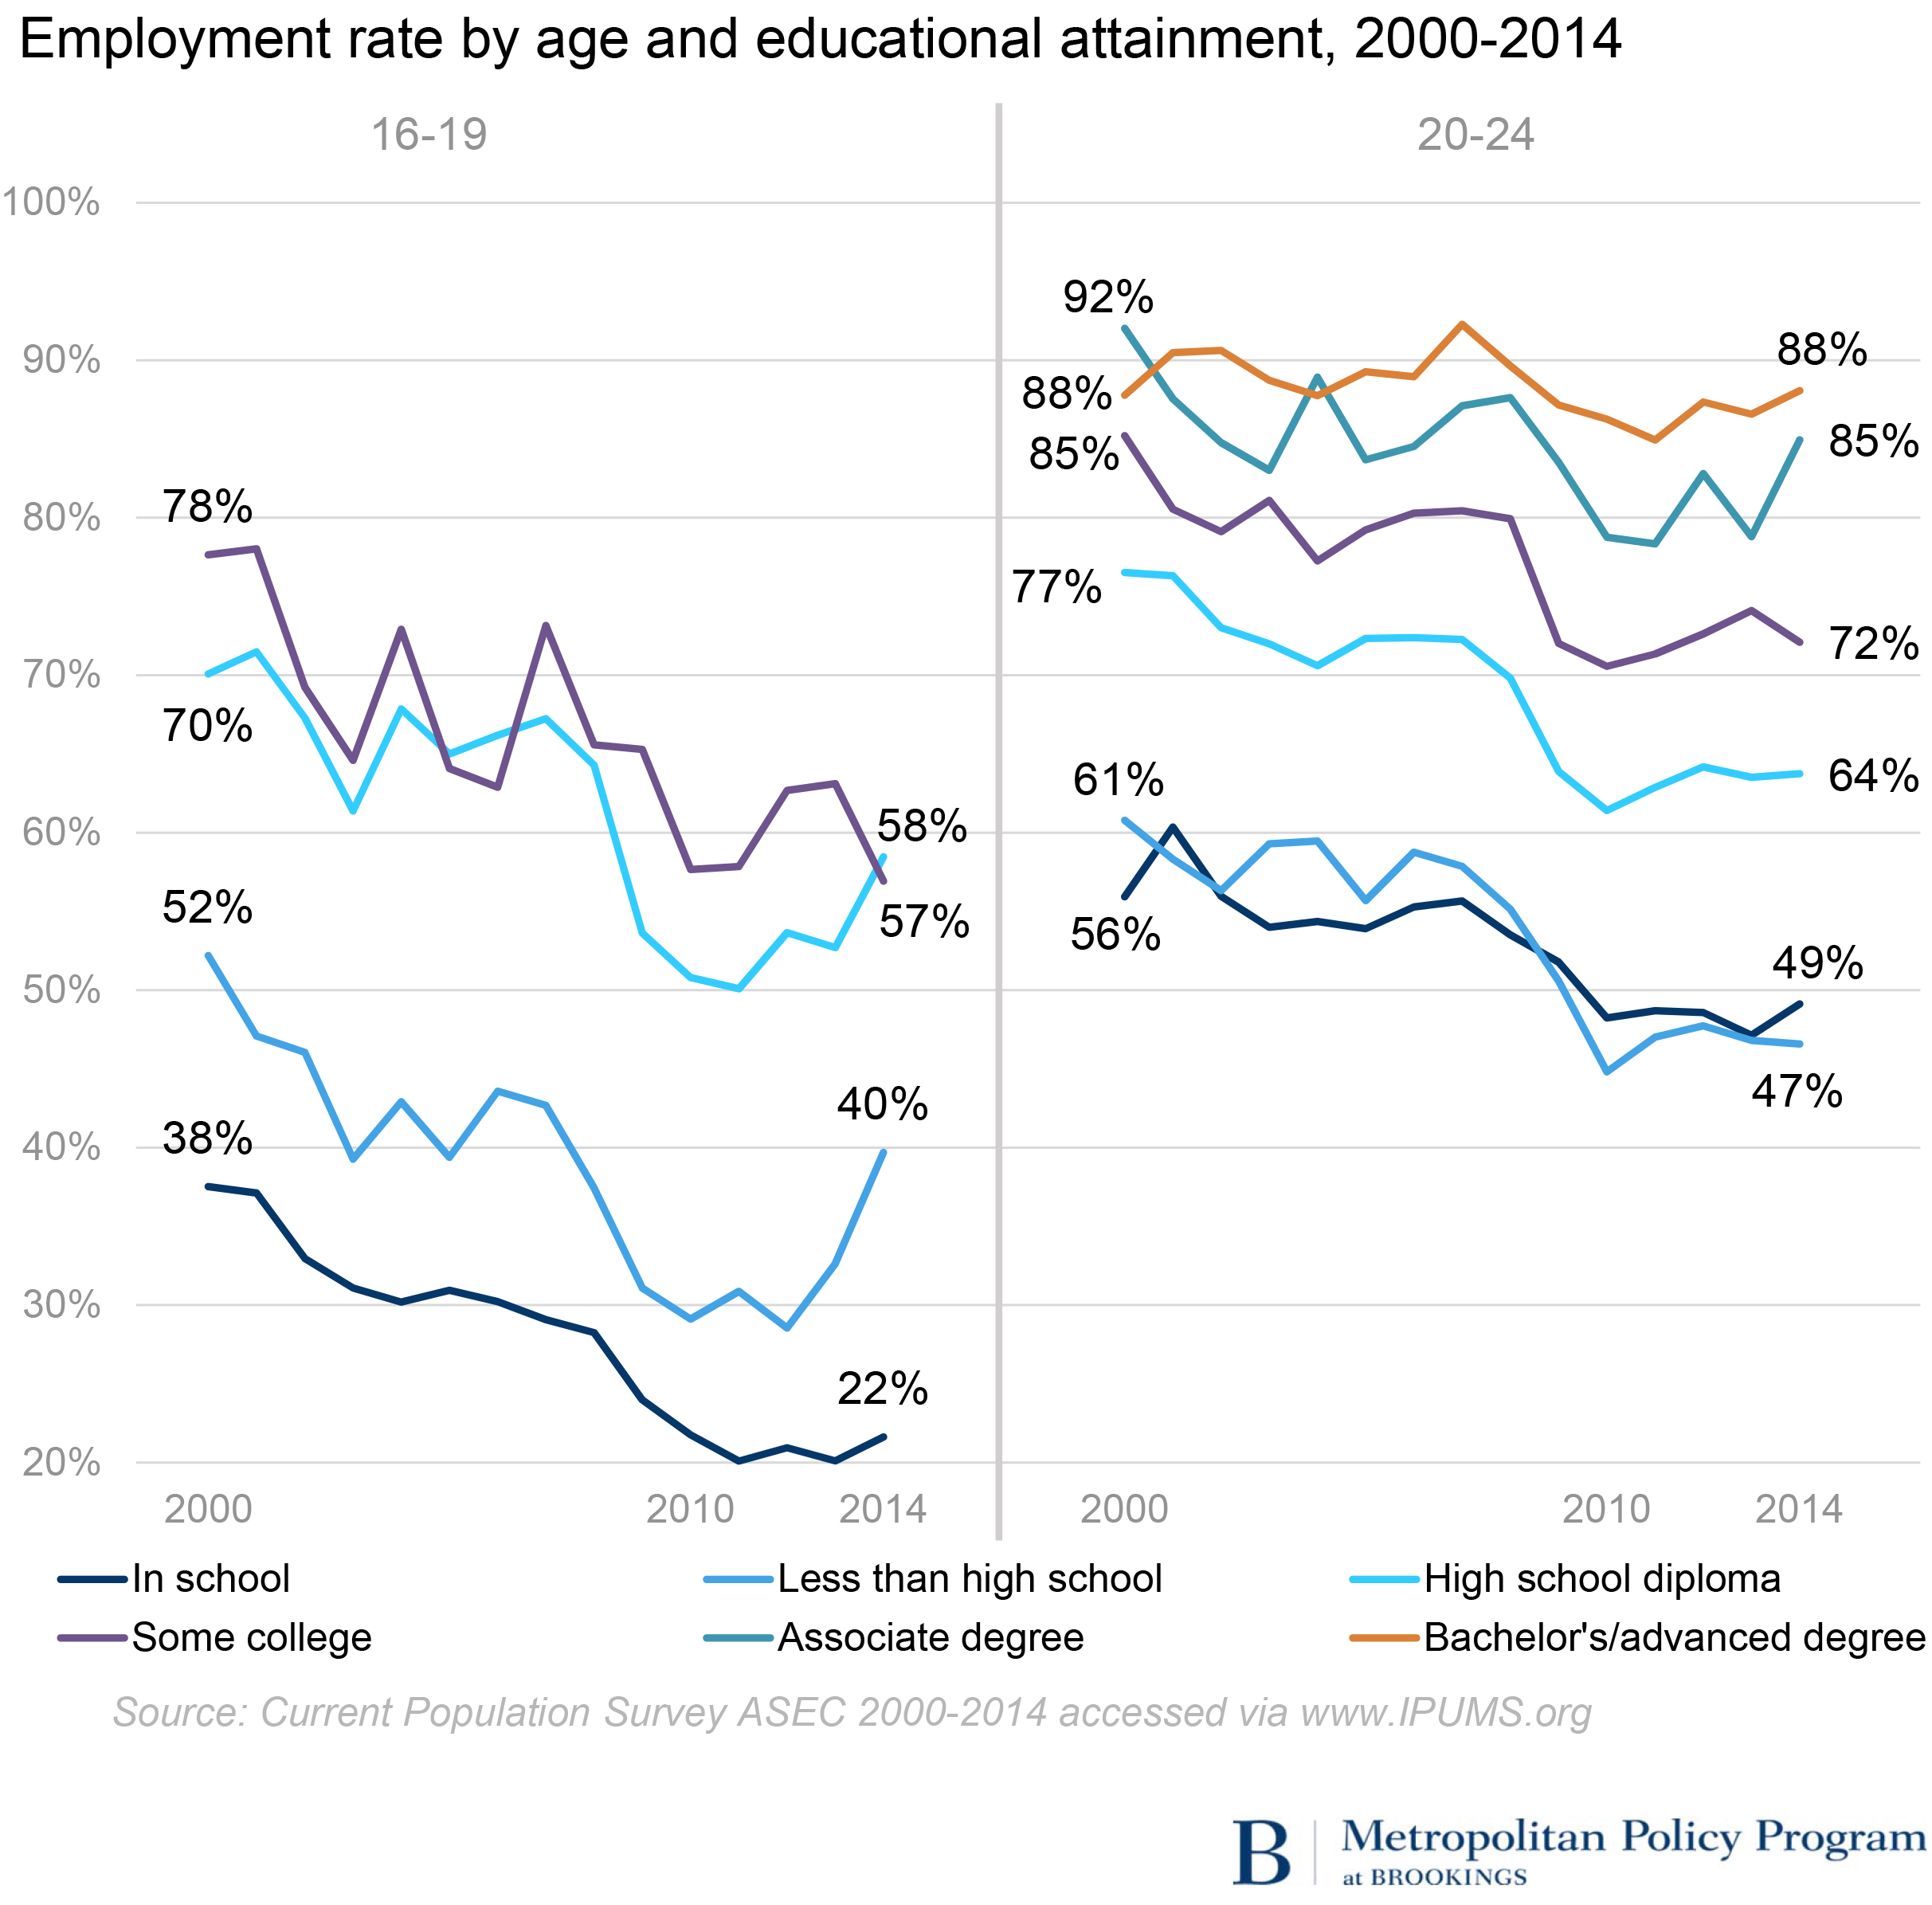
School enrollment and educational attainment affect employment rates among both teens and young adults. In general, employment rates are lower among those who are in school and increase as levels of educational attainment increase.
Among teens, the sharpest decline in employment rates occurred among those with some college education (21 percentage points) and those enrolled in school (16 percentage points).1 In 2014 only one in five teens in school had a job. Among young adults, those not in school and without a post-secondary degree had the largest declines. Those who had taken some college courses and those with a high school diploma or less all experienced declines between 13 and 14 percentage points. Young adults with bachelor’s degrees fared the best. While their rates fluctuated, they were the only group not to register a decline between 2000 and 2014, and their employment rate of 88 percent in 2014 was 41 percentage points higher than that for young adults without a high school diploma.
Over the post-recession period of 2010-2014, employment rates increased modestly for teens overall (1 percentage point), with larger increases among those with a high school diploma or less. Employment rates also rose among young adults (3 percentage points) and remained steady among workers over age 25.
Unemployment increased for all age groups, but is down from the highs associated with the Great Recession
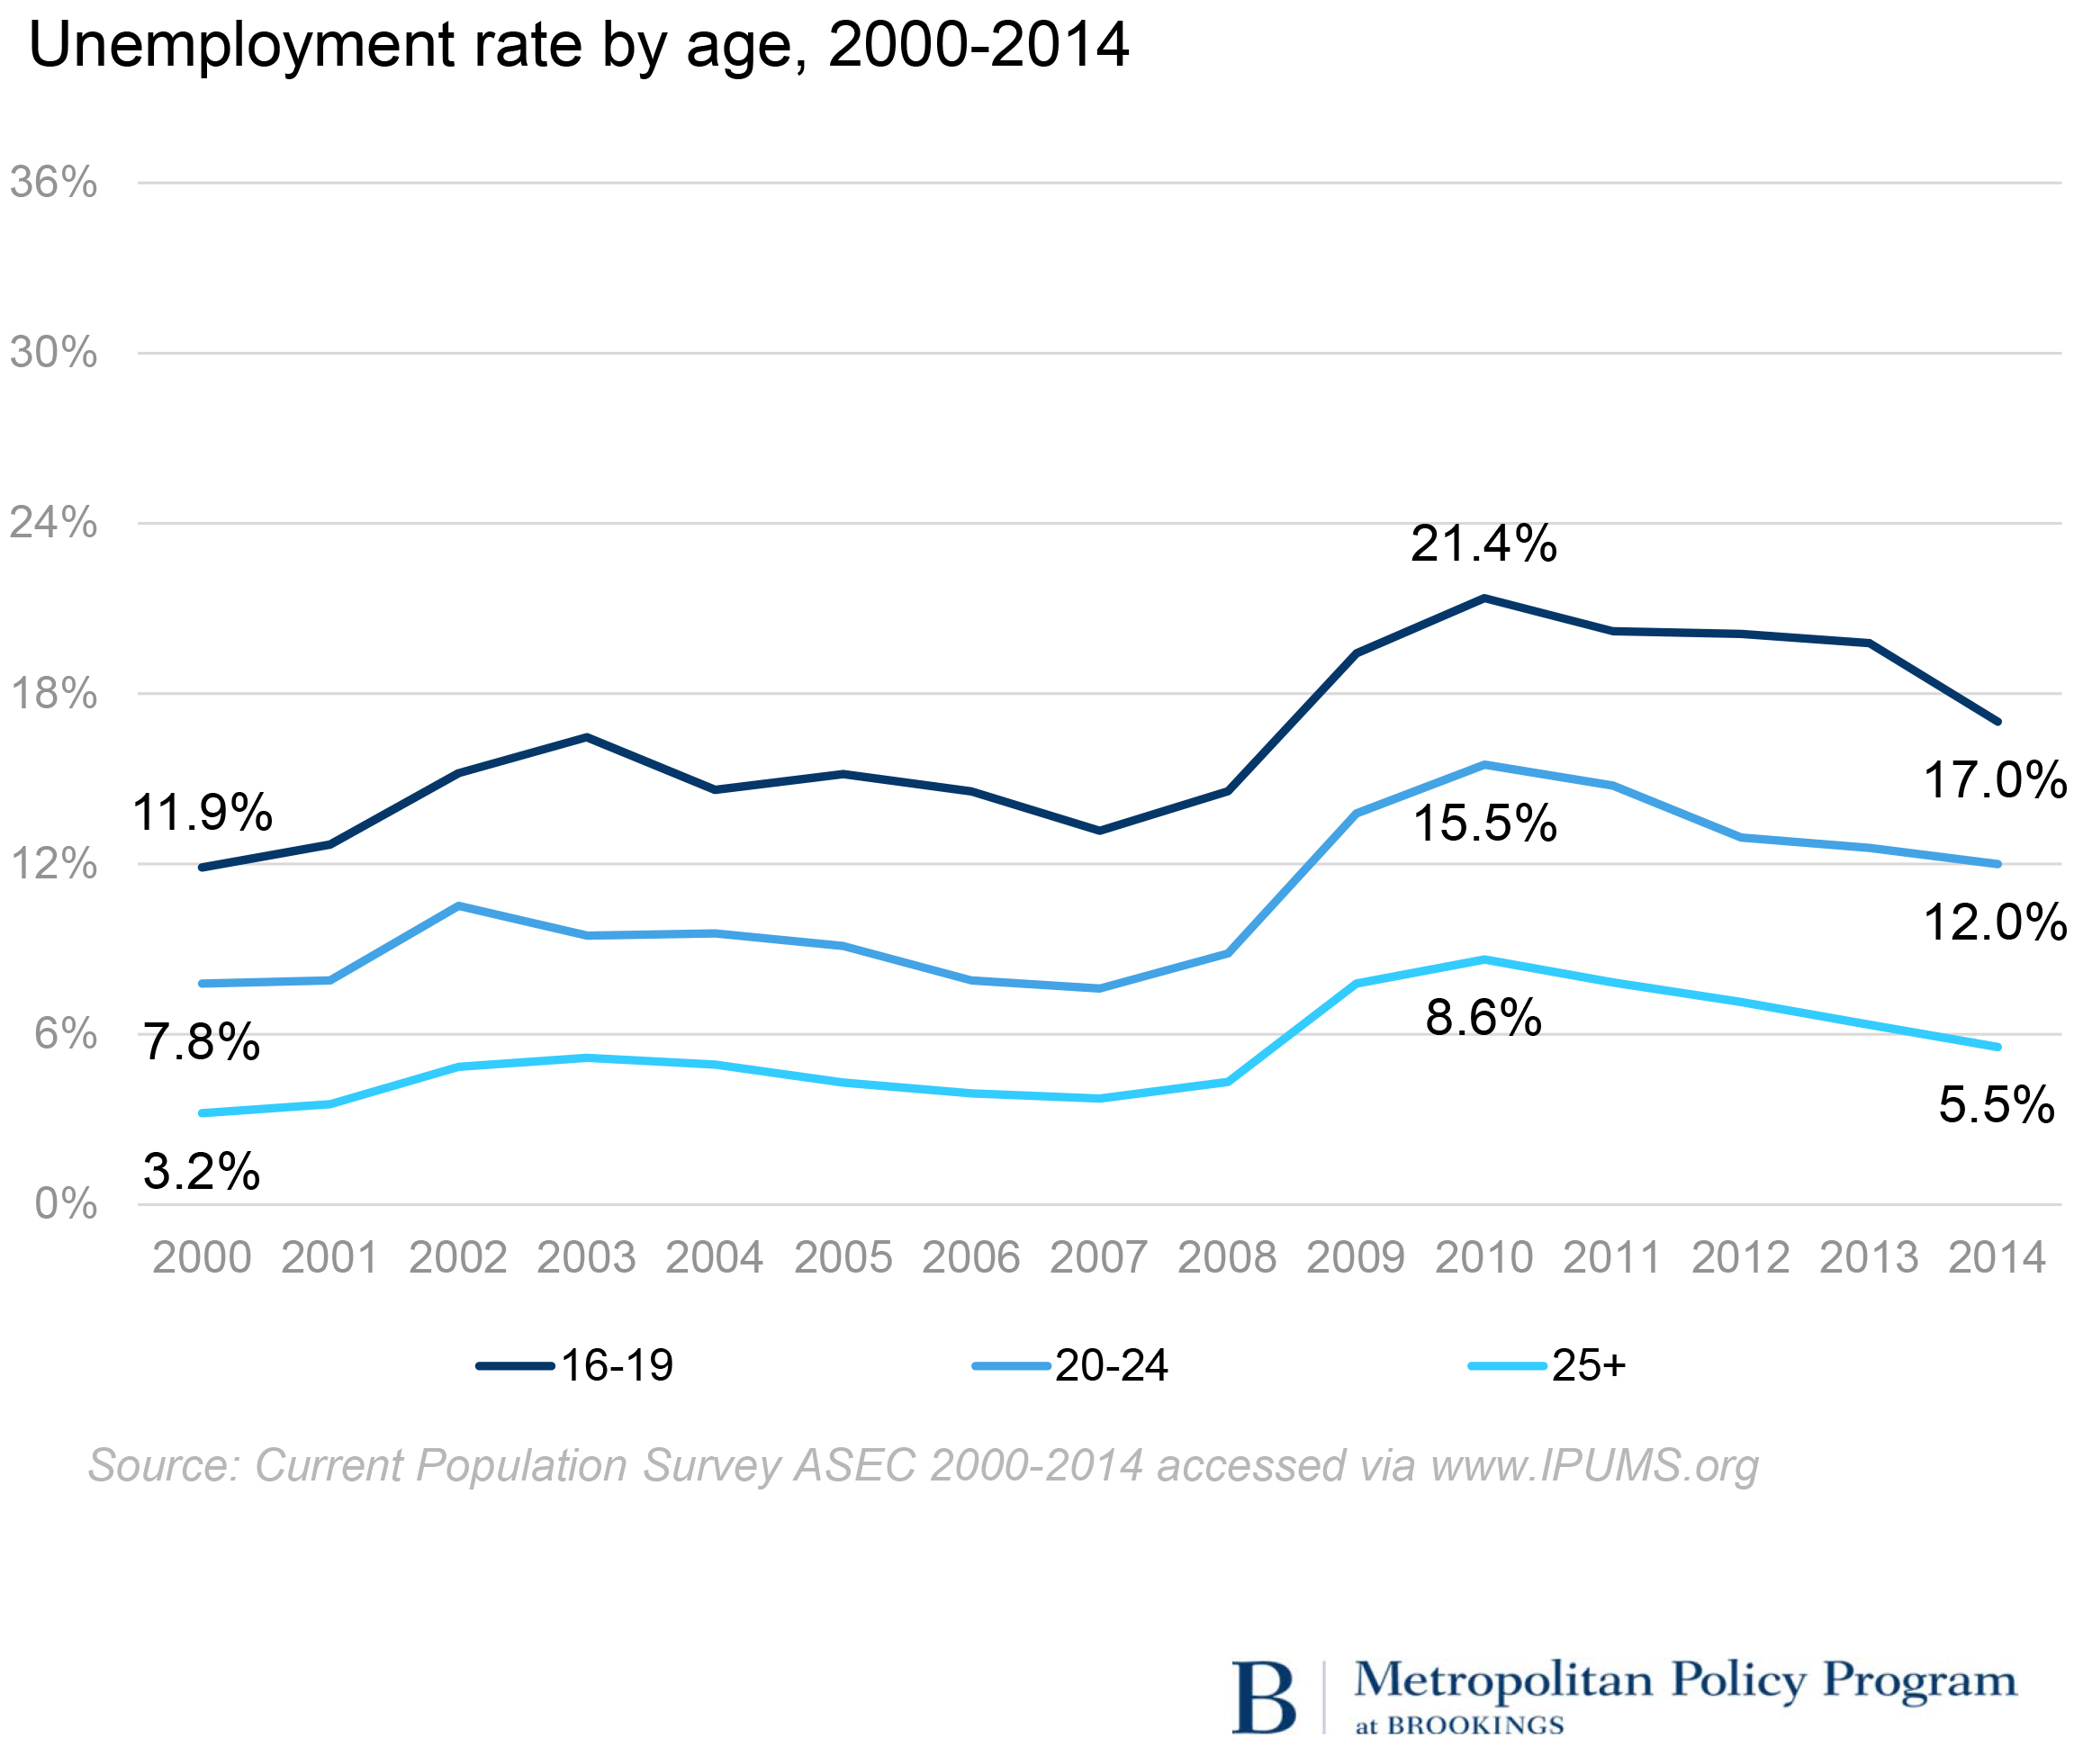
The unemployment rate is the share of the labor force without a job and actively looking for work. The data below indicate that although labor force participation rates are down, there is still an unmet desire for work.
As of 2014, unemployment rates were higher among teens (17.0 percent) and young adults (12.0 percent) than among adults over age 25 (5.5 percent), and unemployment rates among all age groups are down from their peak levels in 2010. However, as noted above, labor force participation rates have also been declining. While a drop in unemployment rates may reflect that people are finding jobs, it may also reflect that people are becoming discouraged, no longer actively looking for work, and dropping out of the labor force.
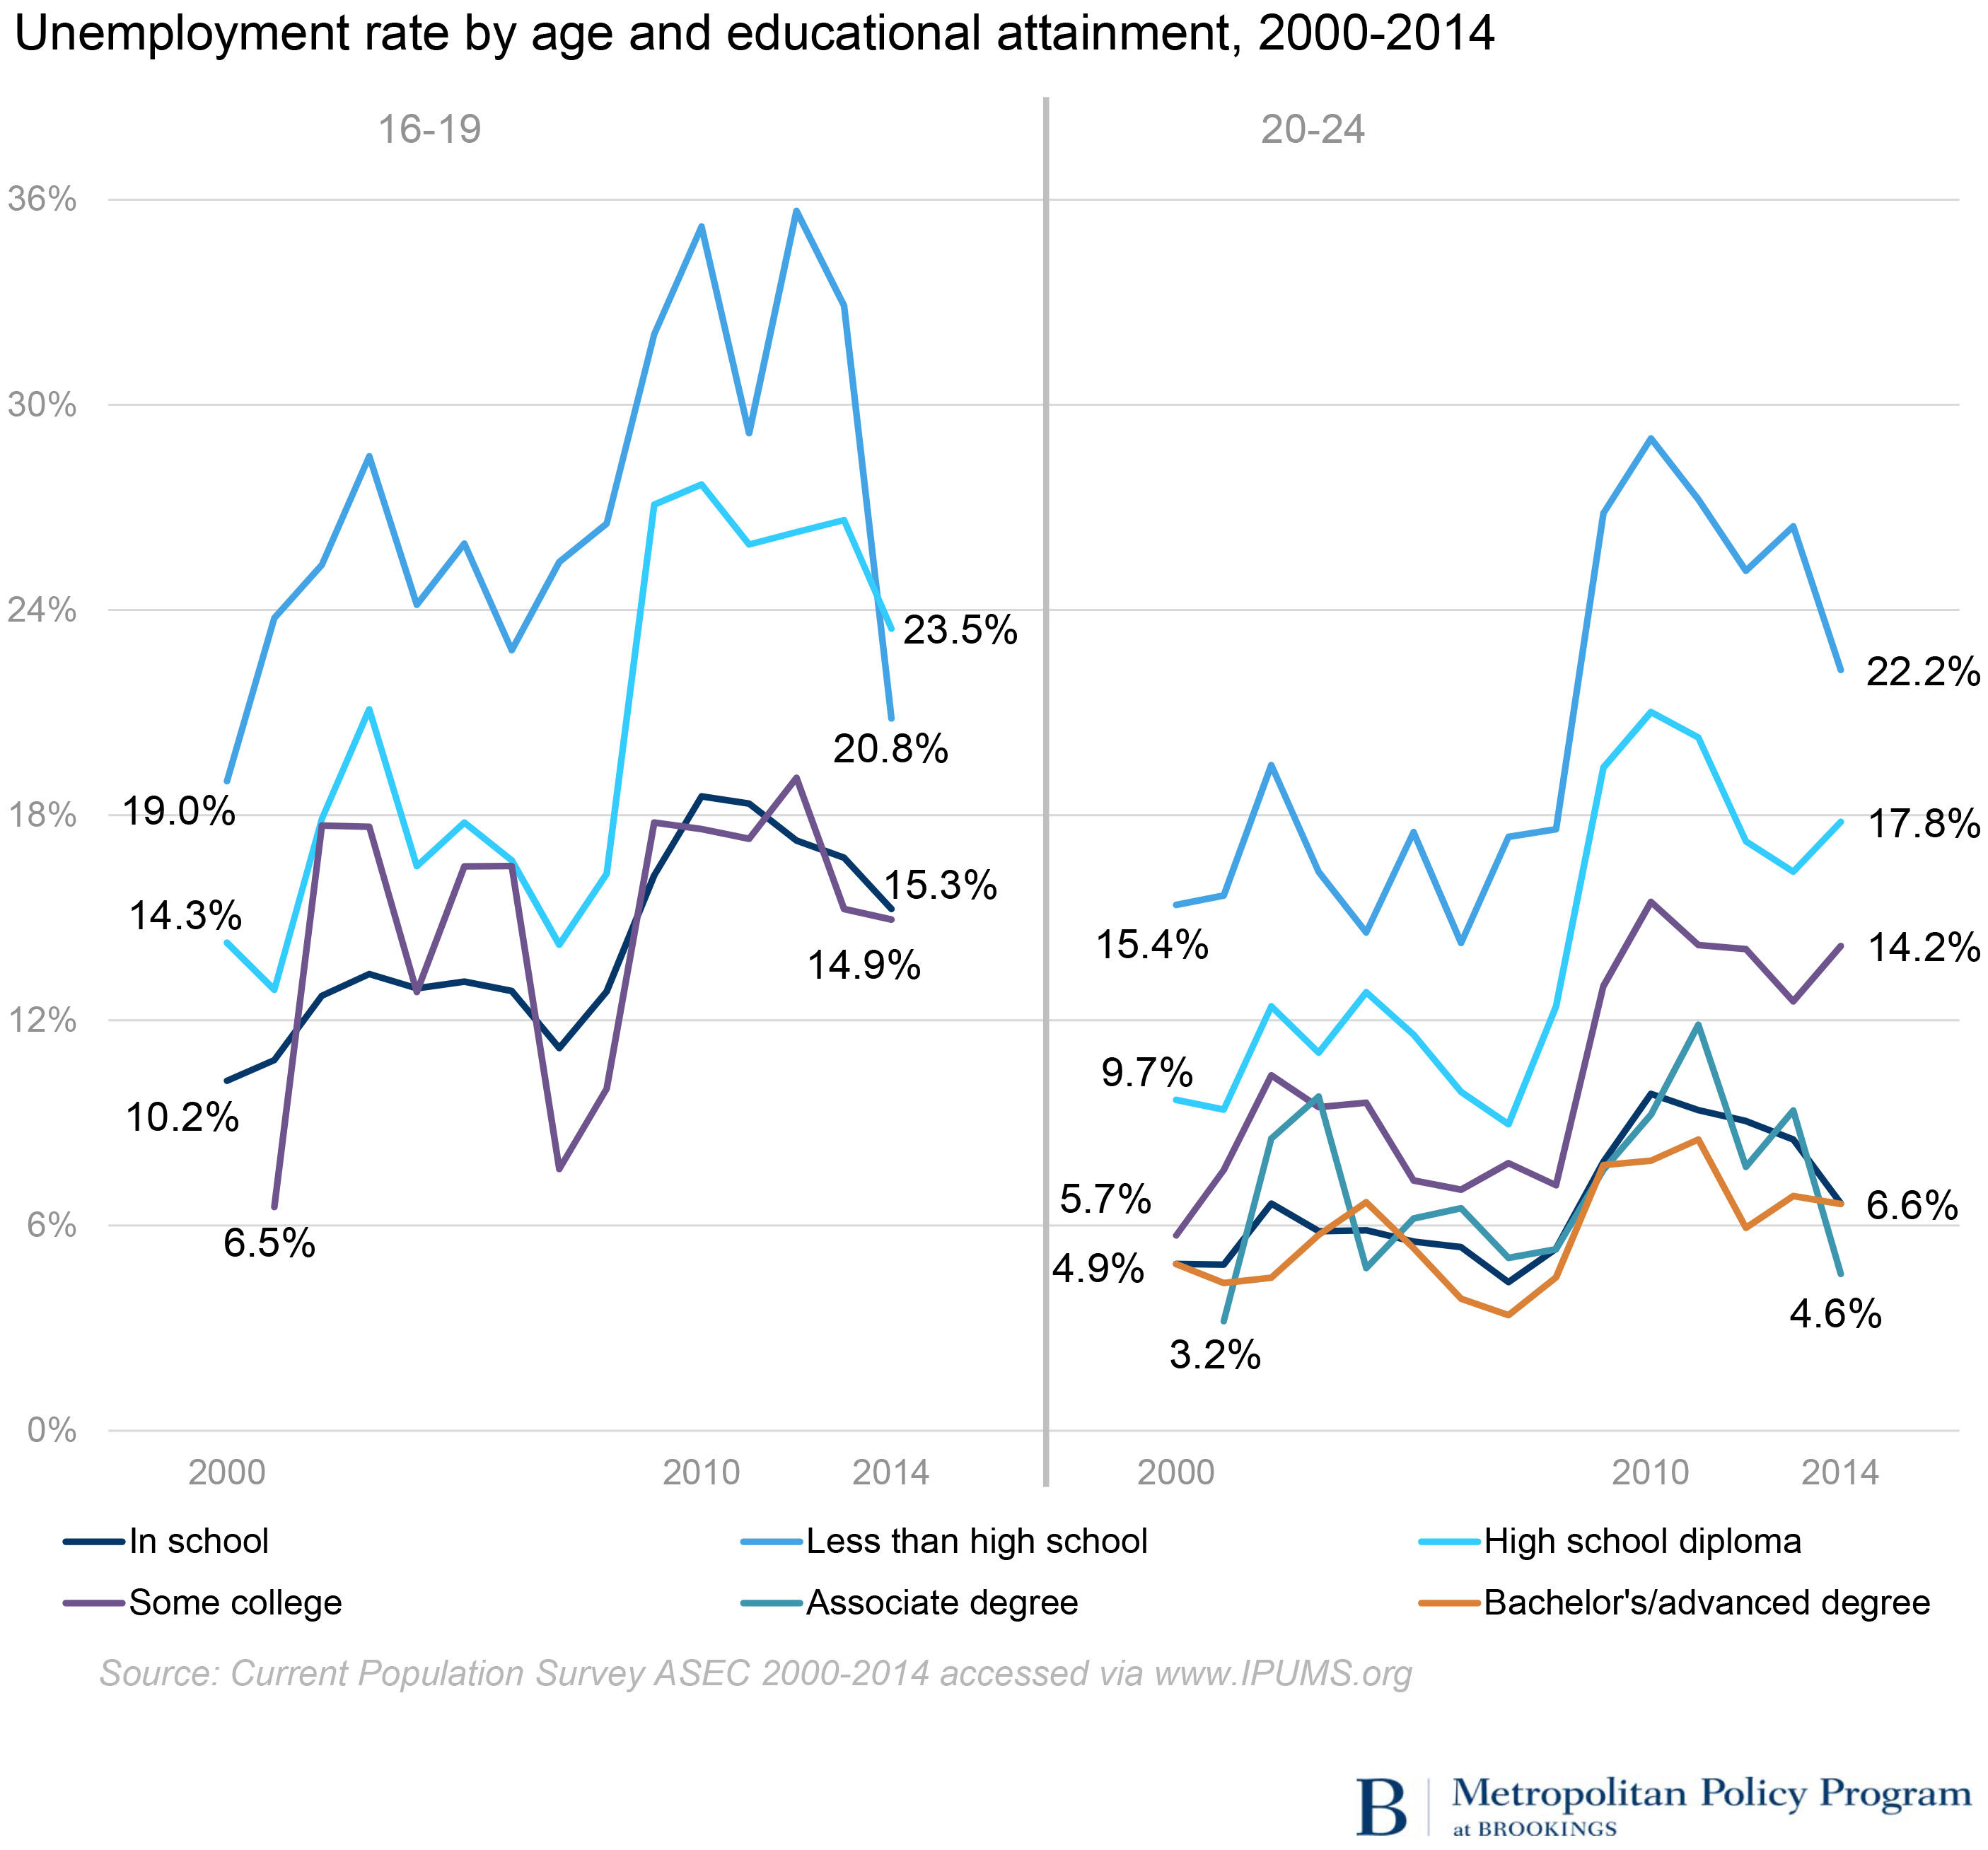
Among both teens and young adults, unemployment is typically lower among those enrolled in school. Although many do combine work and school, students are generally less likely than their peers to seek work. As with adults, unemployment rates among teens and young adults typically decline with higher educational attainment. For young adults, unemployment rates for those with an associate degree or a bachelor’s degree track fairly closely and are generally in the single digits, well below those with lower levels of education. Unemployment rates among teens not in school and with a high school diploma or less are consistently well above the teen average: 23.5 percent among high school graduates and 20.8 percent among those without a diploma in 2014, compared to 17.0 percent overall.
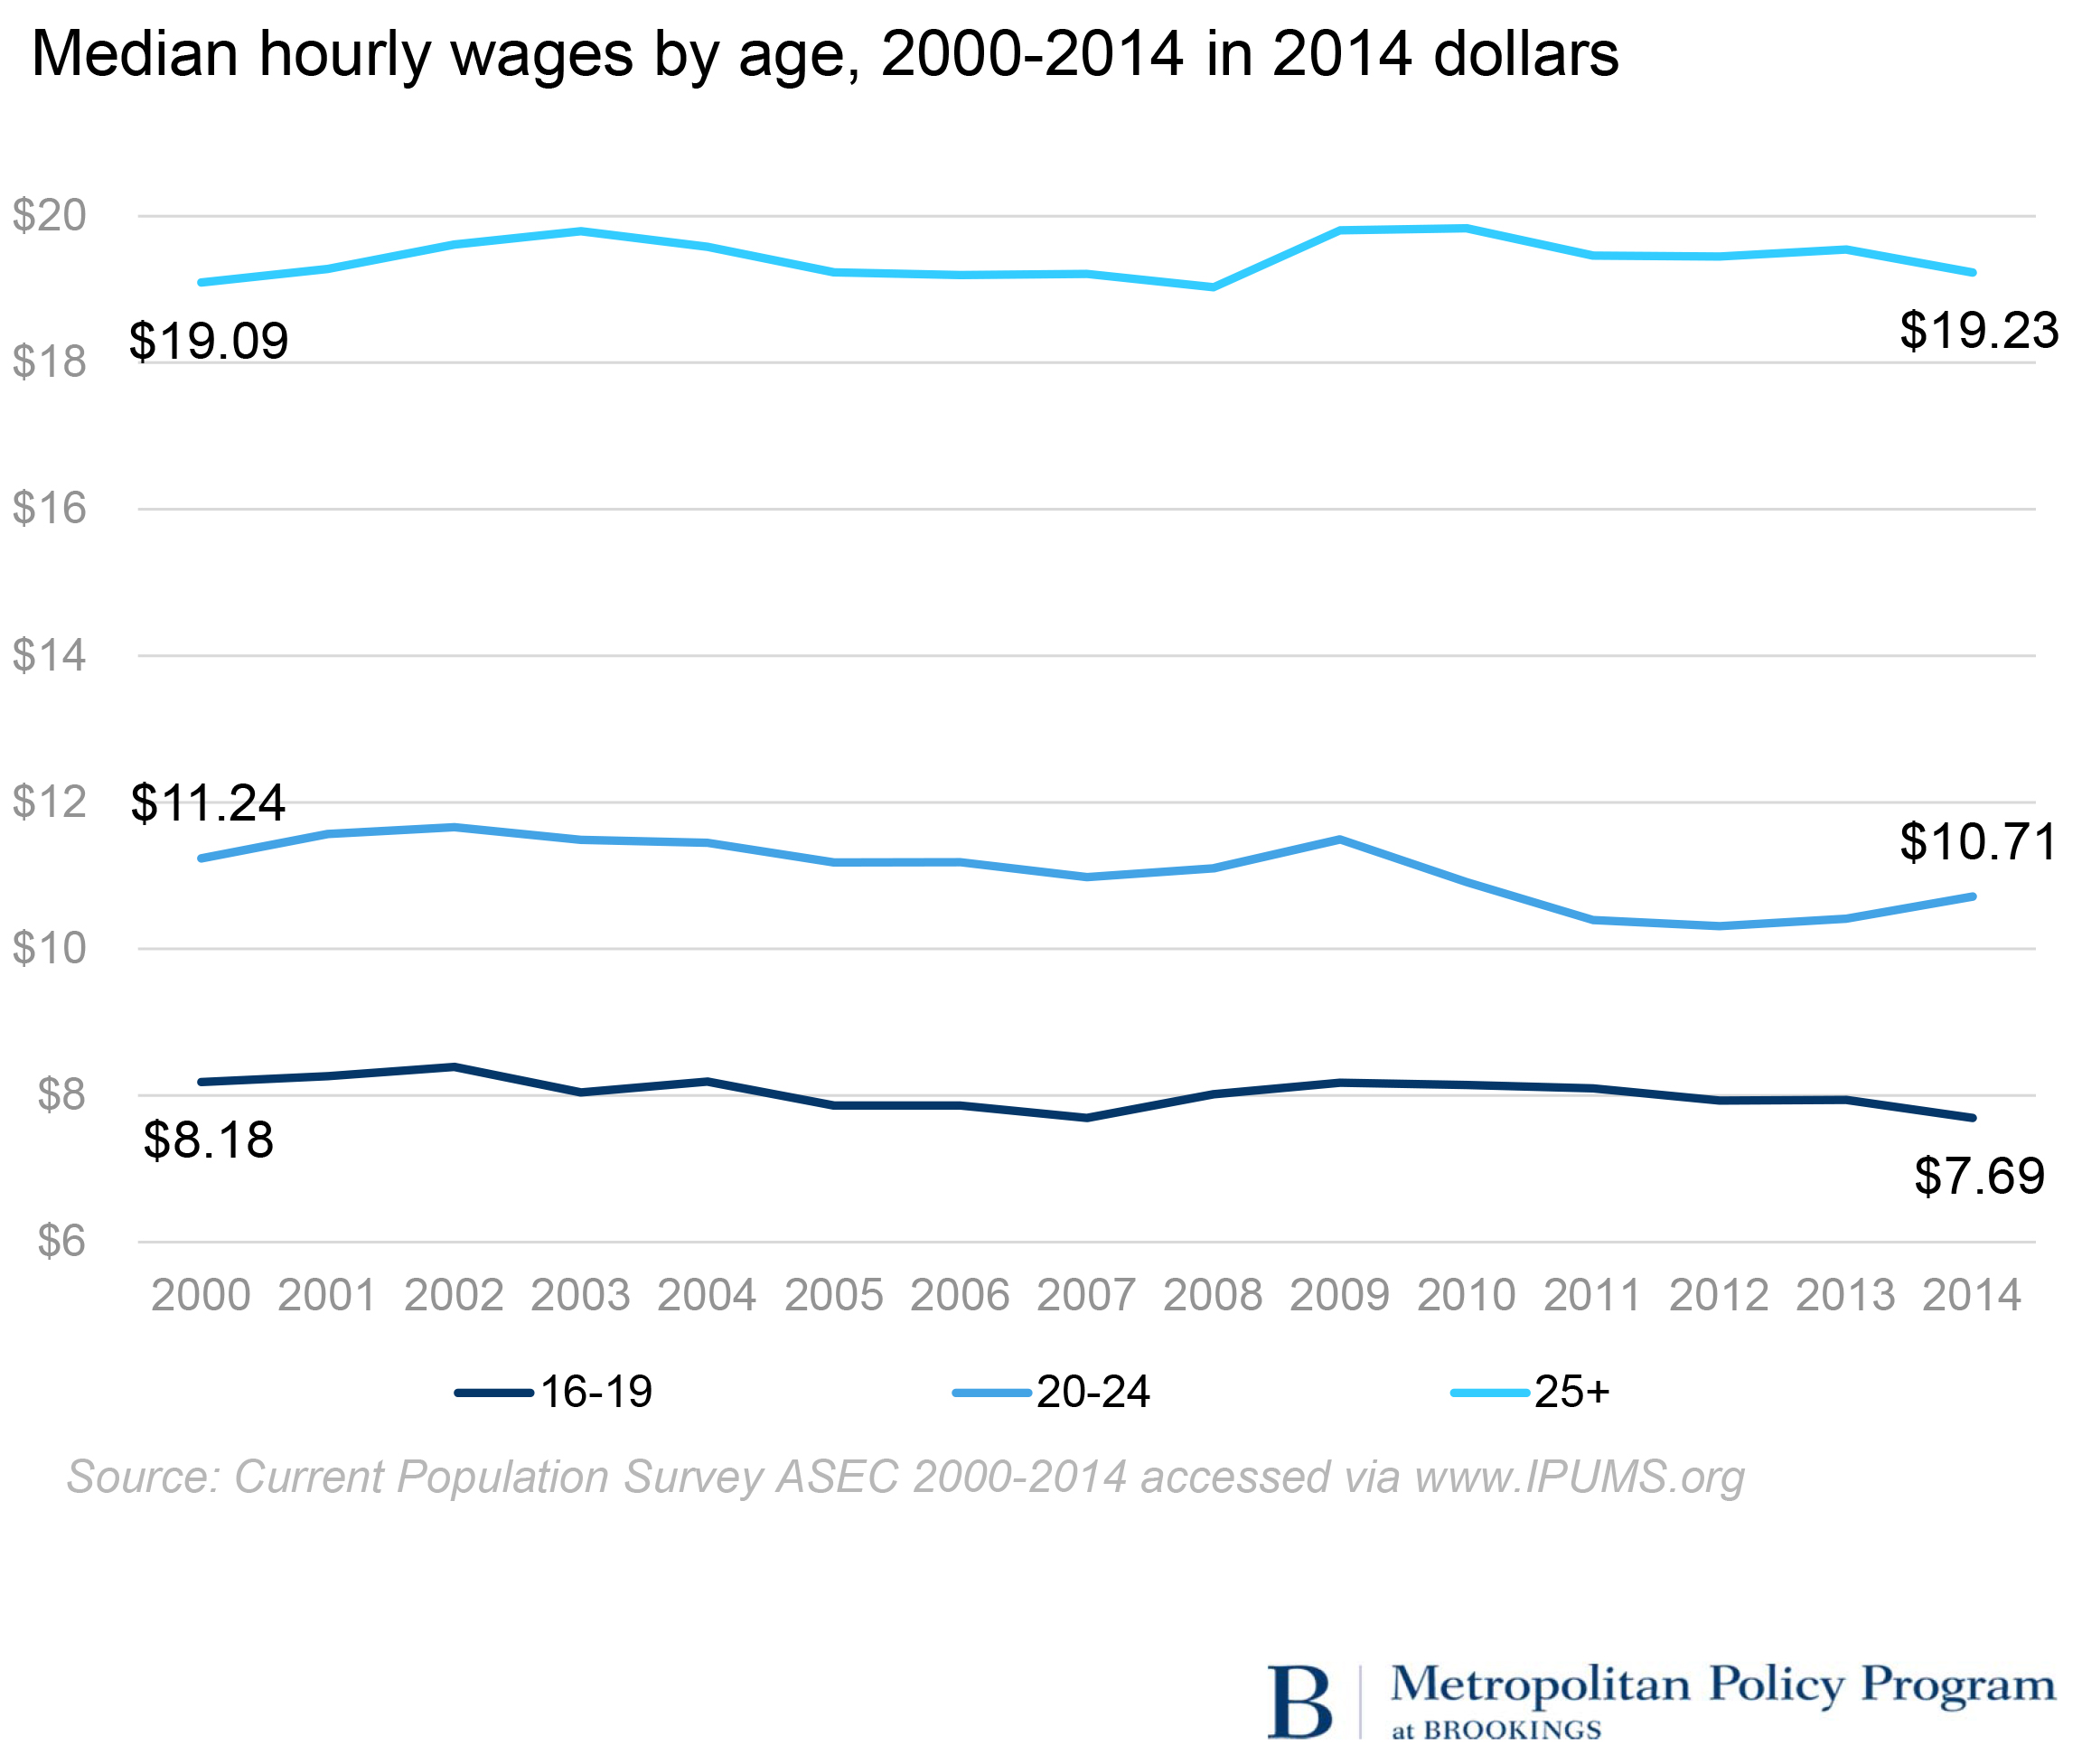
Earnings declined for teens and young adults and remained flat for workers over 25
Between 2000 and 2014, median hourly earnings fell 6 percent to $7.69 among teens, and fell almost 5 percent among young adults to $10.71. Among adults 25 and older, median hourly earnings rose less than 1 percent to $19.23 in 2014.
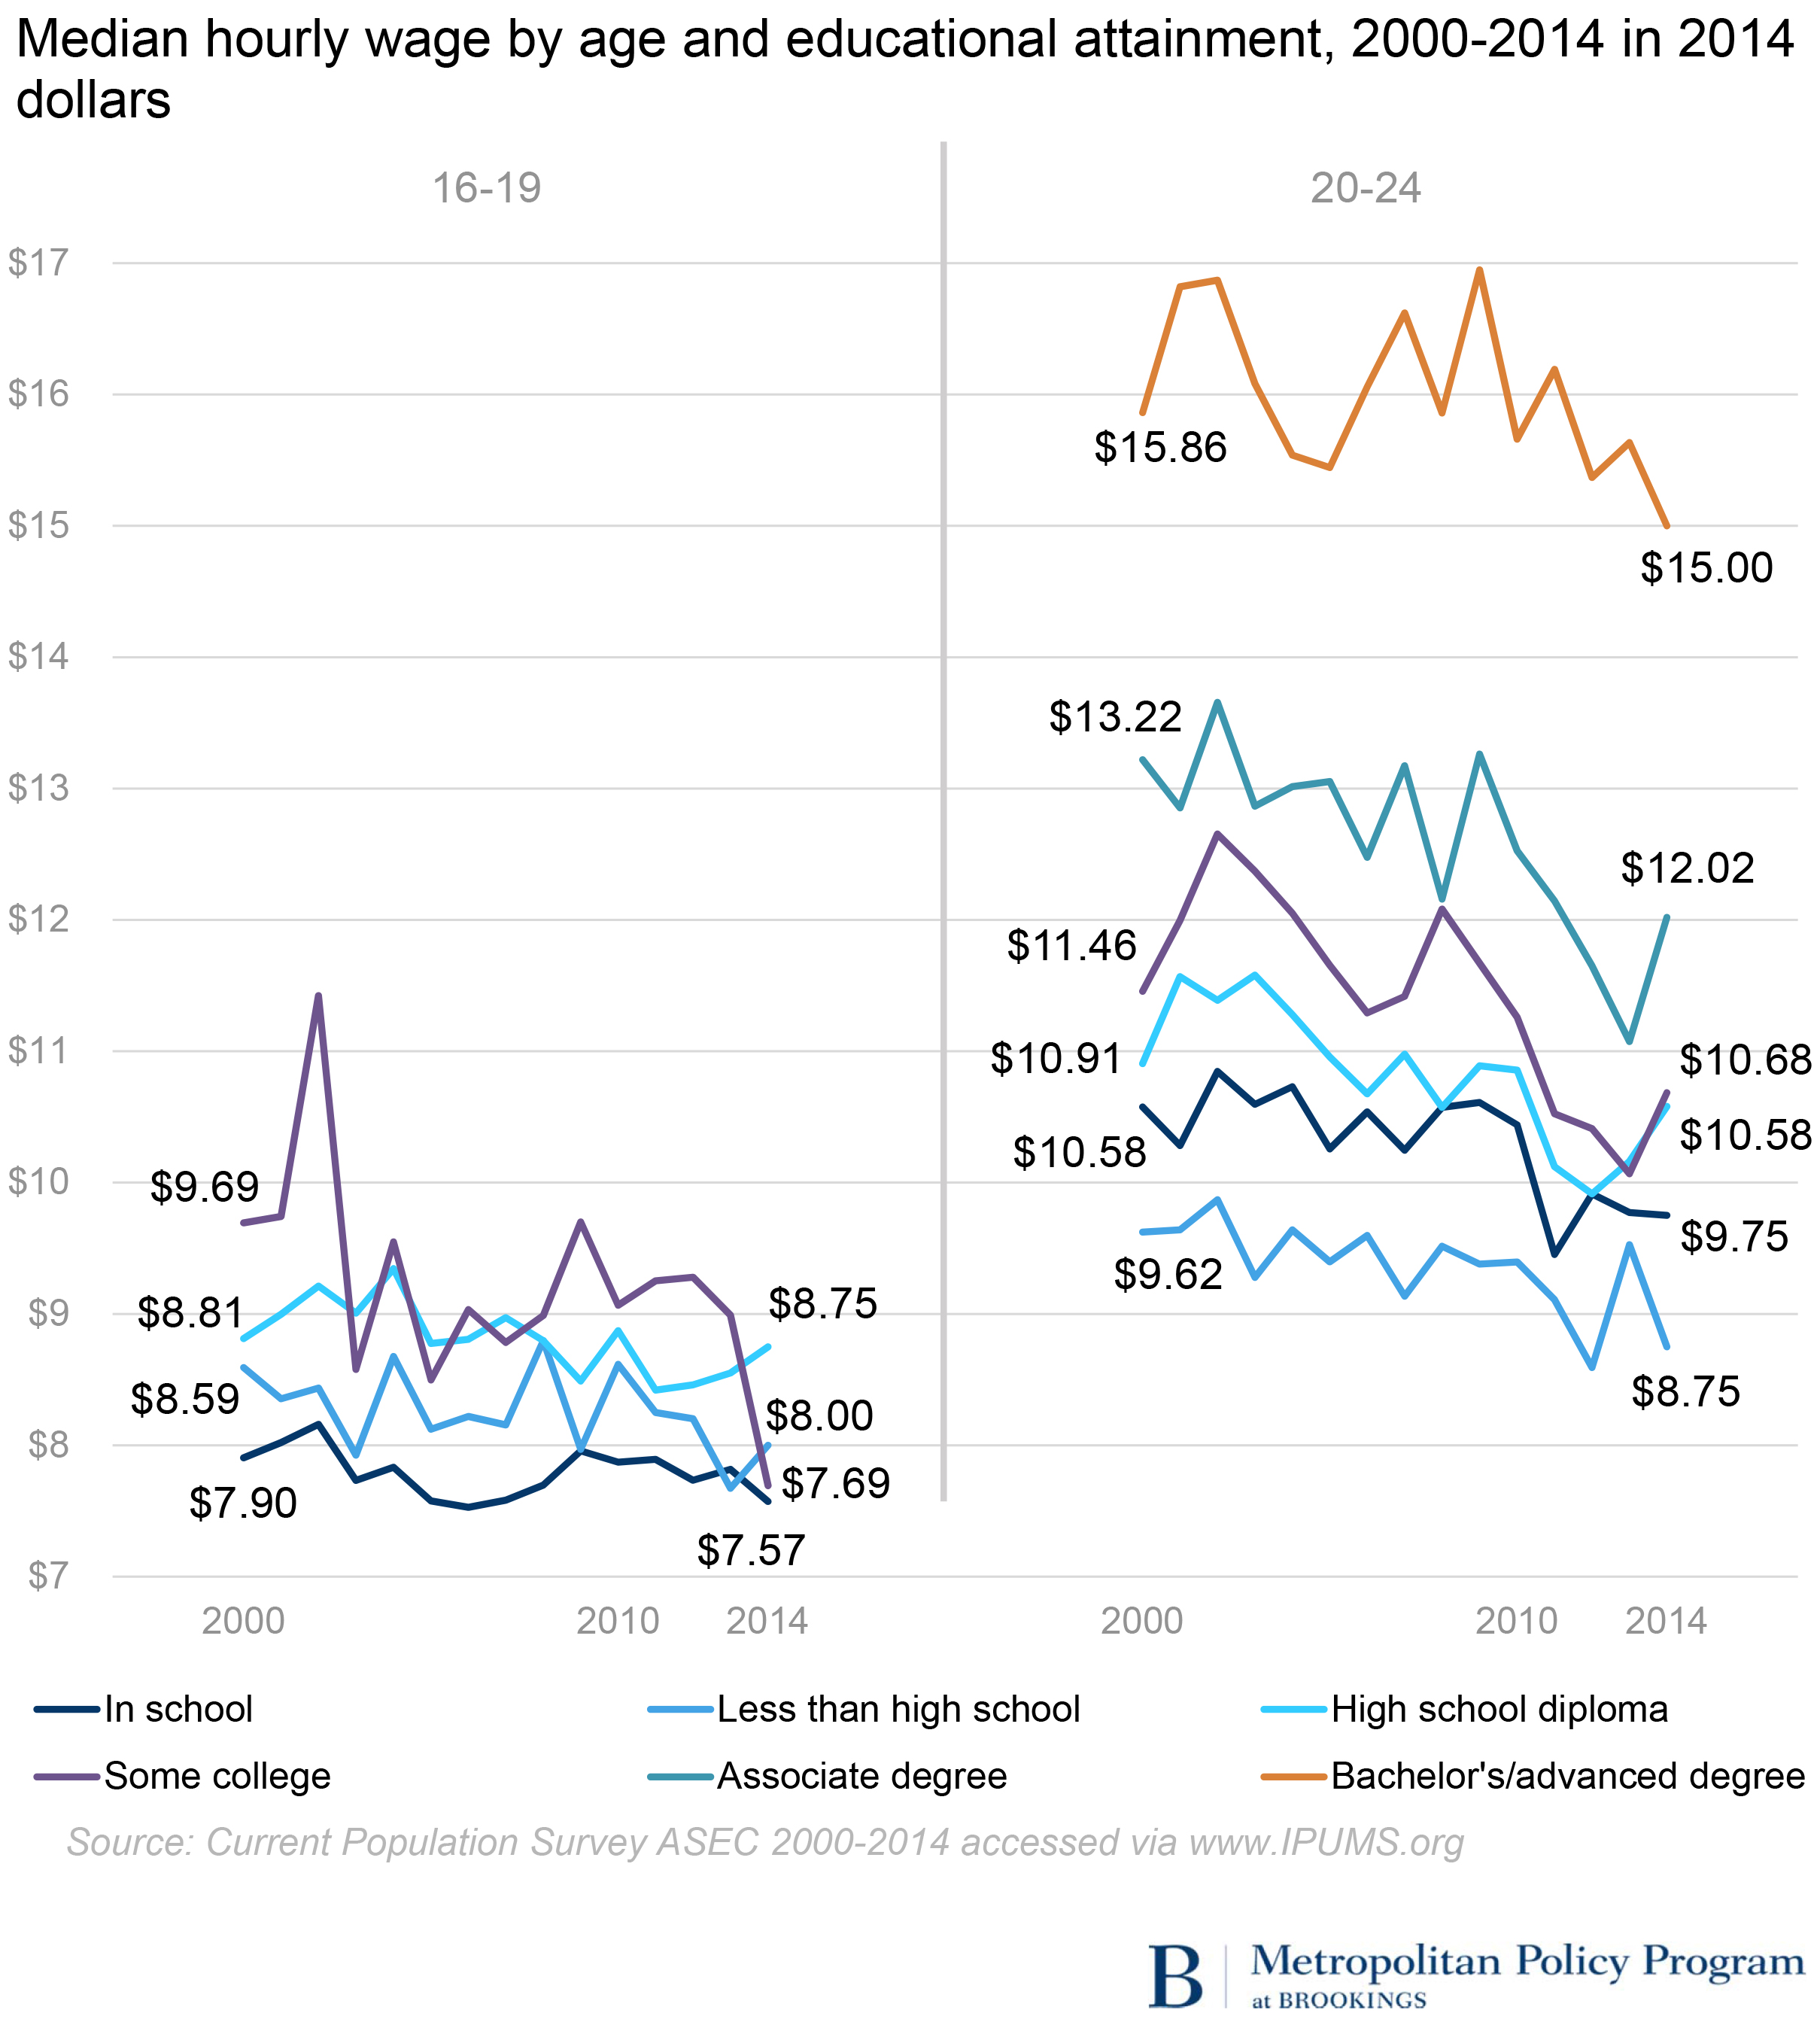
Teens and young adults, both in school and out of school and at all educational levels, experienced earnings declines. In 2014, median earnings for teens of all educational groups ranged between $7.57 and $8.75 per hour, while earnings among young adults showed greater variation, consistent with their wider spectrum of educational attainment. Underlining their limited earnings prospects, young adults with less than a high school diploma had earnings in the same range as teens. Earnings steadily increase with higher levels of educational attainment, topping out with bachelor’s degree holders at $15.00 per hour.
Food service and retail dominate the employment picture for teens and to a lesser extent for young adults
In both 2000 and 2014, eating and drinking places and grocery stores were the two industries employing the largest share of teens. Food service and retail (grocery stores, clothing stores, and department stores) account for four of the top 10 sectors in both time periods, with teens becoming increasingly concentrated in food service. In 2000, one of four employed teens worked in eating and drinking places, increasing to one in three in 2014. Other large employers of teens include construction, colleges and universities, and day care centers.
Young adults are not as concentrated in retail and food service as teens, although these industries do employ sizable numbers of young adults. As with teens, the top employer of young adults is eating and drinking places, and as with teens again, the share of young adults in this sector is increasing: 10 percent in 2000 rising to 15 percent in 2014. The share working in retail—combining grocery stores, department stores, and clothing stores—remained stable at about 8 percent. Construction and colleges/universities were the second- and third-largest employers in both time periods, although the share of young adults working in construction declined, probably reflecting the dramatic downturn in the housing market associated with the Great Recession.
Note: While there is a great deal of overlap, the 10 largest industries employing teens and young adults in 2000 are not identical to the 10 largest industries employing teens and young adults in 2014. For teens, business services not elsewhere classified and nursing and personal services were in among the 10 largest in 2000 and not in 2014. For young adults, business services not elsewhere classified and trucking services were among the 10 largest in 2000 and not in 2014.
There is a fair amount of overlap in the most common occupations among teens and young adults, mostly concentrated in retail and food service: cashiers, sales clerks, waiters/waitresses, cooks, and food prep. Cashier is the most common occupation for both age groups, accounting for 15 percent of teens and 6 percent of young adults. However, the top 10 list of occupations held by young adults also includes those associated with increased experience and education and perhaps associated with full-time employment: teachers not elsewhere classified (most likely teachers’ aides), nurses’ aides, and supervisory sales workers.
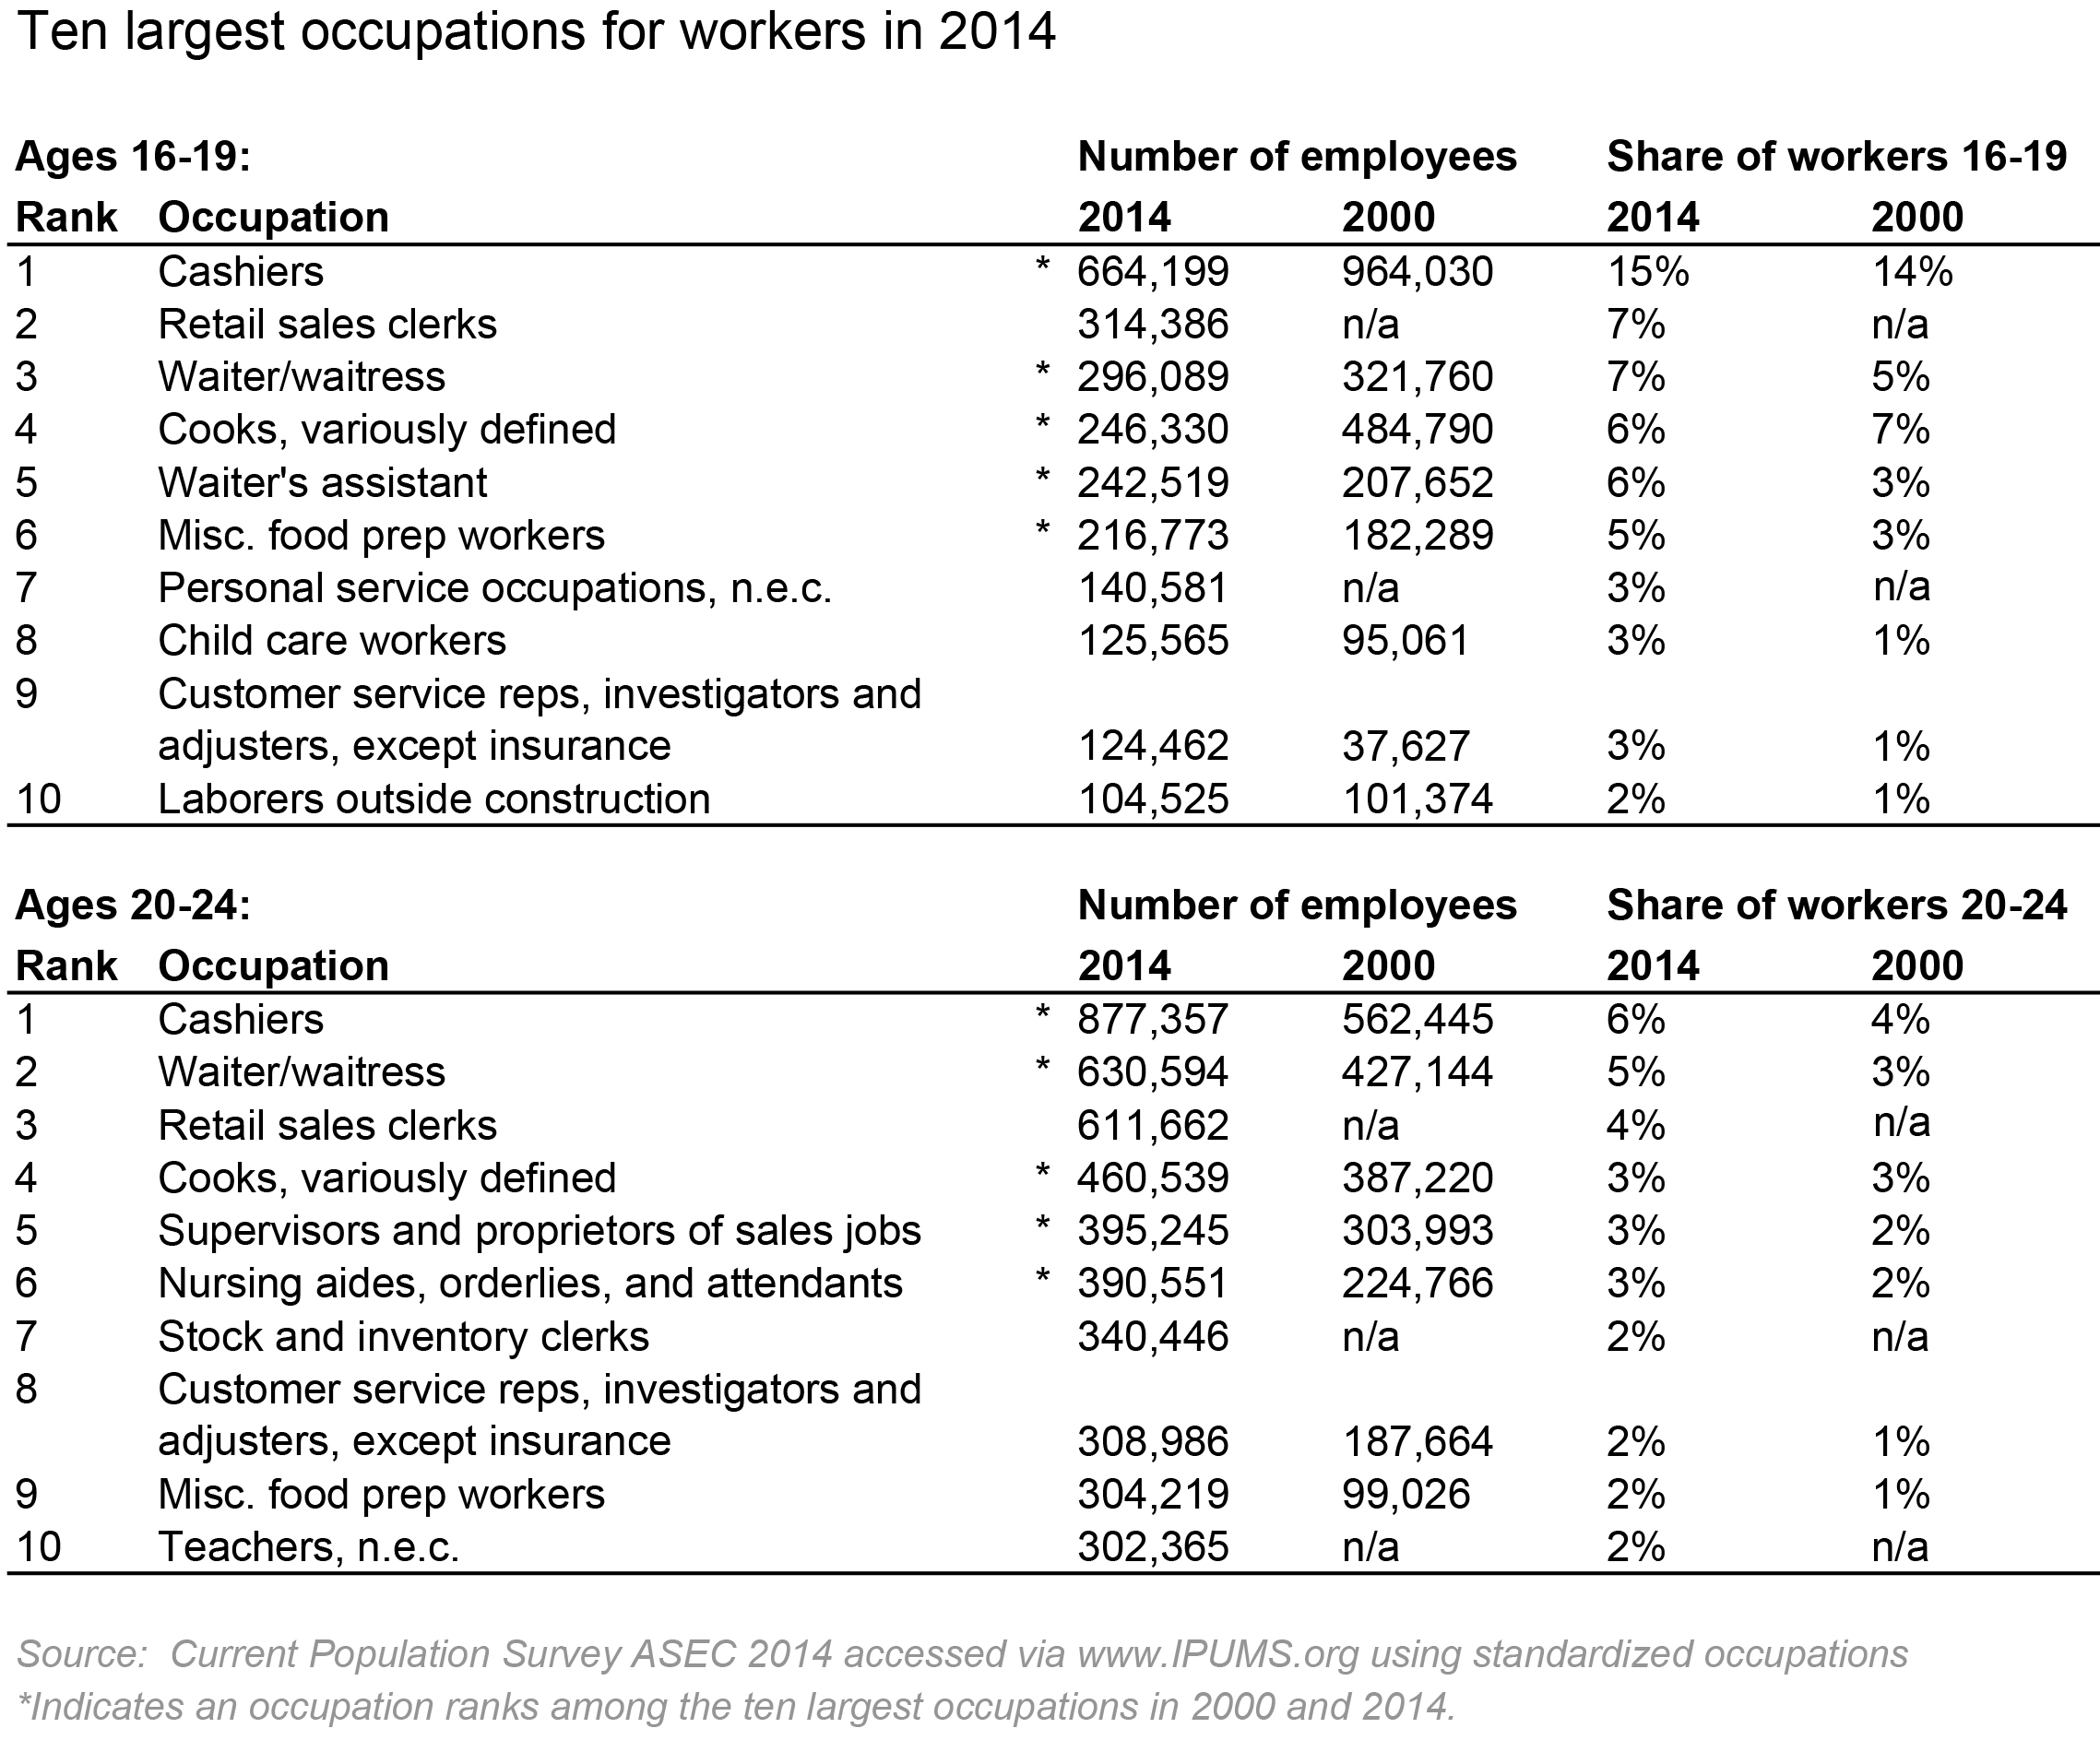
Note: As with industries, the 10 most commonly held occupations for teens and young adults are not identical in 2000 and 2014. Among teens, the following occupations ranked in the top 10 in 2000 but not in 2014: salespersons not elsewhere classified, stock handlers, food counter and fountain workers, janitors, and delivery drivers. Among young adults, the following occupations ranked in the top 10 in 2000 but not in 2014: salespersons not elsewhere classified, delivery drivers, freight, stock, and material handlers, laborers outside construction, and teachers’ aides.
In the above table, 2014 occupations that do not have a comparable classification in 2000 are listed as n/a. For more information, please see the Technical Notes section.
Conclusion
The data above present a sobering picture of the labor market for teens and young adults: Labor force participation, employment, and median earnings are all declining. The drop in labor force participation and employment rates among teens is particularly notable. In fact, the absolute number of employed teens dropped by 36 percent between 2000 and 2014, from 6.9 million to 4.4 million, even as the total number of 16 to 19 year olds increased by 3 percent. Teens were the only age group to experience a decline in the absolute number of employed people.
Although teen employment is not typically necessary to support basic living expenses, such low rates of labor force participation and employment raise questions about future labor market success. Reduced work experience as a high school student, especially for those not enrolling in four-year colleges upon graduation, has been associated with lower employment rates and earnings in later years.2 And while there has been some debate on whether employment interferes with academic achievement for high school students, there appears to be consensus that working 15-20 hours per week during the school year is not likely to hurt academic performance.3
Most people spend most of their lives working; it is the activity by which most people support themselves and their families, and it is a major part of adult identity. A teen employment rate of 26 percent suggests that most teens are missing key learning and developmental experiences that will prepare them for the labor market and adulthood. Learning how to function in a work environment—to be responsible, assess situations, accept feedback, identify when to seek assistance, and so on—are best learned through direct experience. Teens know the social role of the student, whether they embrace the role or not, but these data suggest they are learning far less about the role of the worker.4 The implications will play out in years to come.
•
Technical notes on occupational analysis
Data presented for occupations uses a standardized occupation coding system tied to 1990 classifications. However, due to changes in coding, some occupation classifications are not comparable between 2000 and 2014. In these cases, in order to avoid misrepresenting the data, we did not report figures for 2000. For example, among teens in 2000, the standardized coding suggests there were 30,000 retail sales clerks, but nearly 600,000 salespersons not elsewhere classified, accounting for 9 percent of teen workers. By 2014, the number of salespersons not elsewhere classified had declined to 33,000, while retail sales clerks had grown to over 300,000, accounting for 7 percent of teen workers. Similar classification inconsistencies are found among personal service occupations not elsewhere classified for teens, and for teachers not elsewhere classified and stock and inventory clerks among young adults.
Notes
1. The size of the drop in employment rates among those with some college education should be interpreted with caution. The share of teens in the “some college” category is fairly small, resulting in greater year-to-year volatility than among the “in school” population, which comprises the vast majority of teens.
2. Chris Ruhm, “The Extent and Consequences of High School Employment,” Journal of Labor Research 16 (3) (1995): 293-303; Andrew Sum and Walter McHugh, “The Impacts of In-School Summer and Senior Year Work Experience on the Early Post-High School Employment Experiences of Class of 2009 BPS Graduates,” Report Prepared for the Boston Private Industry Council (Boston: Center for Labor Market Studies, Northeastern University, 2012); Christopher J. Ruhm, “Is High School Employment Consumption or Investment?” Journal of Labor Economics 15 (4) (1997): 735-775.
3. National Research Council, Protecting Youth at Work: Health, Safety, and Development of Working Children and Adolescents in the United States. (Washington, DC: The National Academies Press, 1998); Bureau of Labor Statistics, Report on the Youth Labor Force, U.S. Department of Labor, 2000; Kusum Singh, Mido Chang, and Sandra Dika, “Effects of Part-Time Work on School Achievement During High School,” Journal of Educational Research 101 (1) (2007): 12-23; Stephen F. Hamilton and Rachel Sumner, “Are School-Related Jobs Better?” (Atlanta: Southern Regional Education Board, 2012).
4. Robert Halpern, Youth, Education, and the Role of Society (Cambridge: Harvard Education Press, 2013).