
Executive Summary
The Elementary and Secondary Education Act (ESEA) is being reauthorized. Its largest program, Title I, provides funding to states and districts to improve education for disadvantaged students. However, its funding per student is quite low, averaging about $500 to $600 a year. And there is little evidence that the overall program is effective or that its funds are used for effective services and activities. Large proportions of school principals report using Title I funds for teacher professional development, which many studies have shown to be ineffective and which teachers do not find valuable. Other services on which principals spent Title I funds include after-school and summer programs, technology purchases, and supplemental services, which also have been shown to be ineffective, and class-size reductions, which are unlikely to be of the size needed to generate effects found in previous research.
Achievement gaps between disadvantaged students and their better-off peers are large and have existed for decades. Narrowing these gaps will mean investing more in research to identify effective approaches, or increasing Title I spending by five to eight times more per student, or both. Focusing effective interventions on the neediest students may provide a way forward that is consistent with fiscal realities.
Efforts to reauthorize the federal Elementary and Secondary Education Act (ESEA) have generated contentious debates about annual testing and accountability. Both the Senate and House versions, now headed to conference, maintain annual testing and push accountability back to the states.
Curiously missing from the debates has been the evidence of whether or not ESEA achieves its objectives.
The largest ESEA expenditure by far is for its Title I program, which in 2014 provided $14 billion to states to improve student achievement. But the last national evaluation that measured Title I’s effectiveness, the ‘Prospects’ study, did not find evidence that it improved student achievement.[i] The most recent national assessment of Title I did not measure its effectiveness, though it pointed to broad trends on the National Assessment of Educational Progress showing gains in achievement, especially for minority students. These gains may be due more to NCLB’s stricter accountability, however. Accountability created incentives for all public schools to improve.
The question here is whether Title I funds are spent effectively.
Follow the money
Title I has a 60-year history, which is plenty of time for it to develop funding quirks. Funds flow to districts based on their counts of students in poverty, which is determined by the Census Bureau. Districts determine which schools get funds by rank-ordering schools based on poverty levels. Once funds arrive at a school, however, they are used for students at risk of failing to meet state learning standards. A student’s poverty level plays no role in determining whether the student is eligible for Title 1 services. And if a school serves at least 40 percent economically disadvantaged students, funds can be used for the entire school (a ‘schoolwide’ program).
There is a well-known correlation between poverty and student achievement, and Title I no doubt serves students who are both poor and underperforming. But the school lunch program does not measure the calorie intake of low-income students and give their lunches away if low-income students are getting ‘enough’ calories. But that is how Title I treats a low-income student who is making satisfactory academic progress.
Title 1 is spread so thin that its budget of $14 billion a year turns out not to be much money.[ii] The threshold for operating a Title I schoolwide program is that 40 percent of a school’s students are eligible for free or reduced-price lunch, and current data show that 51 percent of students are eligible. Not surprisingly, many schools operate schoolwide programs, in fact about half of all public schools in the United States.[iii]
Assuming these schools have average enrollment, which is about 500 students, almost 25 million students attend schools that operate schoolwide programs. The upshot is that after allowing for the money also spent on ‘targeted-assistance’ programs (which operate in schools whose poverty levels are below 40 percent), Title I is spending about $500 to $600 per student. The national assessment of Title 1 used a survey of states, school districts, and schools to estimate Title I expenditures, and essentially reached the same conclusion. Their more exact estimate is that Title I spent $558 per student in a high-poverty school and, another spending quirk, spent $763 per student in a low-poverty school.[iv] Education spending was $12,400 a year per student in 2013, which means from the federal perspective, Title I amounts to about 5 percent more per student than would otherwise have been spent.[v]
Realistically, how much improvement can we expect by adding 5 percent to education spending? Data show huge achievement differences for students in poverty compared to those who are not. The National Assessment of Education Progress reported in 2015 that the average fourth grader eligible for free lunch scored 209 in reading, and the average fourth grader that was not eligible for free lunch scored 237. That 28-point gap is roughly comparable to being behind by more than two grade levels. The gap is 25 points in eighth grade, which is still very large.
Spending another $500 seems unlikely to close these kinds of gaps much or at all.
Maybe the funds can be focused on fewer students or spent on highly effective activities or services. But, by design, schoolwide programs do not target specific students. The programs are intended for the whole school, though schools might operate after-school programs or basic skills programs that benefit only those students that attend them. And the question of whether the money is spent effectively is preceded by a question that itself is hard to answer: how is the money spent?
What is purchased with Title I funds?
In 2010, the Government Accountability Office visited 12 school districts in four states to explore what happened to the money. The nation’s ‘watchdog’ agency could not simply check a database or spreadsheet to determine how Title I money was spent. They had to send investigators into the field. This is not a criticism of the GAO. There is no database they could have referenced, so they went to the field to learn what they could. They did note in their report that Education Department officials ‘want to allow schools to spend the money to meet their unique needs and to be free to spend the money creatively.’
The money might be spent creatively but what the GAO reported is not much cause for thinking the money is spent effectively.[vi] Most of the money—84 percent—is spent on ‘instruction,’ which is not surprising for a program that operates in schools. Some districts used funds for teacher professional development in the form of workshops or by hiring coaches to support regular classroom teachers, or funded smaller class sizes, provided after-school programs and summer-school programs, or bought technology hardware or software.
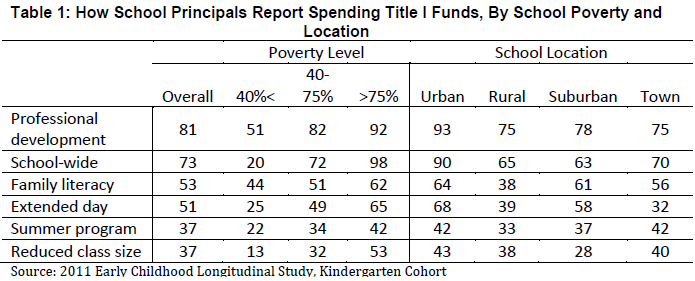
These findings are corroborated by recent data from the Early Childhood Longitudinal Study’s kindergarten cohort, which administered a survey to principals of schools that included a kindergarten. Principals were asked how they spent Title 1 funds. The survey did not ask dollar amounts or proportions, unfortunately. Principals checked off ways in which money was spent without indicating how much was spent. The table counts principals not receiving Title 1 funds as responding ‘no spending’ in each category.
The table shows that 81 percent of principals reported spending Title I money on professional development. The percent is higher—93 percent—in urban schools and in schools with high poverty rates (more than 75% free or reduced price lunch). How much is spent on professional development is hard to assess because the districts report spending in categories such as ‘instruction’ that includes teachers and teacher aides. If teachers hired through Title I are coaching other teachers, they are counted as teachers and not as professional developers, though that’s their role.
What works and what the money is spent on are different things
Evidence of effectiveness is lacking for nearly all these activities. For example, the New Teacher Project recently reviewed research on the effectiveness of professional development, and the title of its report provides the answer—‘The Mirage.”[vii] They found no evidence of effective professional development programs. They did find evidence of massive expenditures on professional development, even more than in other professional fields, and evidence that teachers mostly disliked professional development activities and did not feel the activities were tailored to their needs.
Two large and rigorous studies of professional development conducted by the Institute of Education Sciences—one focusing on reading[viii] and the other on math[ix]—likewise found no evidence that intensive professional development improved student achievement. And the professional-development programs the Institute studied were ones that were more expensive and required greater time commitments than ones likely to be supported by Title I.
Other ways in which Title I funds are spent also are not supported by evidence, or are too vaguely reported to know whether they are. After-school programs have been shown not to be effective.[x] The same is true of technology used in classrooms.[xi] In the late eighties, a study of class-size reduction in Tennessee showed effects, but to get these effects, class sizes were reduced from an average of 23 students to 15 students. Class-size reductions of this size and expense are not happening in Title I schools based on additional federal funding of a few hundred dollars per student.
Schools in need of improvement also have to use Title I money to support transporting students to schools parents choose, or for supplemental services. The parent choice option was chosen by too few parents to generate much improvement. The national assessment reported that 6 million students were eligible for choice in the 2004-2005 school year and 45,000 used it.[xii] And a rigorous study of supplemental services that Mathematica conducted for the Institute of Education Sciences found the services were ineffective.[xiii]
We need to be realistic or spend more wisely
Districts and schools that are recipients of Title I dollars are being asked to tackle disparities of longstanding social and historical origin issues with little money. The program sends token amounts to schools, which use the amounts to funds services that research has found to be ineffective. Educators may appreciate the added resources, but attaching lofty expectations to the resources seems out of touch, as if Washington does not understand that $500 for a student does not go a long way in schools. For comparison, the average public school teacher earns about $50 an hour (the average depends on how fringe benefits are costed).[xiv] Title 1 spending buys a student about 10 hours a year of a teacher.
It is time to modernize this enterprise. If we want Title I to close achievement gaps, policy needs to provide sufficient funding, clear definitions and metrics for desired outcomes, and better guidance about effective programming, which means continued investments in research to identify effective and ineffective programs. The Senate bill includes language that moves in this direction. It calls for researchers to be on peer-review panels that will assess state plans; for states to review local plans to ensure they are identifying and implementing evidence-based methods and are monitoring and evaluating their implementation, and for local agencies to collect and use data to adjust programs.
It is challenging to put a cost on what it would take to close or even narrow achievement gaps created by poverty. We know $500 won’t do it. Researchers in Texas estimated the cost of educating an economically disadvantaged student to reach the same achievement level as other students was 25 percent larger, researchers in Missouri estimated the cost was 56 percent larger, and researchers in New York estimated the cost was 100 percent larger.[xv] A recent study that examined education outcomes after court-ordered education spending increases estimated that spending 30 percent more a year on disadvantaged students would add about a year to their education attainment. There are no standard methods and data for estimating added costs of educating disadvantaged students, which contributes to this wide range.
Federal spending does not need to eliminate the gap. K-12 education is primarily a state and local function and will continue to be. A reasonable goal would be to close NAEP score gaps by the equivalent of a year. The wide range of estimates does not provide explicit guidance about how much spending would be needed to reach that objective. Estimates from the study of court-ordered spending suggests it is in the ballpark of about $4,000 a year per student.[xvi] That’s a big increase, and unless Congress wants to spend $100 billion a year on Title 1, the increase needs to be coupled with a focus on fewer students. The newly-authorized program may give districts and schools enhanced flexibility to focus on the neediest students even within schoolwide programs. For example, research is emerging on a highly effective tutoring program that operated within the school day and was supported by Title 1 funds.[xvii] This kind of program focuses on students that need tutoring. A broader consideration would be to increase the threshold at which a school becomes eligible for a Title 1 schoolwide program. Currently, an average school qualifies to be a schoolwide program. Constraining the eligibility rate to be the highest 25 percent of schools in terms of poverty, or even fewer, and using those targeted resources on programs that have been validated with strong research could be a productive way forward that fits within the current fiscal realities of the federal budget.
[i] http://files.eric.ed.gov/fulltext/ED413411.pdf
[ii] In fact, in 2014 the Federal government spent more on school breakfasts and lunches—$16.4 billion—than on Title 1. Spending on school breakfasts and lunches is reported at https://schoolnutrition.org/AboutSchoolMeals/SchoolMealTrendsStats.
[iii] http://www.southerneducation.org/getattachment/4ac62e27-5260-47a5-9d02-14896ec3a531/A-New-Majority-2015-Update-Low-Income-Students-Now.aspx and https://nces.ed.gov/pubs2012/pesschools10/tables/table_02.asp.
[iv] http://www2.ed.gov/rschstat/eval/disadv/nclb-targeting/nclb-targeting-highlights.pdf
[v] https://nces.ed.gov/fastfacts/display.asp?id=66. Because Title I includes ‘targeted’ and ‘concentration’ grants that are intended to focus funds on districts with higher poverty levels, some districts receive more than the national average. For example, the national assessment of Title I reported that East St. Louis—a very poor small city—would receive $1,235 a student and New York City would receive $1,633. However, these higher amounts are offset by districts receiving even lower amounts than the national average.
[vi] http://www.gao.gov/new.items/d11595.pdf
[vii] http://tntp.org/assets/documents/TNTP-Mirage_2015.pdf
[viii] http://ies.ed.gov/ncee/pubs/20084030/
[ix] http://ies.ed.gov/ncee/pubs/20114024/pdf/20114024.pdf
[x] http://www2.ed.gov/rschstat/eval/other/cclcfinalreport/cclcfinal.pdf
[xi] http://ies.ed.gov/ncee/pdf/20074005.pdf
[xii] https://www2.ed.gov/rschstat/eval/choice/nclb-choice-ses/highlights.pdf
[xiii] https://ies.ed.gov/ncee/pubs/20124053/pdf/20124053.pdf
[xiv] https://nces.ed.gov/programs/digest/d14/tables/dt14_211.60.asp?current=yes
[xv] The Texas study can be found at http://bush.tamu.edu/research/faculty/TXSchoolFinance/papers/SchoolOutcomesAndSchoolCosts.pdf, the Missouri study at http://citeseerx.ist.psu.edu/viewdoc/download?doi=10.1.1.219.5238&rep=rep1&type=pdf, the New York study at http://surface.syr.edu/cgi/viewcontent.cgi?article=1102&context=cpr, and the Jackson et al. study of the outcomes of court-ordered spending at http://educationnext.org/boosting-education-attainment-adult-earnings-school-spending.
[xvi] To estimate spending needed to close the gap by the education equivalent of one year, we used Jackson et al.’s finding that increasing per-pupil spending by 10 percent increases education attainment by 0.3 years. The attainment gap is not the same as the score gap, but the cost of closing the score gap has not been studied at the Federal level.
[xvii] http://www.ipr.northwestern.edu/publications/docs/workingpapers/2015/IPR-WP-15-01.pdf