


With Congress moving rapidly to revise the No Child Left Behind Act (NCLB), no issue has proven more contentious than whether the federal government should continue to require that states test all students in math and reading annually in grades three through eight. The push to roll back this requirement has bipartisan support, and key members of Congress responsible for reauthorizing the No Child Left Behind law have yet to weigh in on the debate. In fact, the discussion draft circulated by Senate Republicans last week included two options on testing, one maintaining current requirements and the other providing states with far more flexibility. Consequently, there is a real possibility that, going forward, states may only be required to test students once in each grade span (i.e., once in elementary, middle, and high school).
What impact would a move to less frequent testing have on states’ abilities to provide parents with meaningful information on school quality and to hold accountable schools that contribute the least to student learning? We address this question using roughly a decade of detailed, student-level records from all public elementary schools in Florida and North Carolina.[1] We examine how schools would look if they were judged based only on their average test scores in a single grade—as might be the case under a grade-span testing regime—compared to how they can be judged using measures based on the growth in student test scores from year to year, which is only possible with annual testing.[2] The type of growth measure we use in our analysis has been validated using data where students are randomly assigned to schools, thus increasing our confidence that it captures the true impact of schools on student achievement. The measure is conceptually similar to the growth measures currently used in some state accountability systems, such as student growth percentiles.
The figure below compares the average scores and growth measures in math for North Carolina schools; both measures are constructed to have an average of zero. For any given average score, there is a wide variety of performance in terms of growth. There are schools with above-average scores but below-average growth, and vice versa.
The lines on the figure show the cutoffs for the bottom 15 percent of schools on each measure, as this is the share of schools that many states have been required to identify for sanctions under the Obama administration’s NCLB waiver program. There are many examples of schools that would be sanctioned based on their average scores, but not based on their growth, and vice versa. For example, among schools with bottom-15% average scores, 55 percent were not failing based on their growth and 20 percent were above average on this measure.
Average Score vs. Growth Measure (correlation=0.56)
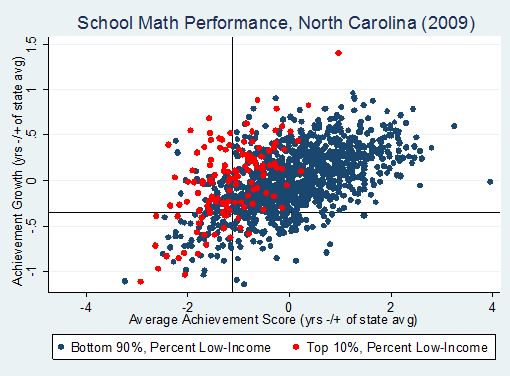
These data make clear that average test scores do a poor job of identifying the schools that contribute the least to students’ learning. Another way of showing this is to calculate the average growth of bottom-15% schools, as defined by each measure. We find that North Carolina students in the bottom-15% schools in terms of average scores learn about a third of a year less in math than the statewide average, whereas the difference for students in the bottom-15% of schools in terms of growth is more than half a year of learning.[3] Thus, the growth measure more accurately identifies those schools in which learning is not taking place. We find a similar pattern of results in reading and for both subjects in Florida.
The figure also shows how schools serving low-income students are punished by accountability systems based on average test scores. The red dots represent low-income schools (the 10 percent of schools with the highest share of free-lunch-eligible students). They are predominantly on the left side of the figure, which means that they tend to have low average scores, even though they are widely spread out in terms of their average student growth (i.e., they appear at spots high and low along the y-axis). Sixty-eight percent of low-income schools that would be identified as failing based on their average score would not be sanctioned based on academic growth. In fact, 34 percent of the low-income schools sanctioned based on average scores are actually above the statewide average in terms of academic growth.
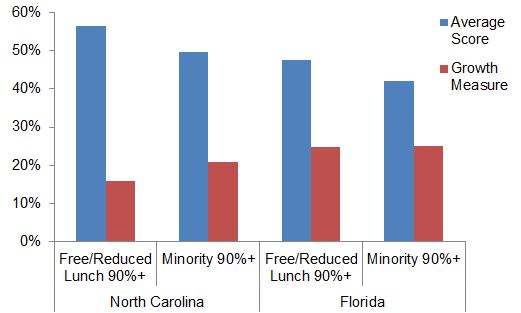
Accountability based on grade-span testing judges schools based on the students they serve, not how well they serve them. This is driven home by the figure below, which shows the percentage of schools serving predominantly low-income and minority students that would be labelled as failing (bottom-15%) based on their average scores as compared to our growth measure. Fifty-six percent of low-income schools would be classified as failing based on their average scores in North Carolina, whereas only 16 percent would be labelled as such based on their growth. The pattern is similar for schools that serve mostly minority students, and for both groups of schools in Florida.
Percent of Low-Income and High-Minority Schools Identified as Bottom-15%, by Measure
One possible alternative to growth-based measures is to use a single year of test data, such as would be available under a grade-span testing regime, but adjust it based on student demographics. In other words, schools serving students that tend to score lower, such as low-income and minority students, are compared to schools serving similar student bodies rather than all schools in the state. The figure below compares a demographic-adjusted average-score-based measure to our growth-based measure of school math performance for each school in North Carolina.[4]
Demographic-Adjusted Average Scores vs. Unadjusted Growth (correlation=0.56)
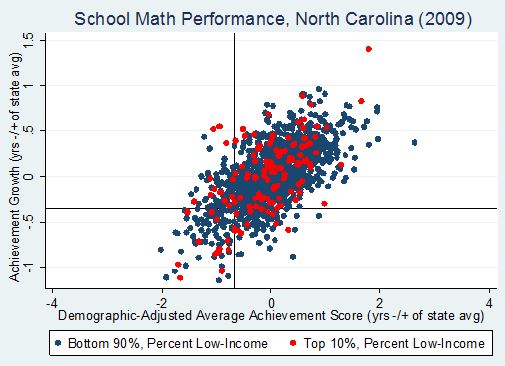
Growth-based measures and demographic-adjusted average test scores identify similar types of schools as low-performing, as shown by the fact that the red dots (low-income schools) are spread out in the figure, as opposed to clustered on the left-hand side. However, the two measures do not identify the same schools as low-performing; the correlation between the two measures is only 0.56. About seven percent of all schools would fall in the bottom 15 percent of schools based on their adjusted scores, but not based on their growth. The opposite is true as well, with schools with very poor growth avoiding sanction based on mediocre (but not terrible) average scores. Demographic-adjusted average test scores also do a worse job at identifying schools where students learn the least, with the average growth rates of bottom-15% schools based on this metric closer to that of the average score measure than the growth-based measure. The reason growth measures outperform demographic adjustments when judging school quality is straightforward: although student characteristics such as family income are strongly correlated with test scores, the correlation is not perfect.
In sum, our results confirm that using average test scores from a single year to judge school quality is unacceptable from a fairness and equity perspective. Using demographic adjustments is an unsatisfying alternative for at least two reasons. In addition to providing less accurate information about the causal impact of schools on their students’ learning, the demographic adjustments implicitly set lower expectations for some groups of students than for others.
Some civil rights advocates have voiced similar concerns about accountability systems that rely exclusively on growth measures, which could allow schools serving disadvantaged students to avoid sanction even if their students’ academic progress is insufficient to close achievement gaps. This is a legitimate concern, and policymakers may want to strike a balance between average scores and growth when deciding where to focus improvement efforts. However, not administering the annual tests required to produce student growth measures would make it impossible to distinguish those schools where students learn very little from those that perform well despite difficult circumstances.
An exclusive reliance on student performance levels, on the other hand, is perhaps the principal shortcoming of the much-maligned accountability system mandated by No Child Left Behind. Under that system, whether a school makes Adequate Yearly Progress is determined primarily based on the share of students scoring at proficient levels in math and reading in a given year. But a key reason Congress mandated such a system in 2002 was that many states were not yet administering annual tests, and many of those that did lacked the capacity to track the performance of individual students over time. Eliminating the annual testing requirement would therefore recreate the conditions that led to the adoption of a mistaken accountability system in the first place.
Policymakers thus face a stark choice: require annual testing or settle for low-quality and potentially misleading information on school quality.
[1] We thank Katharine Lindquist for exceptional research assistance. The analysis excludes observations from years in which a school tested less than a total of 20 students across the fourth and fifth grades.
[2] The average test score measure is simply the average fifth grade score (standardized by grade and year) of each school in each year. The growth measure is based on aggregated residuals from a regression of current-year scores in fourth and fifth grade on prior-year scores in both subjects (with squared and cubed terms included in addition to the linear terms) and grade-by-year fixed effects.
[3] Conversions of achievement growth to percent of a school year are based on effect sizes for fifth grade math reported in Hill et al. (2008), “Empirical Benchmarks for Interpreting Effect Sizes in Research, Child Development, 2(3): 172-177.
[4] We control for gender, race, eligible for free or reduced-price lunch, limited English proficiency, gifted, cognitive disability, other disability, and whether the student is repeating the grade.