

Student refusals to take standardized tests surged in New York State this spring, fueled by support from both parent activists and the state teacher’s union. According to the New York Times, the opt-out movement more than doubled the number of students who did not take federally mandated math and English Language Arts (ELA) tests, with 165,000 kids—about one in six—not taking at least one of the tests.
These total numbers mask enormous variation across communities. According to the Times analysis, barely any students opted out in some schools districts, while in other districts a majority of students refused the tests. Are these differences in opt-out rates random, or are they associated with the characteristics of the community served by each district? Do opt-outs tend to be concentrated among relatively affluent districts, or are they most common in schools that have historically performed poorly on state tests?
The data needed to best answer these questions are the student-level test-score and demographic information collected by the New York State Department of Education. They will allow the state education department to conduct fine-grained analyses, such as comparing the characteristics of students who took the tests to those who did not. But while we are waiting for the state to publish summary information based on those data, some light can be shed on these questions using publicly available data.
My primary data source for the following analysis is a table indicating the number of students who opted out of the math and ELA tests out in each school district this spring. The data were compiled by United to Counter the Core, an opt-out advocacy organization, from a combination of media stories, freedom of information requests, and reports by administrators, teachers, and parents. Data are available for most but not all districts, and there is likely some misreporting.[1] However, to my knowledge, it is the most comprehensive opt-out dataset currently publicly available.
I merged the opt-out information with the most recent available enrollment and demographic data from the U.S. Department of Education’s Common Core of Data.[2] I use total enrollment in grades 3-8 to estimate the percentage of students who opted out (i.e. the number of opt-outs, which are presumably for tests in grades 3-8, divided by the number of students enrolled in those grades).[3] I also calculate the percentage of students in all grades who were eligible for the federal free or reduced-price lunch program, an indicator of socioeconomic disadvantage. Finally, I obtained average student scores on the New York State tests last spring (2014), before opt-out became a widespread phenomenon.[4]
The 648 districts with complete data available had an average opt-out rate of 28 percent (the rates are averaged across the math and ELA tests). But weighting each district by its enrollment shows that an estimated 21 percent of all students at these districts opted out. The difference between these numbers implies that larger districts tend to have lower opt-out rates.
The table below confirms that opt-out rates vary widely across districts, with 19 percent of districts having an opt-out rate below 10 percent, 30 percent of districts in the 10-25 percent range, 38 percent in the 25-50 percent category, and 13 percent seeing a majority of students opt out. Districts with higher opt-out rates tend to serve fewer disadvantaged students and have somewhat higher test scores (which is not surprising given the correlation between family income and test scores). District size is similar across three of the opt-out rate categories, but districts with the lowest opt-out rates tend to be substantially larger, on average.
District Characteristics, by Opt-Out Rate
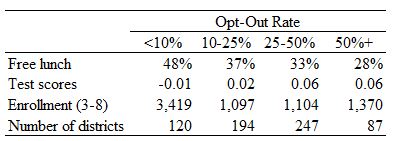
Notes: Average test scores are reported in student-level standard deviations.
But no single student characteristic is a perfect predictor of opt-out rates. The figure below plots the opt-out rate and free/reduced lunch percentage of every district. There is a clear association, with more disadvantaged districts having lower opt-out rates, on average, but also a large amount of variation in the opt-out rate among districts with similar shares of students eligible for the subsidized lunch program. Could variation in other factors such as test-score performance explain some of those remaining differences?
Relationship between Opting Out and Percent Free/Reduced Lunch
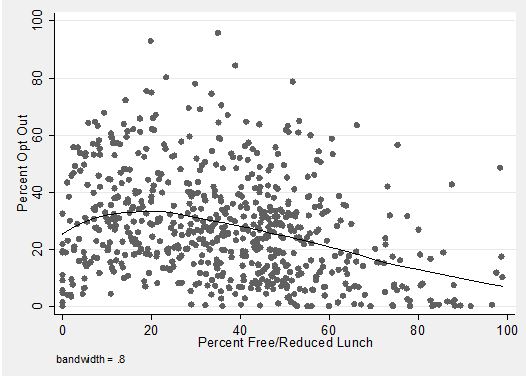
Notes: Line is based on a Lowess smoother.
I address this question using a regression analysis that measures the degree to which percent free/reduced lunch and average test scores are associated with opt-out, controlling for the other factor. In order to make the two relationships comparable, I report the predicted change in opt-out rates expected based on a one standard deviation change in percent free/reduced lunch or average test scores. Among the districts in the data, one standard deviation in percent free/reduced lunch is 21 percentage points and one standard deviation in average test scores is 0.35 student-level standard deviations.
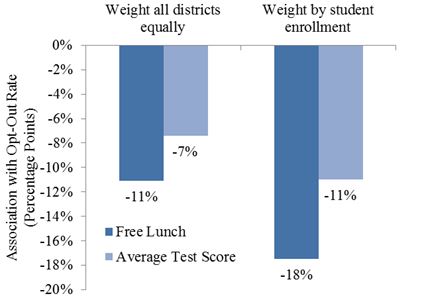
Perhaps the most surprising result of the analysis, reported in the figure below, is that the modest positive correlation between test scores and opt-out seen in the table above becomes negative once free/reduced lunch is taken into account.[5] The results below indicate that a one standard deviation increase in test scores is associated with a seven-percentage-point decline in the opt-out rate. That is a large change given that the average opt-out rate is 28 percent. Another way to describe the same relationship is that districts with lower scores have higher opt-out rates.
This analysis confirms that districts serving more disadvantaged students have lower opt-out rates, even after test scores are taken into account. A one standard deviation increase in the share of students eligible for free/reduced lunch is associated with an 11-percentage-point decrease in the opt-out rate. These relationships are even stronger when districts are weighted proportional to their enrollment, as shown in the right pair of bars in the figure below. This may be because these relationships are stronger in larger districts, or because opt-out is measured with less error in larger districts.
Correlation between District Characteristics and Opt-Out Rates
These findings should be interpreted with two caveats in mind. First, the data are incomplete, preliminary, and likely suffer from some reporting errors. Second, the data are at the district level, limiting the ability to make inferences about individual students. For example, just because lower-scoring districts have higher opt-out rates (controlling for free/reduced lunch) does not mean that lower-scoring students are more likely to opt out. It could be the higher-scoring students in those districts that are doing the opting out.
Student-level administrative data collected by the state will ultimately provide conclusive evidence not subject to these limitations, but the district-level data currently available yield two preliminary conclusions. First, relatively affluent districts tend to have higher opt-out rates, with opt-out less common in the disadvantaged districts that are often the target of reform efforts. Second, districts with lower test scores have higher opt-out rates after taking socioeconomic status into account. Potential explanation for this pattern include district administrators encouraging opt-outs in order to cover up poor performance, districts focusing on non-tested subjects to satisfy parents who care less about standardized tests, and parents becoming more skeptical of the value of tests when their children do not score well. Rigorous testing of these and alternative explanation for opt-out behavior await better data.
[1] The number of opt-outs for math or ELA is available for 649 out of the 714 school districts on the United to Counter the Core list, which is listed as being current as of May 14, 2015.
[2] Specifically, I use school-level data from 2011-12 and aggregate it to the district level. Note that these data are three years old relative to the current school year, which will introduce some measurement error into the analysis to the extent that district enrollment and demographics have changed over the past three years.
[3] The number of math and ELA opt-outs are highly correlated (r=.99), so I average them when data for both subjects are present (for districts where opt-out is only reported for one subject, I use that data point).
[4] I convert scale scores to student-level standard deviation units using the mean of 300 and standard deviation of 35 reported in the 2013 technical report. I then average the scores across all grades in the district, using the number of students tested in each grade as the weights. Math and ELA scores are highly correlated at the district level (r=0.94), so I average them.
[5] Unsurprisingly, there is a strong correlation between percent free/reduced lunch and average test scores (r=-0.77).