This report is part of “A Blueprint for the Future of AI,” a series from the Brookings Institution that analyzes the new challenges and potential policy solutions introduced by artificial intelligence and other emerging technologies.
When U.N. member states unanimously adopted the 2030 Agenda in 2015, the narrative around global development embraced a new paradigm of sustainability and inclusion—of planetary stewardship alongside economic progress, and inclusive distribution of income. This comprehensive agenda—merging social, economic and environmental dimensions of sustainability—is not supported by current modes of data collection and data analysis, so the report of the High-Level Panel on the post-2015 development agenda called for a “data revolution” to empower people through access to information.1
Today, a central development problem is that high-quality, timely, accessible data are absent in most poor countries, where development needs are greatest. In a world of unequal distributions of income and wealth across space, age and class, gender and ethnic pay gaps, and environmental risks, data that provide only national averages conceal more than they reveal. This paper argues that spatial disaggregation and timeliness could permit a process of evidence-based policy making that monitors outcomes and adjusts actions in a feedback loop that can accelerate development through learning. Big data and artificial intelligence are key elements in such a process.
Emerging technologies could lead to the next quantum leap in (i) how data is collected; (ii) how data is analyzed; and (iii) how analysis is used for policymaking and the achievement of better results. Big data platforms expand the toolkit for acquiring real-time information at a granular level, while machine learning permits pattern recognition across multiple layers of input. Together, these advances could make data more accessible, scalable, and finely tuned. In turn, the availability of real-time information can shorten the feedback loop between results monitoring, learning, and policy formulation or investment, accelerating the speed and scale at which development actors can implement change.
In a world of unequal distributions of income and wealth across space, age and class, gender and ethnic pay gaps, and environmental risks, data that provide only national averages conceal more than they reveal.
Data collection: From surveys to satellites and sensors
Traditionally, economists have relied on household consumption surveys and national account estimates to map patterns of poverty and to assess the impact of policy interventions, in particular, social assistance and social insurance programs. Conducting household surveys, however, is time-intensive, costly, and prone to error. In many countries, notably in the poorest countries and fragile states where development needs are greatest, survey data is simply unavailable. Between 2000 and 2010, 39 of 59 countries in Africa conducted fewer than two surveys, implying that no time trends could be reliably established.2 Even in those countries where more frequent household survey data is available, the quality is in doubt. For example, survey results vary considerably depending on the method used to identify consumption or income.
Kathleen Beegle et al. (2012) found that recall methods, requiring that respondents recall consumption over a defined period, measure lower consumption than personal diaries, in which respondents track their consumption in real-time.3 Survey results are notoriously at odds with national income accounts estimates of personal consumption, with the gap amounting to 60 percent of the total in some countries, including large countries with relatively sophisticated statistical systems like India and Indonesia.4 Micro studies suggest that survey answers depend on the type of respondent, reference period, and degree of commodity detail, all of which can be difficult to control across organizations and projects, and which are often changed from survey to survey, complicating any analysis of what is happening over time. Furthermore, underreporting is frequent in illiterate homes and among urban respondents, which can lead to large data gaps among poorer households.5
Big data from satellites, mobile phones, and social media, among other tools, allows researchers to build on, and in some cases, replace traditional methods of acquiring socioeconomic data. Its advantages are frequency and timeliness, accuracy and objectiveness. Its disadvantages are the fact that the indicators available are merely proxies for what policymakers are interested in and need for policy design.
Remote sensing satellites
Earth Observations (EO) provide finely tuned and near-real-time data on global terrain. These data are becoming widely available to public and private actors through platforms like the Global EO System of Systems (GEOSS). A coalition of 105 governments and 127 participating organizations, known as the Group on Earth Observations (GEO), is working to ensure that EO are accessible and interoperable.6 There is increasing recognition that these data can be used to support the 2030 Agenda for Sustainable Development.78
While satellite sensors have been widely adopted in the environmental science community to observe changes in weather, climate, and terrain, their application to economics is new. Researchers have found that high-resolution, spatially tuned satellite imagery can provide important insight into human economic activity. Because data is disaggregated to local levels, comparisons within and among countries are possible.9
While satellite sensors have been widely adopted in the environmental science community to observe changes in weather, climate, and terrain, their application to economics is new.
Social scientists have started to use nighttime light measures, or luminosity, as proxies for economic activity and population distribution. Satellites, like the U.S. Air Force Defense Meteorological Satellite Program (DMSP) Operational Linescan System (OLS), can map artificial light in cities, towns, and industrial centers on the Earth’s surface. Now declassified, the raw data are publically available. Several researchers have noted a correlation between nighttime light measures and country-level or subnational economic output. In 1997, Christopher Elvidge et al. identified a correlation between illuminated areas, electric power consumption, and GDP at the country level.10 Paul C. Sutton and Robert Costanza (2002) examined luminosity and GDP per square kilometer, also finding a high correlation.11 Xi Chen and William Nordhaus (2011) compared luminosity measures with conventional measures of output to indicate the value-add in data-poor countries. More recently, J. Vernon Henderson et al. (2012) determined that nighttime lights were “uniquely suited to spatial analyses of economic activity” and could serve as a proxy for GDP growth on the subnational level.12
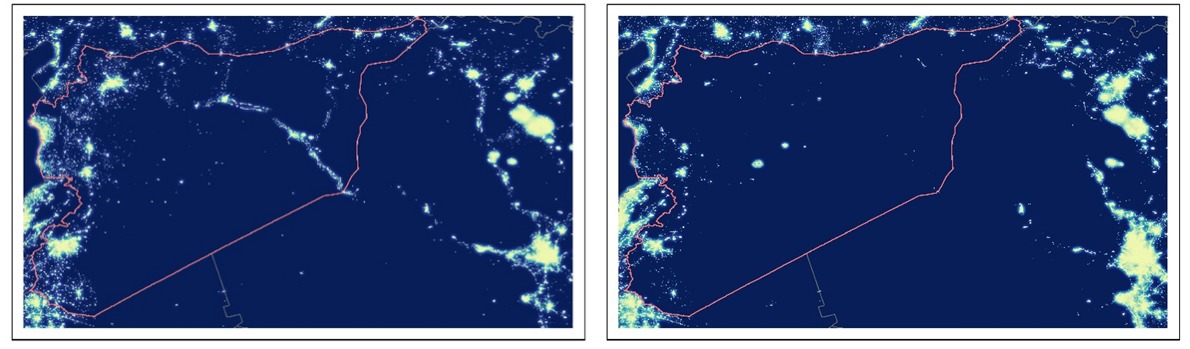
The satellite imagery below shows NASA Earth Observatory nighttime light data from Syria. The left hand image shows a concentration of Syria’s economic activity in two corridors in 2012. A North-South corridor on the country’s Western border, stretching from Damascus in the lower left of the image to Aleppo in the upper-left corner. The second corridor is a diagonal linking Aleppo with Baghdad in the lower-right corner. Just four years later, in 2016, the satellite captured a far darker image reflecting the losses to Syria’s economy and infrastructure during the ongoing civil war. In particular, Aleppo is barely visible, and the road from there to Baghdad no longer supports any economic activity. The luminosity of Damascus and its environs is also sharply reduced.
Figure 1: Satellite Imagery comparing Syria 2012 and 2016
Syria is a case in point where conflict made it impossible to collect data through any means other than remote sensing. And, in fact, many countries are constrained by budget or conflict, making satellite imagery the only option from which to infer socioeconomic characteristics.
There are limitations to this approach. Luminosity data is hard to interpret in low-output and high-output regions. In low-output regions, it is difficult to differentiate man-made lights from natural background lighting and reflections. In high-output regions, usually urban areas, the measure of bright lights may be capped by a saturation band, so that the metric is not smooth. Improvements in data quality to address these limitations are already happening and this will further open up the field to social scientists.
Cellphones, social media, and automated sensors
Mobile phone data can also be used to infer socioeconomic characteristics in a geographically disaggregated way. Cell phones are ubiquitous in developed and emerging economies. Call Detail Records (CDRs), which are stored and secured by Mobile Network Operators (MNOs) provide data on: (i) mobility, (ii) social interactions, and (iii) consumption and expenditure patterns (from the degree to which airtime is pre-paid). Joshua Blumenstock et al. (2015) used anonymized metadata from Rwanda’s largest cell phone network in combination with follow-up surveys to examine the extent to which mobile phone data can be used to estimate socioeconomic characteristics, and map a country-level wealth profile.13 When aggregated at a district level, Blumenstock et al. found that mobile phone data estimations were comparable to predictions using ground data collected by the Kigali Demographic and Health Survey (DHS). More granularly, historical records of an individual’s mobile phone use can accurately predict socioeconomic characteristics. Vanessa Frias-Martinez et al. determined that cell records can also be used to approximate costly and infrequent census information.14 They propose a new tool, CenCell, which uses behavioral patterns collected from CDRs to classify socioeconomic levels, with classification accuracy rates of up to 70 percent. The tool provides policymakers with affordable census maps at varying degrees of granularity. It should be noted that while CDRs provide detailed information on individual patterns of behavior, the data is proprietary and thus difficult to obtain. Additionally, questions over privacy and cybersecurity complicate efforts. Even when the data are available in the public domain, and individuals consent to its use for evaluation, some vulnerable populations may be underrepresented in mobile phone data.
Digital footprints from social media can also fill gaps in data for policymakers and development practitioners. For example, Google Trends (GT) reports, which provide real-time information on search queries at state and metro levels for several countries, have informed private consumption predictions.15 Google analytics could have broad-reaching utility for other socioeconomic measures.
Digital footprints from social media can also fill gaps in data for policymakers and development practitioners.
Once relegated to sci-fi films, robotics have expanded opportunities to collect in situ data on environmental indicators. Autonomous underwater vehicles (AUVs) and underwater smart devices allow researchers to explore uncharted areas of the ocean. Marine sensing technology provides real-time, multidimensional data on the sea surface and deep sea. UNESCO notes that it is now possible to incorporate marine sensors on submarine telecommunication cables at intervals of 50-70 km.16 These sensors could collect data on the seafloor and detect movement related to earthquakes or tsunamis. Above ground, a spinoff of Bivee Inc., Starling Data, has devised a unit that collects and transmits localized data in real-time without reliance on external power sources. Designed to improve data collection in developing economies, the unit tracks data on power quality, climate (rainfall, wind, humidity, etc.), and infrastructure (mapping, emissions), which it then uploads to the cloud. As the global community works in pursuit of economic progress joined with planetary stewardship, data on the environment will be increasingly important.
Data analysis: From hypothesis testing to machine learning
Machine learning (ML) allows researchers to analyze data in novel ways. Computers today can process multiple sets of data in little time and, with the correct classification sets, recognize highly complex patterns among them. Designed to simulate the interactions of biological neurons, “deep learning” uses artificial neural networks to discern features in successive layers of data while iterating on previously recognized trends. In the mid-1980s, artificial intelligence required that programmers classify data as part of the algorithms.17 Today, machines learn from and adapt to different inputs with little human supervision.
Neal Jean et al. (2016) explain how this might work in the field of economic development.18 Using a combination of survey and satellite data from Nigeria, Tanzania, Uganda, Malawi, and Rwanda, the Stanford team trained machines to recognize visual patterns that could then make predictions about socioeconomic distributions. Neal Jean et al. employed a particular type of machine learning, known as convolutional neural networks (CNNs), to improve the accuracy of their forecasts. Here’s how it works: the CNN model pre-trains on ImageNet, a classification data set with over 1,000 different categories of labeled images, to discern visual features that appear in daytime satellite imagery. Next, programmers train the CNN to predict which features best explain the variance observed in nighttime light intensities. Finally, these daytime features are combined with cluster-level, geolocated socio-economic variables from survey data (such as USAID supported Demographic and Health Surveys) to build ridge regression models. The model parameters can then be used to extend forecasts to areas of the country not covered by the DHS, to get comprehensive national maps, such as poverty and mortality maps. Jean et al. determined that CNN estimates could accurately predict average household consumption and asset wealth in Nigeria, Tanzania, Uganda, Malawi, and Rwanda. In addition, their model outperformed luminosity and mobile-phone only approaches.
Applications of artificial intelligence, like the one detailed above, could have a sweeping impact on the development field. Training machines on multiple layers of input reduces inaccuracies while allowing researchers to include a rich variety of publically available variables by merging geocoded data sets with infrastructure variables and social indicators.
Policymaking using data analysis and feedback loops
There are a number of examples that illustrate the ways data analytics can inform global development. These include using satellite imagery to map schools, identifying the hidden costs of conflict and reconciliation, tracking illegal mining, and addressing rapid urbanization. We elaborate on these examples below.
Employing satellite imagery to map schools in Kyrgyzstan
The government of Kyrgyzstan previously relied on administrative data to evaluate school placement, determine expected volume of students, and allocate classroom resources. It has recently adopted a new program called “Taza Koom,” designed to increase access to 21st century skills in schools across the country. The program faced significant barriers. For example, as of March 2017, 40 percent of schools lacked access to basic internet services.19 UNICEF Kyrgyzstan teamed with the government to generate a highly detailed map of schools with real-time measures of connectivity, overlaid with additional sources of data that could serve as proxies for education efficiency. The hope is that this system will give national stakeholders the insights they need to address digital gaps in the school system.
Kyrgyzstan’s school mapping project is part of a broader UNICEF Innovation initiative to map every school in the world. In collaboration with UC San Diego’s Big Pixel Initiative and Development Seed, UNICEF is developing a convolutional neural network to recognize patterns in satellite imagery that could be used to locate schools. UNICEF has joined traditional measures of data collection with crowdsourcing methods and remote sensing observations. To aid decision-making, the data will be available in real-time on an online platform.
Identifying the hidden costs of conflict and reconciliation in Colombia
Decades of conflict between the government of Colombia and the guerilla group Revolutionary Armed Forces of Colombia (FARC) left large portions of the Colombian Amazon unexamined. Now that FARC guerilla fighters have vacated the forest, scientists are quickly working to document Colombia’s distinct ecosystem and biodiversity.20 Geoscientist Ruiz Carrascal is building a network of climate sensors that monitor temperature and humidity in alpine regions.21 Meanwhile, more than 40 researchers have kick-started a digital platform that collects and analyzes data on a wide range of environmental indicators, including species distribution, forest cover, and weather patterns.
Related Content


Fears of rapid urbanization give urgency to the effort to analyze Amazonian data. After FARC abandoned its strongholds, logging, cattle, and gold-mining industries expanded their operations into the forest. While this has brought much-welcomed economic growth to the region, it has also brought about rapid deforestation: post-peace accords, the rate has increased by 44 percent.22 The hope is that new in situ environmental sensors and machine learning techniques will generate models that can predict threats to conservation. This information could then inform policies to better protect forested areas and encourage both peace and sustainable development.
Harnessing Earth observations to track illegal mining in Ghana
Illegal mining is prevalent in Ghana. At least 30 cocoa farmers in the regions outside of Dunkwa, in Ghana’s Central region, have sold their plantations to gold miners, who quickly excavate the land.23 The cost of these often-illegal operations is high: in addition to supporting an illicit economy, gold mining contributes to deforestation and water contamination. While the government of Ghana works to balance the economic benefits of small-scale gold mining alongside environmental conservation, getting the balance right is proving difficult. The Small-Scale Gold Mining Act of 1989 permitted groups of nine or fewer to mine for gold. An updated law from 2006 requires that miners obtain licenses from the Ghanaian Environmental Protection Agency and Forest Commission, but enforcement of these regulations is difficult.
Data from the Africa Regional Data Cube (ARDC) could help policymakers identify topographic changes and track illegal mining operations.24 The ARDC collects EO data, including 17 years of satellite imagery archives, on Kenya, Senegal, Sierra Leone, Tanzania, and Ghana. It combines 8,000 visual layers across a defined period of time to produce localized, easily accessible data. The ARDC’s ability to compare changes in land across many years in Ghana could help policymakers identify and enforce regulation of extractive industries.
Addressing rapid urbanization in Sierra Leone through high-resolution poverty mapping
Rapid urbanization in Sierra Leone has contributed to major inequities. As of 2015, 40 percent of the national population lives in urban areas.25 Of that, 50 percent lives in the Western Region, where Freetown is located, compared to 10 percent in the Southern Region.26 Due to rapid population growth in Freetown, affordable land and housing are in short supply. Estimates place the housing deficit at 166,000 units.27 Land degradation has further complicated efforts to improve the situation. Sierra Leones’s Environmental Protection Agency warns that deforestation associated with unplanned dwellings and the rise of informal settlements is leading to soil erosion, among other environmental issues. In 2017, flooding killed upward of 400 people and contributed to rising homelessness.
The Africa Regional Data Cube could help policymakers track rapid urbanization in Sierra Leone.28 High-resolution satellite imagery of land cover and human settlements may aid efforts to identify vulnerable populations and improve city planning.29 GRID3—a project led by the United Nations Population Fund, U.K. Department for International Development, Bill & Melinda Gates Foundation, WorldPOP/Flowminder, and Columbia University’s Center for International Earth Science Information Network—also aims to build robust geospatial data for population mapping, among other policy priorities. GRID3 is already being used in Nigeria to identify and collect data on settlements across the country to improve public health responses (starting with polio eradication) and it could be used in a similar way to deliver better policy outcomes in other countries.
Remote sensing can aid efforts to calculate the number of individuals living in poverty, and determine where they are located. This could have far-reaching advantages for the development community.
In fact, subnational mapping of population distributions and wealth profiles is already garnering attention within the academic community. Christopher Elvidge et al. (2009) produced the first satellite-generated, spatially disaggregated global map of poverty.30 He and his team used four types of remote sensor data—DMSP lights, MODIS land cover, Shuttle Radar Topography Mission (SRTM) topography, and National Geospatial Intelligence Agency’s Controlled Image Base (CIB) —calibrated with 2006 World Development Indicators national poverty levels to estimate the number of people living in poverty. Their estimates show that remote sensing can aid efforts to calculate the number of individuals living in poverty, and determine where they are located. This could have far-reaching advantages for the development community.
Recommendations for action
Social science is just beginning to exploit big data and machine learning. In each area—data collection, data analysis, and policymaker use of analysis—there is scope for improvements. There are a number of actions that would improve access to big data, improve the use of data analytics, and use machine learning to monitor outcomes and drive policymaking.
Improve access to and cost of big data.
Data is expensive and, increasingly, is held within private companies. Researchers must negotiate access to data such as Call Detail Records on a case-by-case basis. However, the telecommunications companies that currently collect these data are concerned about privacy issues (although researchers typically ask for aggregated data) and are reluctant to give away for free data that they could potentially sell.
Granted, generating data is expensive, so a core challenge will be funding. High-quality satellite machinery is expensive and requires ongoing maintenance. The Department of the Navy and Department of the Air Force spent a combined $29.8 million in FY15 to acquire and process data from the Department of Defense’s Defense Meteorological Satellite Program (DMSP) and other sources of SBEM data.31
To implement this recommendation, two things are needed. First, a set of ethically based protocols for provision of mobile data, along with an agreement with companies that they provide public access to such data as a condition of their license to operate. Second, governments, especially rich country governments with satellites, should provide access to the imagery for free or at marginal cost (which, given the digital technology involved, is almost free).
Improve big data analytics.
Data providers are often surprised that remote sensing data is being used for social science purposes. Their primary audience is in the military and intelligence services and the data tend to be mostly classified. However, this restricts data availability and timeliness in a way that compromises machine learning. Robust classification sets are needed to train the artificial neural networks. Additionally, machines require some degree of human supervision. Many of the countries that most need data analysis do not have the statistical infrastructure, nor do they have sufficient numbers of trained personnel, to employ “deep learning” techniques.
To implement this suggestion, data providers should work with analysts to understand better what kinds of data would enable better machine learning.
Use machine learning to monitor outcomes and drive policymaking, with particular attention to spatial implications.
Policymakers in economic development are largely unfamiliar with big data and its potential benefits, especially in identifying spatial issues. Development projects and interventions are over-designed at the beginning, with long gestation periods to try to overcome potential obstacles and bottlenecks. As a result, despite significant investment in monitoring and evaluation, the time frames involved are very long: decades from project concept to completion, followed by more years in evaluation and development of new approaches.
Machine learning offers an opportunity to shortcut this process, but policymakers have not yet systematically built into project design feedback loops that would permit rapid fine-tuning, while projects are being implemented. Results-based approaches require a mindset change: away from evaluating results and toward constantly learning to scale up and improve results. Such a mindset change will require very different project designs.
Conclusion
Emerging technologies have transformed three core areas: (i) data collection; (ii) data analysis and (iii) use of data analysis for policymaking. New big data platforms allow researchers to acquire granular details on a number of socioeconomic and environmental indicators. Remote sensing satellites provide real-time luminosity and daytime pictures that can serve as proxies for human economic activity, as well as determine changes to land cover and urban features. Other sources of geospatial data—like Call Detail Records, social media footprints, automated marine sensors, and climate-measuring devices—expand the scope and volume of information available to policymakers. Meanwhile, advances in data analytics transform the way in which data scientists and machines manipulate large sets of data. Artificial neural networks make it possible to recognize patterns across multiple layers of input, improving accuracy and permitting multidimensional analyses. Policymakers have used this information to map digital connectivity across schools in Kyrgyzstan, assess deforestation in Colombia following the peace process, track illegal mining operations in Ghana, and improve city planning in the Western Region of Sierra Leone, to name a few examples. Agenda 2030 has at its disposal a new digital toolkit that is spearheading a data revolution.
Conventional methods of data collection, which require substantial time to conduct and disseminate, have hindered efforts to implement change quickly and effectively.
The global community is entering a new world, where real-time data is shortening the feedback loop between outcomes and policy. Conventional methods of data collection, which require substantial time to conduct and disseminate, have hindered efforts to implement change quickly and effectively. By the time reports are available to key decision-makers, data on the ground have already changed. In contrast, big data and artificial intelligence allow researchers to acquire up-to-date information at varying degrees of granularity, while simultaneously processing for patterns that can inform policy.
The key to this data revolution is trust. How can the development community foster trust among individuals, whose socioeconomic data are critical to achieving sustainable solutions, at a time when concerns are mounting over privacy and cybersecurity? Relatedly, how can researchers assure policymakers that machine-generated analyses can be trusted as evidence on which to base key policy decisions?
While emerging technologies bring about a number of technical solutions, transformation will be felt most acutely in our ability to learn and adapt alongside the machines. After all, artificial intelligence is not a panacea. Only when machine learning is coupled with human insight will the global community achieve sustainable development solutions.
Authors

-
Footnotes
- United Nations, High-Level Panel of Eminent Persons on the Post-2015 Development Agenda: A New Global Partnership: Eradicate Poverty and Transform Economies through Sustainable Development, (New York: United Nations Publications, 2013)
- World Bank. A Measured Approach to Ending Poverty and Boosting Shared Prosperity: Concepts, Data, and the Twin Goals. (Washington, D.C.: World Bank, 2015), http://www.worldbank.org/en/research/publication/a-measured-approach-to-ending-poverty-and-boosting-shared-prosperity. PovcalNet online poverty analysis tool, https//iresearch.worldbank.org/povcalnet/ (2015); quoted in Jean, Neal, Marshall Burke, Michael Xie, W. Matthew Davis, David B. Lobell, Stefano Ermon, “Combining satellite imagery and machine learning to predict poverty,” Science 353, no. 6301 (August 2016): 790-794. doi: 10.1126/science.aaf7894
- Beegle, Kathleen, Joachim De Weerdt, Jed Friedman, and John Gibson, “Methods of household consumption measurement through surveys: Experimental results from Tanzania,” Journal of Development Economics 98. no. 1 (May 2012): 3-18. Science Direct.
- Pinkovskiy and Xavier Sala-i-Martin, “Lights, Camera…Income! Illuminating the National Accounts Household Survey Debate,” The Quarterly Journal of Economics 131, no. 2 (May 2016): 579-631. doi: 10.1093/qje/qjw003
- Beegle, Kathleen, Joachim De Weerdt, Jed Friedman, and John Gibson, “Methods of household consumption measurement through surveys: Experimental results from Tanzania,” Journal of Development Economics 98. no. 1 (May 2012): 3-18. Science Direct.
- Group on Earth Observations. https://earthobservations.org/index2.php (accessed September 17, 2018).
- Anderson, Katherine, Barbara Ryan, William Sonntag, Argyro Kavvada, and Lawrence Friedl, “Earth observation in service of the 2030 Agenda for Sustainable Development,” Geo-spatial Information Science 20, no. 2 (June 2017): 77-96. Taylor & Francis Online.
- See, Linda, Steffen Fritz, Inian Moorthy, Olha Danylo, Michiel van Dijk, and Barbara Ryan, “Using Remote Sensing and Geospatial Information for Sustainable Development,” In From Summits to Solutions: Innovations in Implementing the Sustainable Development Goals, edited by Raj M. Desai, Hiroshi Kato, Homi Kharas, and John W. McArthur, 172-198. Washington, D.C.: The Brookings Institution, 2018.
- Ibid.
- Elvidge, Christopher D., Kimberly E. Baugh, Eric A. Kihn, Herbert W. Kroehl, Ethan R. Davis, and C.W. Davis, “Relation between satellite observed visible-near infrared emissions, population, economic activity and electric power consumption,” International Journal of Remote Sensing 18, no. 6 (1997): 1373-1379. doi: 10.1080/014311697218485
- Sutton, Paul C. and Robert Costanza, “Global estimates of market and non-market values derived from nighttime satellite imagery, land cover, and ecosystem service valuation,” Ecological Economics 41, no. 3 (June 2002): 509-527. doi: 10.1016/S0921-8009(02)00097-6
- Henderson, J. Vernon, Adam Storeygard, and David N. Weil, “Measuring Economic Growth from Outer Space,” American Economic Review 102, no. 2 (April 2012): 994-1028. American Economic Association.
- Blumenstock, Joshua, Gabriel Cadamuro, and Robert On, “Predicting poverty and wealth from mobile phone metadata,” Science 350, no. 6264 (November 2015). doi: 10.1126/science.aac4420
- Frias-Martinez, Vanessa, Victor Soto, Jesus Virseda, Enrique Frias-Martinez, “Can Cell Phone Traces Measure Social Development?” Third Conference on the Analysis of Mobile Phone Datasets, NetMob 2013, Boston, MA, 2013 (Oral Presentation).
- Schmidt, Torsten and Simeon Vosen, “Forecasting Private Consumption: Survey-based Indicators vs. Google Trends,” Journal of Forecasting 30, no. 6 (September 2011): 565-578. doi: 10.1002/for.1213
- “The Ocean We Need for the Future: Proposal for an International Decade of Ocean Service for Sustainable Development,” United Nations Educational, Scientific and Cultural Organization (2017). http://www.unesco.org/new/en/media-services/single view/news/towards_an_international_decade_of_ocean_science_for_sustain/
- Hof, Robert D. “Deep Learning: With massive amounts of computational power, machines can now recognize objects and translate speech in real time. Artificial intelligence is finally getting smart,” MIT Technology Review. https://www.technologyreview.com/s/513696/deep-learning/
- Jean, Neal, Marshall Burke, Michael Xie, W. Matthew Davis, David B. Lobell, Stefano Ermon, “Combining satellite imagery and machine learning to predict poverty,” Science 353, no. 6301 (August 2016): 790-794. doi: 10.1126/science.aaf7894
- “Magic Box – School Mapping,” UNICEF. http://unicefstories.org/magicbox/schoolmapping/
- Reardon, Sara, “FARC and the forest: Peace is destroying Colombia’s jungle – and opening it to science,” Nature International Journal of Science 558 (June 2018). doi: 10.1038/d41586-018-05397-2
- Ibid.
- Ibid.
- Taylor, Kevin and Marisa Schwartz Taylor, “Illegal Gold Mining Boom Threatens Cocoa Farmers (And your Chocolate),” National Geographic, March 6, 2018. https://news.nationalgeographic.com/2018/03/ghana-gold-mining-cocoa-environment/
- Melamed, Claire, “The Africa Regional Data Cube: Harnessing Satellites for SDG Progress,” Global Partnership for Sustainable Development, June 19, 2018. http://www.data4sdgs.org/news/africa-regional-data-cube-harnessing-satellites-sdg-progress
- Diagne, Alioune, “Sierra Leone 2015 Population and Housing Census: Thematic Report on Migration and Urbanization,” Statistics Sierra Leone (October 2017). https://sierraleone.unfpa.org/
- Ibid.
- “Flooding in Free town: a failure of planning?” Africa Research Institute, November 6, 2015. https://www.africaresearchinstitute.org/newsite/blog/flooding-in-freetown-a-failure-of-planning/
- Melamed, Claire, “The Africa Regional Data Cube: Harnessing Satellites for SDG Progress,” Global Partnership for Sustainable Development, June 19, 2018. http://www.data4sdgs.org/news/africa-regional-data-cube-harnessing-satellites-sdg-progress
- Galeon, Florence A., “Estimation of Population in Informal Settlement Communities Using High Resolution Satellite Image,” The International Archives of the Photogrammetry, Remote Sensing and Spatial Information Sciences XXXVII, B4 (Beijing 2008): 1377-1382. ResearchGate.
- Elvidge, Christopher D., Paul C. Sutton, Tilottama Ghosh, Benjamin T. Tuttle, Kimberly E. Baugh, Budhendra Bhaduri, and Edward Bright, “A global poverty map derived from satellite data,” Computers and Geosciences 35, no. 8 (August 2009): 1652-1660. doi: 10.1016/j.cageo.2009.01.009
- United States Air Force, “Department of Defense Plan to Meet Joint Requirements Oversight Council Meteorological and Oceanographic Collection Requirements,” (2016). Defense Daily Network: http://cdn.defensedaily.com/