

This section presents a time-lagged analysis of the relationship between tracking—the practice of assigning students to different academic classes based on prior achievement1—in eighth grade and two later outcomes related to the Advanced Placement program (AP): participation rates and successful performance on AP tests in high school. The theory motivating the analysis is that academically advanced students may gain long term benefits from accelerated coursework in middle school. Just as star high school athletes do not walk onto a basketball court or football field for the first time as seniors in high school, successful AP calculus students do not encounter advanced mathematics for the first time in 12th grade.
Preparation matters. In communities across the country, pipelines are in place to nurture and develop promising young athletes.2 Not so with academic stars. Why not? In a word, because singling out advanced students for special coursework involves tracking. Accelerated or honors courses, offering above grade level curricula to students who are ready for it, typically start in middle school. They allow high-achieving youngsters to move at a faster pace than their grade level peers.
Related Content

But tracking is controversial. By definition, it involves differentiating students in terms of their skills and knowledge. Black, Hispanic, and socioeconomically disadvantaged students are historically underrepresented in accelerated tracks. As such, the charge that tracking discriminates against these students has shaped the frequency of its use across different communities. Tracking is more prevalent in suburban middle class communities and in schools serving white and Asian students and less prevalent in urban schools and schools serving predominantly black, Hispanic, or disadvantaged populations.
Whether middle school tracking is associated with AP outcomes is a timely question. Recent research on tracking that employs techniques to minimize selection bias and other shortcomings of previous research, has documented examples of tracking being used to promote equity. AP classes, along with the International Baccalaureate program, represent the pinnacle of advanced coursework in U.S. high schools. They are the end of the pipeline preparing academically gifted students for college. Boosting access to AP classes for groups historically underrepresented in AP is a key element of the contemporary equity agenda for high schools. In opposition to these trends, tracking’s critics remain steadfast. The advent of the Common Core State Standards (CCSS) may furnish critics with a politically powerful shield for dismantling tracking in middle schools (see the study of Common Core in this issue).
Background
In the 1970s, the charge that tracking produces discriminatory social effects rose to public awareness just as tracking itself was changing. Since the early 20th century, curriculum differentiation occurred by assigning students to tracks that encompassed all academic subjects. The names of tracks vaguely denoted post-secondary destinations, with “college prep,” “vocational,” and “general” being the most common labels. Students were assigned to tracks based on IQ tests measuring general aptitude or achievement tests measuring prior learning. By the 1970s, tracking had changed. Omnibus tracking was replaced by subject-specific assignment to courses (i.e., students simultaneously could be placed in remedial reading and a higher level math class), IQ testing fell into disfavor, and parents increasingly could override schools’ initial placement and demand a different track if they wanted more or less challenge for their children than schools recommended.
The anti-tracking movement gained steam in the 1990s. It had little effect on high schools, but middle schools were another story.
The changes did not reduce the attacks on tracking. In 1985, Jeannie Oakes’ “Keeping Track” was published. Oakes acknowledged that tracking had changed but dismissed the modifications as trivial. Schools, Oakes charged, were still systematically denying kids opportunity in ways that correlated with race and class. Oakes built her critique on the theories of Marxian analysts Samuel Bowles and Herbert Gintis, whose 1976 book, “Schooling in Capitalist America,” argued that schools are structured with the intention to reproduce social inequalities. Despite its ideological underpinnings, the tracking critique drew surprising support across the political spectrum. In What Do Our 17-Year-Olds Know?, two former members of the Reagan and Bush administrations respectively, Checker Finn and Diane Ravitch single out tracking as a cause of students’ poor performance on National Assessment of Educational Progress (NAEP) tests of history and literature.3
The anti-tracking movement gained steam in the 1990s. It had little effect on high schools, but middle schools were another story. Across the country, middle schools began paring back tracking, especially in English-language arts, science, and history. By the end of the decade, a majority of middle school students attended heterogeneously grouped classes in those subjects.4Math classes remained tracked, but with fewer levels—typically just one level offering algebra and one level offering pre-algebra or a general eighth grade math course. The frequency of tracking in academic subjects remains similar today.
Recent research on tracking and equity
A challenge to research on the effects of tracking has been adequately controlling for selection effects. In this case, the term “selection effect” refers to the nonrandom assignment of students to tracks. High- and low-track students are assigned to their respective tracks because of different amounts of prior learning and the anticipation of different amounts of future learning. To discover that high-track students learn more than low-track students may simply be an extension of how the students were “selected” into respective tracks in the first place and may have nothing to do with tracking itself. In addition, schools do not make policy choices randomly, and they may have decided to track or to heterogeneously group students for reasons related to achievement.
Recent research indicates that high-achieving students may benefit from tracking.
Experiments in which students are randomly assigned to tracked and untracked settings are rare. In 2005, an experiment in Kenya could be conducted because schools were granted extra funds to hire first grade teachers.5 More than a hundred schools (121) had only one first grade teacher, and the new money allowed the addition of a second teacher. The schools were randomly assigned to either a tracked or untracked condition. In the tracked schools, one of the classes was made up of higher achievers, the other of lower achievers. Students were placed in either the higher- or lower-achieving class based on whether they scored above or below the median for all students. Students in the untracked schools were assigned to the two classes randomly, creating classes heterogeneous in ability.
The experiment ran for 18 months. Both high- and low-achievers in the tracked schools gained more on achievement tests compared to students in the untracked schools. The benefit for students in higher-achieving classes was 0.19 standard deviations and for those in the lower-achieving classes,0.16 standard deviations.
Conditions that allow for experiments are quite unique, so analysts have also used quasi-experimental designs to evaluate tracking. Takako Nomi investigated a 1997 policy in Chicago that abolished remedial math classes in ninth grade and created mixed-ability algebra classes in their place. Employing an interrupted time-series design and difference-in-differences analysis, Nomi found that high achievers paid a price for abandoning tracking in favor of heterogeneously grouped classes. An analysis of class composition using instrumental variables indicated that peer effects were driving much of the effect. A one standard deviation decline in peer skills was associated with about a one-quarter standard deviation decline in high achievers’ test scores.6
Related Books

David N. Figlio and Marianne E. Page (2000) also used an instrumental variable strategy to isolate the effects of tracking. They found that wealthier families consider whether a school tracks when making enrollment decisions. After controlling for those parental decisions, Figlio and Page found that disadvantaged students benefitted from tracking, contradicting the notion that abolishing tracking promotes equity. As they put it, “…tracking programs are associated with test score gains for students in the bottom third of the initial test score distribution. We conclude that the move to end tracking may harm the very students it is intended to help.”
Chao Fu and Nirav Mehta (2015) looked at tracking using data from the Early Childhood Longtitudinal Study, a large national database. In contrast to Figlio and Page, they found a trade-off, with tracking benefitting high-ability students and hurting low-ability students. Defining low- and high-ability students in the same manner as the study in Kenya (above and below the median of achievement), Fu and Mehta’s model predicts that de-tracking would raise the test scores of low-achieving students by 0.04 standard deviations and depress high-achievers’ scores by 0.05 standard deviations.
David Card and Laura Giuliano (2014) studied the effects of gifted classes in a large Eastern school district. The district had mandated that schools with even a single gifted student (most of whom were identified by IQ tests) must provide separate gifted classes in fourth and fifth grades, with open seats in these classes filled by high achievers—the school’s highest performers on the annual state assessment. The policy dramatically increased the proportion of disadvantaged students in the gifted classes to about 40 percent districtwide. The researchers found significant positive effects for high achievers in the program, in particular for low-income black and Hispanic students. Card and Giuliano concluded, “Our findings suggest that a comprehensive tracking program that establishes a separate classroom in every school for the top-performing students could significantly boost the performance of the most talented students in even the poorest neighborhoods, at little or no cost to other students or the District’s budget.”7
In sum, recent research indicates that high-achieving students may benefit from tracking and suffer losses from heterogeneous grouping. The studies have primarily assessed achievement effects from one to two years of attending high tracks. The following study takes a longer perspective and examines outcomes at the end of high school that may be associated with tracking in eighth grade.
Data
The analysis below examines data from the national cohort of students who were eighth graders in 2009 and graduated from high school in 2013.8 Data on eighth grade tracking come from the National Assessment of Educational Progress.9 The percentage of students attending schools with tracked eighth grade math classes, aggregated to the state level, serves as a proxy for middle school tracking practices. Data on AP participation and performance come from the “Tenth Annual AP Report to the Nation.”10 As with the NAEP data, state-level data are used in the analysis. AP participation refers to the percentage of each state’s public high school graduates who took at least one AP exam during high school. AP performance represents the percentage of each state’s AP test takers who scored a three or better on at least one test. That is the typical threshold that colleges and universities require for granting college credit.
The following study examines outcomes at the end of high school that may be associated with tracking in eighth grade.
The data possess several limitations. Tracking practices are modeled using information from only one subject. Math is the most commonly tracked subject in middle schools, but using data from other subjects might yield different results. Taking an AP test is not the same as taking an AP course. Some students take AP courses but do not sit for the AP exam. Students are counted as AP participants if they took an AP exam at any point in their high school careers. Students who took multiple AP tests only count as one test taker in the data, and the count of students scoring three or higher (3+) are those who did so on any single AP test, regardless of their scores on other AP tests.
The initial research question this study examines is: Were state tracking practices for eighth graders in 2009 related to AP outcomes in 2013? A question pertinent to equity will also be explored: Do the results vary by race? AP outcomes for black, Hispanic, and white students are scrutinized.
Analysis
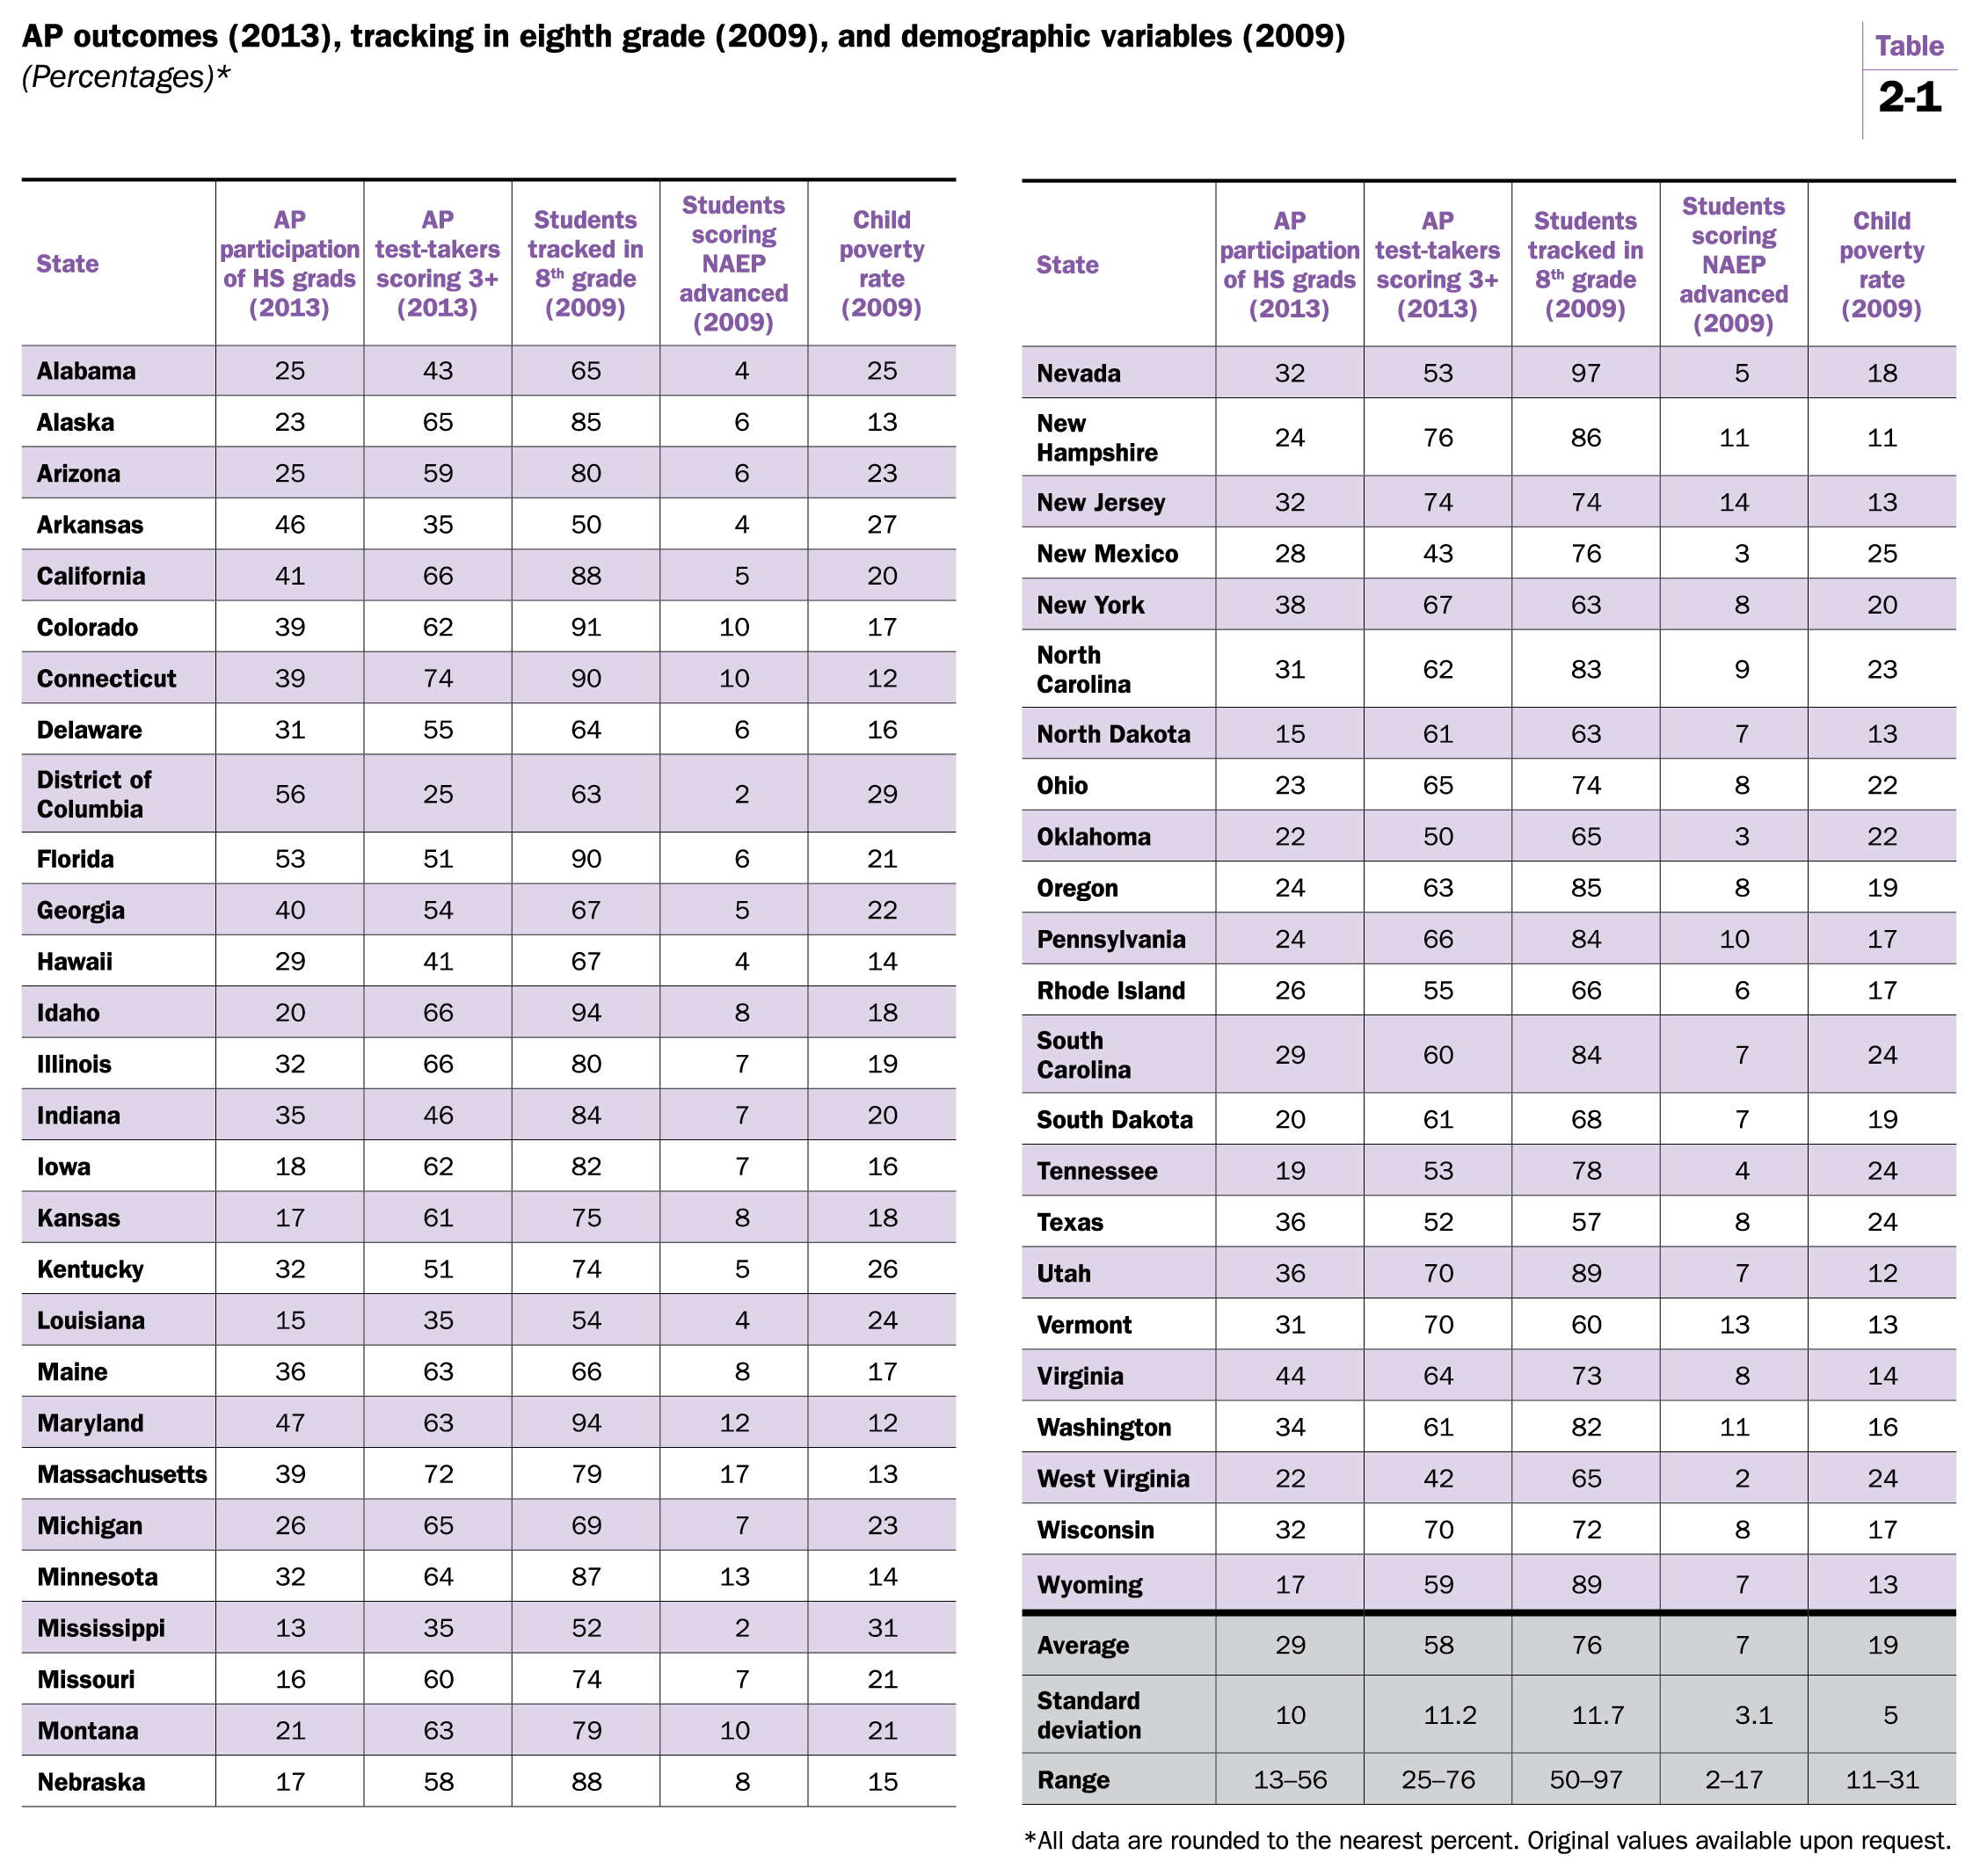
Table 2-1 displays the study’s data, with summary statistics reported in the bottom rows. The state average for AP participation in 2013 was 29 percent, meaning that for the typical state almost three out of 10 graduates in the class of 2013 had taken an AP exam at some point during their high school years. Participation rates ranged from a low of 13 percent in Mississippi to a high of 56 percent in the District of Columbia. In the average state, more than half (58 percent) of students who had taken an AP exam earned a score of three or higher. The lowest 3+ rate was registered by the District of Columbia (25 percent) and the highest by New Hampshire (76 percent), suggesting a possible trade-off between heightened access to AP and selectivity. As just mentioned, D.C.’s participation rate was the highest in the country; New Hampshire ranked 35th.
Tracking is significantly correlated with performance on AP tests.
The contrast is merely suggestive. The data do not allow for one to tease out whether access and selectivity are inversely related. Trade-offs made by educators at the school or district levels may be masked by aggregating data to the state level. Further research is needed using school or district data, collected, in other words, at the policymaking level where AP offerings are decided.
The popularity of tracking in eighth grade math is evident. The average state tracked about three-quarters of its math students, with Arkansas the least tracked state (50 percent) and Nevada the most tracked (97 percent). The percentage of eighth graders scoring at the “advanced” performance level on the 2009 NAEP math test is included as a control variable. Notice how stringent the NAEP advanced level is. The average state has only about 7 percent of eighth graders scoring at this level. Prior achievement is an important covariate in any model predicting academic outcomes, whether the outcomes of interest are measured at the individual, school, or state level. Considering the current study’s focus on high achievers, a state’s percentage of students reaching the NAEP advanced level is an appropriate control. States that had a lot of high-achieving eighth graders in 2009 probably also had a lot of high-achieving high school graduates in 2013—and that will surely influence the AP outcome variables. The final column shows the percentage of children in poverty for each state.
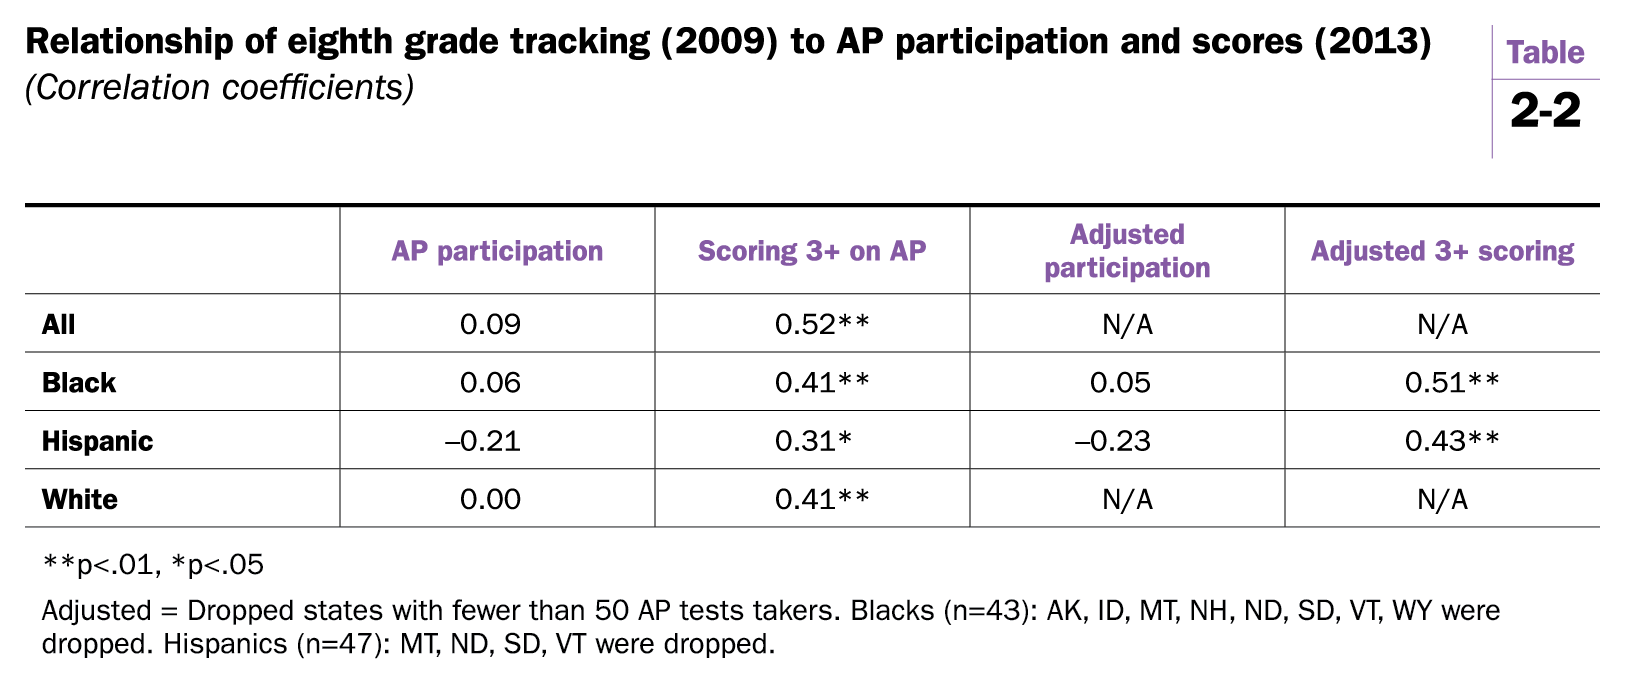
Table 2-2 reports correlation coefficients for the relationship of eighth grade tracking to AP outcomes. Correlations are also reported for AP outcomes disaggregated by race and ethnicity. Eighth grade tracking shows no statistically significant relationship with AP participation. The percentage of a state’s graduating class that has taken an AP test is unrelated statistically with the amount of tracking going on four years earlier. Tracking is significantly correlated with performance on AP tests, and the positive relationship holds for the performance of black, Hispanic, and white subgroups.
The positive relationship holds for the performance of black, Hispanic, and white subgroups.
States with larger percentages of tracked eighth graders produce larger percentages of high-scoring AP test takers. States where tracking is less prevalent tend to have a smaller proportion of high scorers. Highly tracked states with an above average share of 3+ AP scorers include: California (88 percent tracked), Colorado (91 percent), Connecticut (90 percent), Maryland (94 percent), Minnesota (87 percent), and Utah (89 percent). States with sparser eighth grade tracking and a below average proportion of high-scoring AP students include: Delaware (64 percent tracked), District of Columbia (63 percent), Louisiana (54 percent), Mississippi (52 percent), and Texas (57 percent).
The significantly positive correlations for black and Hispanic high performers on AP are important for equity considerations. Two sets of figures are presented. The adjusted correlations were calculated after dropping states with fewer than 50 AP participants. The number of black AP test takers fell below that criterion in eight states; for Hispanics, the shortfall occurred in four states. All states had at least 50 white AP tests takers, which is why adjusted figures for whites are not presented. States with small numbers of participants may produce unstable AP scores. AP has dramatically increased the participation of black and Hispanic students in the past decade—and continues to push for greater participation—so the adjusted figures are probably better indicators of future statistical relationships.
Let’s consider the pipeline hypothesis, the idea that eighth grade tracking offers high achieving students an opportunity for acceleration that can pay off in high school. The current study cannot test the causal claims of the hypothesis, but the findings do support further research on the topic. States with a larger percentage of kids scoring 3 or better on AP tests in 2013 had a larger percentage of kids in tracked classes four years earlier. That association occurs without any apparent increase in selectivity. The relationship of tracking with AP participation is indistinguishable from zero. Moreover, the finding holds for black, Hispanic, and white subgroups. If eighth grade tracking operates in a manner discriminatory to blacks and Hispanics, it is not apparent here. The sign of the correlation for Hispanic participation in AP tests is negative, however; and even though the value doesn’t reach statistical significance, it should be investigated further with more precise data and hierarchical models that can tease out state, district, and school effects.
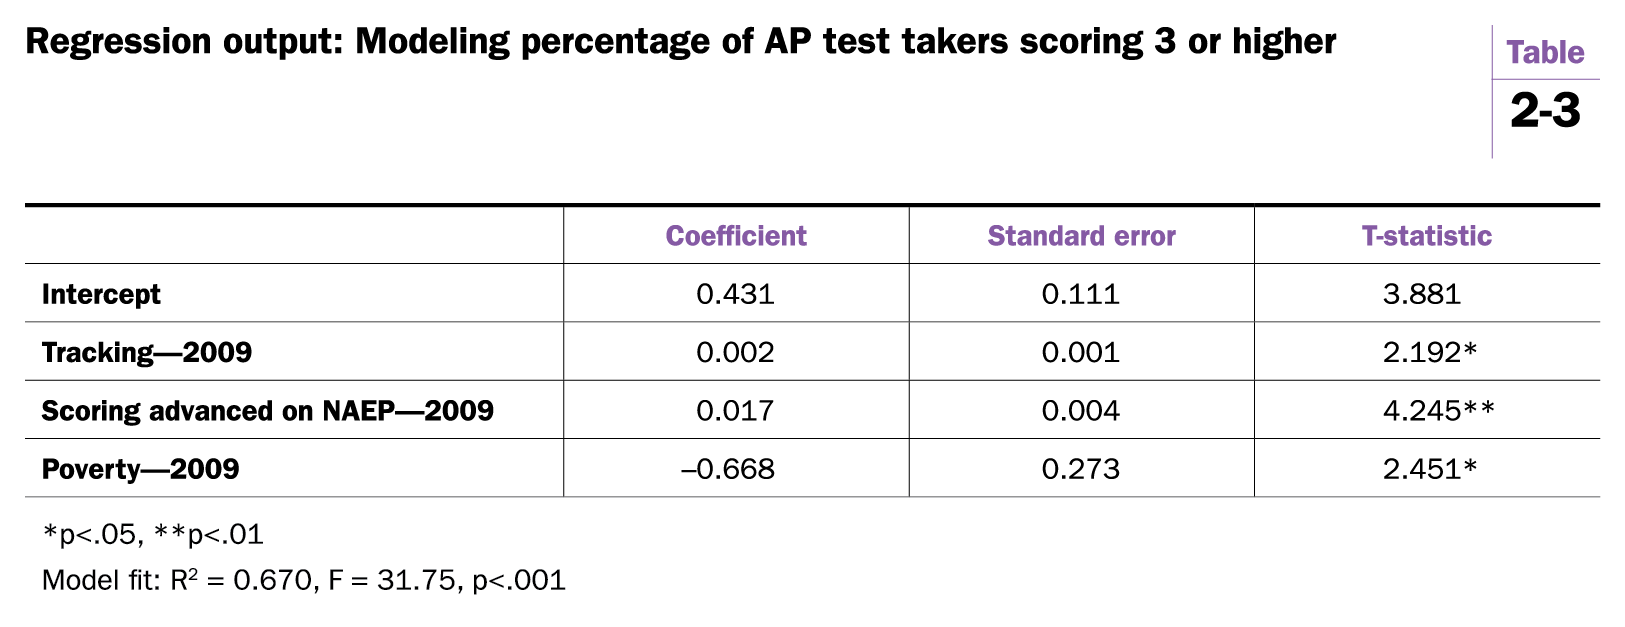
Regression analysis is useful for parsing out the influence that confounding variables may exercise in making two variables appear correlated when they in fact are not. Table 2-3 exhibits regression output controlling for two potential confounders. Tracking in eighth grade maintains a significantly positive relationship with later AP performance even while controlling for states’ advanced achievement on NAEP and level of child poverty.11As expected, both control variables are also statistically significantly associated with AP performance. Neither regression nor correlation coefficients are sufficient to determine causality.
To put the tracking coefficient in simpler terms, an increase of 10 percentage points in 8th grade tracking is associated with a two percentage point increase in high performing AP students. That effect is equivalent to about 0.18 standard deviations. The increase associated with boosting tracking by ten percentage points is over 1,300 additional high scoring AP students in New York and more than 2,000 in Texas. Nationally, a ten percentage point increase in eighth grade tracking is associated with an additional 20,000 students scoring 3 or higher on AP exams.
Conclusion
This section of the Brown Center Report examined the relationship of eighth grade tracking in 2009 with two AP outcomes in 2013: participation and high performance on AP tests. State level data were analyzed. No association was found between the percentage of a state’s students who were tracked in eighth grade mathematics and—four years later–the percentage of graduating seniors who had taken an AP test. A positive relationship was found between tracking and superior performance on AP tests, the percentage of test takers scoring a 3 or better on AP tests. The positive relationship was statistically significant for white, black, and Hispanic students.
The analysis cannot prove or disprove that tracking caused the heightened success on AP tests. The findings do support future research on the hypothesis that tracking benefits high achieving students—in particular, high achieving students of color—by offering accelerated coursework that they would not otherwise get in untracked schools. That hypothesis is supported by several recent studies, as described above, including that of David Card and Laura Giuliano (2014).
The hypothesis that middle school tracking is associated with AP outcomes rests on the notion of an academic pipeline—that superior academic performance must be nurtured and developed over time. Think of how the following three phenomena coalesce to shape opportunity. First, students are assigned to tracks primarily based on achievement test scores. Because of the test score gaps between white and Asian students, on the one hand, and black and Hispanic students, on the other hand, honors classes or tracks designed to accelerate students often are demographically unrepresentative of their schools. That fact has invited severe criticism. Second, in accordance with political opposition, schools in communities serving large numbers of black and Hispanic students tend to shun tracking. Accelerated classes are less likely to exist for students of color. Third, much of the research on tracking has found that students in high tracks benefit academically from separate, accelerated coursework. Researchers believe that high-track students receive a boost from exposure to academically-oriented peers, teachers trained in acceleration, and a challenging curriculum.
These three phenomena combine to limit opportunity for black and Hispanic youngsters. If tracking and accelerated coursework in eighth grade represent the beginning of a pipeline for promising young stars in mathematics or literature, that opportunity is more open to white and Asian students in suburban schools than to disadvantaged youngsters in schools serving students of color.
AP courses represent the end of the pipeline for academically gifted students. If we are serious about expanding opportunity, and serious about increasing the numbers of students of color who not only take AP courses but also score extraordinarily well on AP tests, policymakers need to take another look at strategies for nurturing academic talent in middle schools. Long condemned by political opponents, tracking has been overlooked as a potential tool for promoting equity.
Part III: Principals as instructional leaders: An international perspective »
Table of contents
-
Footnotes
- Tracking refers to how students are organized between classes. It is different from ability grouping, which involves grouping students into small groups within classes.
- Colleges have been criticized for being overly zealous in recruiting talent. The University of Washington and Louisiana State University have promised scholarships in exchange for signed letters of commitment from eighth grade football players. In 2010, David Sills, a 13 year old quarterback in Elkton, MD committed to attend USC when he was in seventh grade. Adam Himmelsbach and Pete Thamel, “Middle School Is Basketball’s Fiercest Recruiting Battleground,” The New York Times. (June 25, 2012).
- Samuel Bowles and Herbert Gintis, Schooling in Capitalist America (Basic Books, 1976); Jeannie Oakes, Keeping Track (Yale University Press, 1985); Diane Ravitch and Chester E. Finn, Jr., What Do Our 17-Year-Olds Know? (Harper & Row, 1987).
- National trends are presented in Loveless, T. (2013). “The Resurgence of Ability Grouping and Persistence of Tracking,” The 2013 Brown Center Report (Brookings Institution Press). pp. 12-20. For a study focusing on tracking and disadvantaged students, see Loveless, T. (in press). “Tracking in Middle School: A Surprising Ally in Pursuit of Equity?” in Education for Upward Mobility (Petrilli, Michael J., ed.). Lantham (MD): Rowman & Littlefield, 2016.
- Esther Duflo, Pascaline Dupas, and Michael Kremer, “Peer Effects, Teacher Incentives, and the Impact of Tracking: Evidence from a Randomized Evaluation in Kenya,” American Economic Review 101 (August 2011): pp. 1739-1774.
- Takako Nomi (2012). “The Unintended Consequences of an Algebra-for-All-Policy on High-Skill Students: Effects on Instructional Organization and Students’ Academic Outcomes,” Educational Evaluation and Policy Analysis
- David Card and Laura Giuliano (2014). “Does Gifted Education Work? For Which Students?” NBER Working Paper Series, Working Paper 20453 (September, 2014).
- At the time of the study, the 2013 graduating class was the most recent year for which a complete panel of state level AP data could be matched to NAEP data collected four years earlier.
- All NAEP data were collected from the NAEP Data Explorer. Tracking data based on responses from question #C072801 on the school questionnaire, “student assigned to math by ability.”
- College Board (2014). Tenth Annual AP Report to the Nation. AP race and ethnicity data retrieved from individual state reports in State Supplements, available at: http://apreport.collegeboard.org/. Child poverty rates collected from Kids Count Data Center (kidscount.org).
- A model using 2013 poverty data produced a slightly smaller t-statistic for poverty and slightly larger t-statistic for tracking.