ABSTRACT
Tax reform ideas played an important role in the recent Presidential election. Republican candidate Mitt Romney proposed large tax cuts and other changes that he said could be part of a revenue-neutral tax reform that also retained low rates on savings and investment and would not raise taxes on the middle class. In an earlier analysis, we showed that it was not possible to achieve all of Romney’s stated goals simultaneously. This paper reviews that analysis and critiques several responses to our analysis. Legislating realistic tax reform will require recognition of the difficult trade-offs among these competing goals.
I. Introduction
In February, 2012, Republican presidential candidate Mitt Romney laid out a four-part agenda for tax reform that featured cutting income tax rates by 20 percent from today’s levels, promoting “savings and investment for the American people,” repealing the estate tax, and repealing the alternative minimum tax.[1] He also proposed a variety of additional tax cuts, including a 29 percent reduction in the corporate tax rate. Taken together, the proposed tax cuts would reduce revenues by roughly $456 billion in 2015 or about $5 trillion over the next decade.[2] Governor Romney said that the changes would be part of a revenue-neutral reform that would offset the cost of the cuts by eliminating tax breaks and not raise taxes on the middle class, but he did not specify which tax breaks would be eliminated.
In August, the Tax Policy Center (TPC) published a paper we co-authored that analyzed these economic and policy goals.[3] As an illustration of the difficulty inherent in implementing such a substantial tax reform, our paper showed that achieving all of the goals listed above would, under reasonable assumptions about what tax breaks might be on the table, result in tax cuts for households with income above $200,000. Given the goal of revenue neutrality, this would seem to require tax increases on households with income below $200,000, something that Governor Romney has said he does not want to happen.
This conclusion was a mathematical demonstration of the difficulty of accomplishing simultaneously all of the goals Romney had laid out. It was neither a statement of Romney’s intentions nor a political prediction of what he would actually do if elected president. Indeed, Romney had also indicated that he did not want to cut taxes on high-income tax payers and that he wanted to reduce the burden for middle-income households.[4] Thus, our results demonstrated the more general conclusion that something would have to give: Romney’s proposals would fall short on at least one of the goals he had set out. Any practical reform based on his proposals would entail some combination of reduced revenues, tax increases on households with income below $200,000, higher taxes on saving and investment, smaller reductions in income tax rates, or other changes.
Our conclusions held even though we imposed the base-broadening measures in the most progressive manner possible, eliminating them for the highest-income households first before affecting anyone else. This was intended to place an upper bound on what the plan could achieve in terms of progressivity. Our analysis noted that, in reality, practical and administrative challenges of implementing the base-broadening reforms in this manner would mean that any realistic effort to close tax expenditures consistent with Romney’s goals would require higher effective tax rates and would yield even less progressivity, lower revenues, and more tax complexity than we had modeled. Furthermore, we excluded the effects of the corporate tax cuts, despite evidence that these provisions would also result in lower revenues.
Our results held even when we incorporated revenue feedback, not just according to the standard “microdynamic” effects used by TPC, Treasury, and the Joint Committee on Taxation, but also additional feedback effects from potential economic growth, based on estimates from a Romney adviser, even though we believe those estimates are overly optimistic.
In light of several responses to our work, some recent suggestions by Romney on how to finance part of his proposed tax cuts, and ongoing interest in tax reform, this paper reviews the discussion and to respond to various issues that have arisen in response to our paper.[5]
We offer several conclusions. First, we continue to stand by our original results. Although some media outlets and individuals have interpreted a second document that we published as somehow walking back or disavowing our earlier results, that is simply a misinterpretation on their part.[6]
Second, after reviewing several responses to our study, we note that even with the freedom to choose from a much larger set of “pay-fors,” not a single author has offered a plan that generates sufficient revenue to pay for all of Romney’s (non-corporate) tax cuts, exempts households with income below $200,000 from higher taxation, and is administratively feasible. None of the responses actually refutes our study – that is, none of them shows that our conclusions are wrong, given what Romney laid out as goals. Rather, the responses either shift the goal posts – by focusing on tax increases on different households or changing the baseline –
fail to raise sufficient revenue to offset all the tax cuts Romney has proposed; raise taxes on saving and investment, in violation of Romney’s goal of promoting these activities; or do a combination of these things.
Third, Romney subsequently described several ideas to help pay for some of his proposed tax cuts. This was a welcome update to the discussion, but the ideas (which Romney described but did not formally endorse) would not generate sufficient revenue to pay for the tax cuts.
Our paper proceeds as follows: Section II describes Romney’s proposals. Section III summarizes our earlier analysis. Section IV discusses and critiques the responses to our work. Section V discusses Romney’s recent ideas for paying for his proposals. Section VI concludes. An Appendix provides a detailed response to Rosen (2012).
II. Romney’s Proposals
In the Wall Street Journal on February 23, 2012, Romney published an op-ed laying out his economic plan, focused on four items:[7]
- Cutting income tax rates by 20 percent below their 2012 level,
- Promoting saving and investment (including eliminating taxes on capital gains, qualified dividends and interest incomes for households with income below $200,000; and retaining the current 15 percent top rates on capital gains and dividends for high-income households),
- Repealing the estate tax, and
- Repealing the alternative minimum tax.
He also proposed a series of other tax changes over the course of the campaign, including:
- Repealing the surtaxes on investment and earnings of upper-income taxpayers that were enacted in the Affordable Care Act,
- Extending all of the 2001/03 tax cuts,
- Allowing the 2009/10 tax cuts to expire, and
- Reducing the corporate tax rate to 25 percent from 35 percent.[8]
III. Our Analysis
The purpose of our analysis was to examine the trade-offs inherent in tax reform.[9] We drew on the Tax Policy Center microsimulation model, which was developed to provide revenue and distributional estimates of tax policies that had otherwise only been available from government sources, like the Joint Committee on Taxation (JCT) or the Department of the Treasury.
Much like the models used at these government agencies, the TPC model uses large samples of individual households from multiple data sources, projects the income and other tax-related variables of these households over the budget window, and estimates the taxes owed by each sample household under a specified proposal. The model includes estimates of the ‘microdynamic’ effects on revenues that occur when, for example taxpayers increase reported taxable income or capital gains in response to tax rate cuts, but not ‘macrodynamic’ effects of faster economic growth. (Our paper, however, discussed potential macrodynamic effects of the Romney proposal.)
While using a microsimulation model is more complex than using published tables from the IRS, estimates based on a large sample of individual income tax returns are capable of assessing the interaction of different tax provisions (for example, between changes to the AMT and to the regular income tax), and determining tax liability for households with different levels and sources of income, uses of funds, and family circumstances. This is the reason federal agencies and some private groups (including TPC and the National Bureau of Economic Research) use this type of model to estimate revenue and distributional effects of tax reform proposals. In short, by drawing on the TPC model, we can provide timely analysis of important policy-relevant issues using the basic methods of tax analysis used by the government agencies that provide the official scores of tax proposals.[10]
Regarding Romney’s proposals, TPC estimated in March that, in addition to extending the entirety of the Bush tax cuts, Romney’s explicit proposals would reduce revenues in 2015 by $481 billion on a static basis and by $456 billion after accounting for microdynamic behavioral responses.[11] (The commonly cited figure that Romney proposed $5 trillion in gross tax cuts, with unspecified revenue raisers, is based on the $456 billion estimate for 2015, adjusted for projected baseline growth in the size of the economy over the next decade.[12])
In our paper, we compared the Romney proposals to a current policy baseline and did not aim to finance the corporate tax cuts — we only included the tax cuts listed in the first five bullets above. With these parameters, we estimated that Romney’s proposed cuts would reduce revenues by $360 billion in 2015, after including microbehavioral responses.
A key consideration of our analysis was how such cuts would be financed. In the absence of any specific proposals from the Romney campaign, we looked to existing tax expenditures that could be closed in order to raise revenues. Similar to a previous TPC study, we divided tax preferences into several groups: (1) exclusions of income from sources that are administratively difficult to tax; (2) tax preferences for saving and investment; and (3) all other tax expenditures.[13]
Of these possible revenue-raisers, we excluded tax expenditures in the first group. These preferences–including imputed rent from owner-occupied housing, and other items–are typically excluded from tax reform proposals due to their administrative complexities (and sometimes for other reasons as well). We also excluded consideration of closing preferences aimed at saving and investment, because of the prominence of promoting saving and investment in Romney’s economic proposals. (We discuss this further in the next section.) We considered all other tax expenditures (including those related to itemized deductions for mortgage interest, charitable contributions, and state and local taxes; the exemption of employee income in the form of health insurance; various other exclusions, above the line-deductions, and tax credits) fair game to pay for the proposed tax cuts.
A key aspect of our analysis is that we closed the available tax expenditures “from the top down.” That is, we offset revenue losses from tax rate reductions by first eliminating tax expenditures for the highest-income groups. If that did not generate enough revenue to pay for the tax cuts, we then closed all available tax expenditures of the next highest-income group and so on. Although it would be both administratively and politically impractical as well as economically damaging (because of the high marginal tax spike it would create) to eliminate all tax expenditures only above a given income threshold, it made the financing of the tax proposals as progressive as could be, for those tax expenditures.
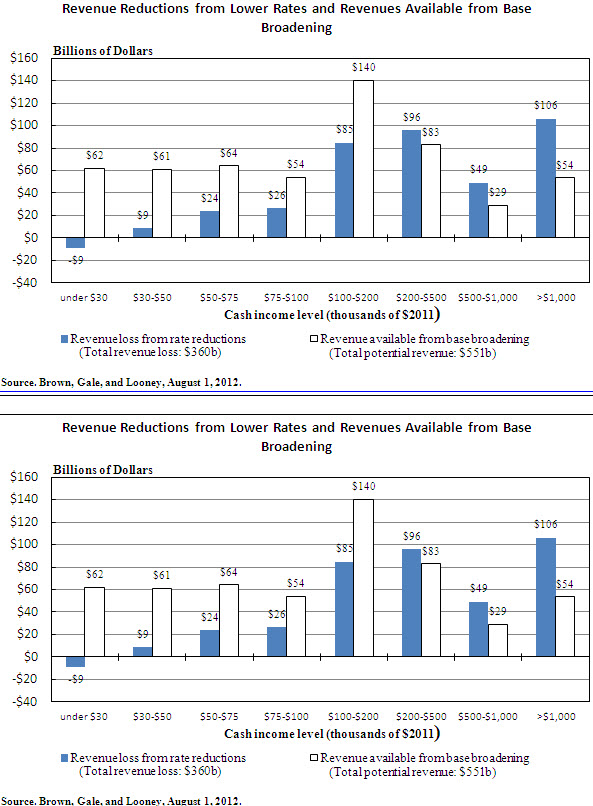
The central results are summarized in Figure 2 from our paper, reproduced below. Among households with income above $1,000,000, Romney’s tax cut proposals (again, ignoring the corporate tax) would reduce tax payments by $106 billion. However, even the complete elimination of all the available tax expenditures (i.e., excluding those administratively difficult to tax or those affecting saving and investment) would only raise $54 billion in revenue from this group. As a result, they would receive a net tax cut of $52 billion. Likewise, each group of households with income of $200,000 or above would receive a net tax cut under Romney’s proposals, even if all available tax expenditures were eliminated from the top down. In total, households with income above $200,000 would receive a net tax cut of $86 billion (consisting of a gross tax cut of $251 billion, partially offset by base-broadeners of $165 billion) even if all of their available tax expenditures were closed.
As a matter of arithmetic, in order for the overall tax package to be revenue neutral and preserve incentives for saving and investment, the $86 billion in lower taxes paid by those with income above $200,000 would require a $86 billion tax increase that would be spread out in some fashion over the 95 percent of the population with income below $200,000. This would require a 58 percent reduction in the value of tax expenditures that go to these households. We did not specify how this burden would be distributed among households with income below $200,000. We did note that if the increased burden were shared equally (as a percentage of income) among all households in this group, after-tax income would fall by an average of 1.2 percent. (The average tax increase would need to be about $500 per household, and about $2,000 for households with children.[14])
This conclusion is mathematical in nature – it is what the analysis shows would have to happen to meet Romney’s stated goals. It was not a prediction of Romney’s actions, were he elected, and Romney has said, before and since, that he does not want to raise taxes on the middle class. That implies an inherent mathematical contradiction between the goals of his proposals: one or more of those goals would have to be compromised.
Finally, we included an analysis of the potential revenue feedback effects from economic growth. We used a model that was developed by Romney advisor Greg Mankiw, and included a significant feedback effect that allowed 15 percent of the tax cut to be paid for through higher economic growth.[15] This implies that the $360 billion cost would fall to about $307 billion. It is not clear how to allocate the increase in income, and hence the added tax payments, across income groups, but it is highly likely that income gains from faster economic growth would increase revenues from both high- and low-income taxpayers. What is clear is that, under any allocation of the changes across income classes, households with income above $200,000 would still receive a large tax cut that would require tax increases on households with income below $200,000 in order to maintain revenue neutrality.
IV. Responses
Since the publication of our paper, several responses have been issued. None of the analyses contradict the results in our study – that is, none shows that our results do not hold, given the goals laid out by the candidate. Moreover, none of the authors of the responses argues that the alternatives they considered would be desirable economic policy. The authors are focused instead on attempting to generate the existence of a plan that could meet all of Romney’s goals. Even so, none of the responses offers a plan that generates sufficient revenue to pay for all of Romney’s (non-corporate) tax cuts, exempts households with income below $200,000 from higher taxation, and is administratively feasible.
We divide our discussion of the responses into three subsections. First, we discuss two overarching issues in the responses: raising taxes on the return to saving and the impact of the Romney proposals on economic growth. Second, we discuss three responses that build directly off of the TPC results. Third, we discuss three responses that use 2009 IRS data to examine the issues.[16]
A. Overarching Issues in the Responses
1. Taxing saving and investment
As noted above, Romney made promoting saving and investment one of his four main planks for pro-growth tax reform, on a par with the income tax cuts and repeal of the estate tax and AMT. In Believe in America: Mitt Romney’s Plan for Jobs and Economic Growth, the major heading for the tax policy section is “Mitt Romney’s Plan: Promote Savings and Investment.”[17]
The claim of promoting savings and investment is an imprecise policy goal and is therefore open to interpretation. It could mean to preserve every incentive for savings and investment or it could mean on net to preserve broad incentives while leaving open the possibility of eliminating more targeted incentives. In the Wall Street Journal op-ed, Romney wrote that “I will promote savings and investment by maintaining the low 15% rate on capital gains, interest [sic] and qualified dividends, and eliminate the tax entirely for those with annual income below $200,000. These low tax rates will create powerful incentives for Americans to save and invest, while encouraging business investment and economic growth.”[18] This does not rule out imposing new taxes on some forms of saving.
Nevertheless, we did not impose new taxes on saving in our calculations because his language and goals do not seem consistent with the idea of raising taxes on any specific types of saving. Specifically, we do not see how raising taxes on various forms of saving is consistent with the goal of promoting saving.
In contrast, all of the authors who have criticized us have suggested including revenue raised from subjecting some forms of saving and investment to higher taxes – either ending the exclusion of interest on state and local bonds, eliminating the tax deferral on long-term saving in life insurance products (often referred to as taxing the inside build-up); or changing the treatment of capital gains on assets that are transferred at death. Including new taxes on forms of saving as a way to pay for the Romney proposals seems to imply either that (a) the authors are ignoring Romney’s goal of promoting saving and investment, or (b) the authors believe that taxing a particular form of saving will not reduce saving and investment.
2. Effects of tax reform on economic growth
We included a discussion of how economic growth would affect our results and we showed that our central results do not change even after accounting for revenue feedback using growth effects taken from Mankiw and Weinzierl.[19]
However, we are skeptical that the growth effects of tax rate cuts – whether taken in isolation or as part of a revenue-neutral package – are as large as is sometimes claimed. While a full debate about taxes and economic growth is beyond the scope of this paper, it is worth noting that estimates that do incorporate macro adjustments by the Congressional Budget Office (CBO) and JCT show smaller effects than Mankiw and Weinzierl.[20] Recent papers by analysts at the Congressional Research Service also highlights a weak relation between lower tax rates and economic growth.[21]
Moreover, history has not been as kind to the verdict that tax cuts generate economic growth as substantial as the campaign’s rhetoric would suggest. For example, the massive and permanent tax increases associated with World War II do not appear to have had an impact on U.S. economic growth rates.[22] Likewise, the 1981 tax cuts, which cut the top rate from 70 percent to 50 percent, accounted for only a very small share of the growth of the economy between 1981 and 1986, according to Martin Feldstein, who advises the Romney campaign today and who was Chair of the Council of Economic Advisers under Reagan.[23] Feldstein and now-CBO director Douglas Elmendorf analyzed the 1981 tax cut and concluded that:
“Our evidence contradicts the popular view that the [early 1980s] recovery was the result of a consumer boom financed by reductions in the personal income tax. We also find no support for the proposition that the recovery reflected an increase in the supply of labor induced by the reduction in personal marginal income tax rates. … The driving force behind the recovery of nominal demand was the shift to an expansionary monetary policy. The rapid response in nominal GDP can be explained by monetary policy without any reference to changes in fiscal and tax policy.”[24]
The 1986 tax act is the most recent example of base-broadening, tax-rate reducing, revenue-neutral reform. In that act, the top personal income tax rate fell by 44 percent and the corporate rate fell by 26 percent. Auerbach and Slemrod document tepid economic growth responses to the 1986 tax act.[25]
Most recently, the 1993 hike of 8.6 percentage points in the top income tax rate did not stop a remarkably strong decade of economic expansion and budget balancing from occurring. The 2001 tax cuts had no appreciable impact on growth during the rest of the decade – through most of the decade (before the Great Recession) growth occurred mainly in housing and finance, two sectors that were not favored by the cuts. Gale and Potter estimate that the deficit-increasing effects of the 2001 tax cut, which reduced long-term economic growth, outweighed the marginal-tax-rate-cut effects, which increased growth, so that the net impact of the tax cut on long-term growth was negative.[26] It is difficult to translate this result, however, into an analysis of the effects of revenue-neutral reform without knowing how the base-broadeners needed to generate revenue-neutrality would affect incentives.
B. Discussion of Studies that build off of the TPC results
Three authors presented responses that start with the estimates we obtained, described above, and modify the results in different ways.
1. Jensen
Jensen suggested that eliminating the exclusion of interest on state and local bonds and the exclusion of inside-buildup on life insurance vehicles could raise “upwards of $90 billion” in 2015.[27] In response, we showed that an upper bound on the revenue obtained from eliminating these two exclusions is on the order of $49 billion ($29 billion for tax-exempt interest, $20 billion for life insurance), at least $4 billion of which would come from families with income under $200,000.[28] Jensen obtained a much higher estimate by including corporate changes and by confusing the tax expenditure estimates for these items with revenue estimates of repealing the provisions. In fact, because taxpayers respond to such changes, the tax expenditure estimates are significantly larger than the revenue implications of repeal.[29]
2. Dubay
Dubay argues that the $86 billion shortfall could be made up by a combination of taxing municipal bond income, taxing the inside build-up in life insurance vehicles, ending the step-up of basis on assets with capital gains that are transferred at death, and incorporating the effects of economic growth.[30]
The novel factor in this study relative to the others is the notion of ending basis step-up on capital gains transferred at death and replacing it with basis carry-forward. He uses the tax expenditure estimate from the fiscal year 2013 Federal Budget that suggests eliminating step up in basis would yield $19 billion.[31] However, Dubay overestimates the revenue that could be collected from this policy, for two reasons. First, the tax expenditure figure he cites comes from a comparison of basis step-up and full taxation of capital gains at death. Replacing basis step-up with basis carryover (under which the tax basis does not get changed, but taxes are not due at the transfer at death – they are due only if and when the asset is sold) would generate significantly less revenue.[32]
Second, the figure he cites is based on current-law projections of tax rates, which for long-term capital gains are more than 50 percent higher than they would be under Romney’s proposals (23.8 percent under current law compared to 15 percent under Romney’s proposals), thus inflating the tax expenditure estimates relative to what they would be under Romney’s proposals.
3. Brill
Brill argues that the $86 billion shortfall could be made up by a combination of taxing interest income from municipal bonds, taxing the inside buildup in life insurance, dropping Romney’s proposal to repeal health care reform from the baseline, and accounting for economic growth.[33] Relative to the other responses, the novel aspect of Brill’s response is his choice to omit health care taxes from the baseline. This raises several issues.
First, Brill suggests that Romney’s tax proposals should be evaluated relative to a baseline that excludes revenues from the ACA taxes—revenues which are highly progressive.
We believe that modifying the baseline to reduce overall revenue and progressivity amounts to moving up the goal line to make the goals artificially easier to achieve. Describing a policy as “revenue neutral” or suggesting that high-income households will pay the same share of taxes implies a commonly accepted baseline. (It’s not “revenue neutral except for those revenues.”) Our analysis draws on the same assumptions for the current policy baseline used by the Congressional Budget Office (whose “current policy” baseline is called the “alternative fiscal scenario”) and by other groups (e.g., Bowles-Simpson and Domenici-Rivlin). The ACA taxes are scheduled to begin on January 1, 2013. Those taxes will thus be in effect when the next president is inaugurated and are rightly considered not only part of “current law” (which takes the law as written) but also “current policy” (which attempts to reflect the trajectory of existing policies—including the likely extension of many expiring tax cuts—and is the baseline we used to analyze Romney’s proposals). Like them or not, the ACA taxes are now part of existing tax policy, and repealing them would be a tax cut—one that particularly benefits high-income taxpayers. More generally, selectively omitting certain disadvantageous features of the baseline to make a policy look better undermines the stated goals of revenue neutrality and the credibility of an analysis.
Second, Brill also suggests that the budget effect of repealing ACA taxes “should be analyzed in the context of the repeal of the various other health care provisions.” Romney wants to repeal the health care reform act (ACA), which is approximately revenue-neutral and very progressive.[34] ACA raises coverage for low- and middle-income households and raises taxes for higher-income households. Both individual elements are progressive. Repealing each provision would thus be unambiguously regressive. We are unable to include repeal of the coverage/spending changes in the tax model, which therefore leads us to understate the regressivity of Romney’s proposals in our model. Removing the revenue portions of Romney’s ACA-repeal proposal, as Brill would like to do, simply leads to a further understatement of the regressivity of Romney’s stated proposals.
From the perspective of households’ wallets, it is a matter of semantics whether ACA repeal is considered “tax policy” or “health policy.” (Similarly, whether curtailing the tax preference for health insurance is “tax reform” or “health reform” is a semantic issue not a substantive one.) What matters is that Romney proposed ACA repeal and doing so would be roughly revenue-neutral but would hurt middle- and low-income households and help high-income households. Hence, we believe that if there is a shortcoming of our analysis of Romney’s proposal to repeal ACA, it is not the inclusion of the revenue changes, but the inability (because we are using a tax model) to incorporate the spending/coverage changes. Had we been able to do so, our analysis would have shown it to be even more difficult to meet Romney’s stated goals.
Finally, for Brill’s plan (or Jensen’s or Dubay’s) to work, of course, one would have to eliminate all tax expenditures for people with income above $200,000 and this would require an enormous spike in the marginal tax rate at that income level. (We know this because Brill worked off of our analysis, and as noted above, our analysis was meant to provide an upper bound on the progressivity of the base broadeners, not an implementable version of tax reform. The same issue applies to Jensen’s and Dubay’s analysis.) That is, a household with income of $200,000 would receive all of its deductions, exclusions, exemptions, etc. But if the household members earned one more dollar, they would immediately lose all of their itemized deductions, their health insurance would be fully taxed, and so on. This would create a massive marginal tax rate at the $200,000 level. We believe it is fair to say that every sensible economist (and we include Brill in this category) would say that such a spike is a bad idea, is probably not administratively feasible, and would generate significant responses in terms of tax avoidance and labor supply. Fixing this problem to reduce the spike would inevitably either reduce revenues or raise middle-class tax burdens. Martin Feldstein has suggested that a phase-in of a cap on itemized deductions would cost about $15 billion.[35]
C. Responses to Feldstein and Rosen, which use 2009 Aggregate IRS data
Two responses by Feldstein and one by Rosen are based on 2009 aggregate IRS data.[36] These responses have several features in common. First, by using data from 2009, they understate the cost of tax cuts (relative to the revenue available from closing deductions), since the economy was so weak that year, and taxable income fell more than itemized deductions.[37] Second, neither author provides financing for estate tax repeal; Rosen does not even cover the costs of AMT repeal. As a result, their efforts at best only show that the policies they do consider could be financed, they do not show that the collection of Romney’s non-corporate tax cuts could be financed. In addition, both authors include substantial revenues from eliminating the standard deduction for individuals who have enough itemized deductions to itemize under current law, but not eliminating the standard deduction for individuals that do not have enough deductions to itemize under current law. This is a bizarre and unenforceable policy; any realistic implementation of a reduction in the standard deduction would either result in higher taxes on lower-income households (violating one goal of the proposal), or would require higher statutory tax rates on ordinary income (violating the stated 20 percent tax cut).
1. Feldstein
Feldstein first attempted to contradict our findings in an op-ed in the Wall Street Journal.[38] Instead, his analysis actually confirmed our central result. As we discuss in a response, under Feldstein’s suggested approach to financing Romney’s proposals, there would be significant tax increases on households with income between $100,000 and $200,000.[39] This is perfectly consistent with our initial conclusion, since (at the risk of stating the obvious) households with income between $100,000 and $200,000 fall in the category of “households with income under $200,000,” the group that we had indicated would have to face higher taxes if the Romney proposals were implemented and the group that Romney has said he considers to be part of the middle class.[40]
We also showed that Feldstein’s method of financing Romney’s proposals made a number of specific omissions and inappropriate assumptions (regarding the estate tax, the standard deduction, and the effective marginal tax rate) that implied that his plan would lose at least $90 billion per year and so wasn’t even close to revenue neutral.
In a response to our comments and that of others, Feldstein corrects a technical error regarding the effective marginal tax rate (which has the effect of reducing revenues), and so he adds new taxes on saving and investment to try (i.e., on the interest income from municipal bonds and inside build-up in life insurance policies) to offset this.[41] Because of the new taxes on saving and investment, his revised proposal imposes even larger tax increases on households with income between $100,000 and $200,000 than his original proposal. In addition, his revised proposal fails to provide a standard deduction for most high-income households and fails to specify financing of the estate tax repeal. Correcting for these factors implies that even his revised proposal is not revenue neutral, contradicting one of the other goals Romney laid out.
2. Rosen
Rosen examined similar issues and concluded that — under his version of what constituted Romney’s proposals — incorporating the effects of lower tax rates on economic growth, in combination with aggressive base broadening, could raise taxes on high-income households and hence avoid a middle- or lower-income tax increase in a revenue-neutral plan.[42] But Rosen overstates the case and adjusting for several factors turns his tax increase for high-income households into a tax cut (which would then have to be financed by households with income below $200,000) even if we grant his growth assumptions.
First, the biggest problem is simply that Rosen doesn’t finance all of the Romney proposed tax cuts; he finances only the 20 percent income tax rate reduction. He ignores estate tax repeal and AMT repeal, both of which would provide large tax cuts for high-income households.[43] Thus, although he claims that his analysis shows that taxes on high-income households would rise, he is omitting two major tax cuts that would primarily affect high-income households.
Second, he uses data from 2009, a year when the recession was in full swing and revenues were particularly low relative to itemized deductions (See the Appendix for documentation), thus overstating the revenue gain from eliminating itemized deductions relative to the revenue loss from cutting tax rates.
Third, the analysis assumes that high-income households who currently itemize would not benefit from the standard deduction. Ordinarily in the current system individuals whose itemized deductions fall below the value of the standard deduction simply choose to take the standard deduction. One interpretation is simply that Rosen (and Feldstein) have ignored this behavioral response, and that they have therefore incorrectly assumed too much additional tax revenues. A second interpretation is that this is a deliberate policy choice to eliminate the standard deduction, but only from former itemizers. However, this leads to a bizarre situation where people who would not have enough itemized deductions to itemize in the current system could take the standard deduction in Rosen’s system, but people who did have enough itemized deductions to itemize in the current system would receive neither the standard deduction nor itemized deductions in Rosen’s system. There is no precedent for such a policy, and it would be difficult to enforce if enacted. It is certainly possible to eliminate the standard deduction for all taxpayers, or to recover forgone revenue equal to the value of the standard deduction from higher-income taxpayers, but doing so would either result in a tax increase on low- and middle-income taxpayers, or would require higher statutory tax bracket rates, contravening the pledge to reduce those rates by 20 percent..
Fourth, he imposes new taxes on saving and investment (municipal bonds and inside build-up), which we would argue is not consistent with Romney’s stated objectives.
Adjusting for these factors (see the Appendix) — that is, estimating what we feel is an reasonable interpretation of Romney’s proposals and goals — takes what Rosen estimates as a $29 billion tax increase for households with income above $200,000 and turns it into a $41 billion tax cut for those same households, even if we grant the growth effects that Rosen assumes. Thus, high-income households would be receiving a tax cut, which would then have to be financed with higher taxes on other households or running a deficit or compromising some other element of Romney’s proposals.
Even if one allows the tax increases on saving to occur and even if one grants Rosen’s assumptions about economic growth, there would still be a net tax cut of $19 billion on households with income above $200,000, which would require tax increases on the rest of the population.
Also, for a number of reasons, we (and many other economists) believe that Rosen overstates the growth effects of Romney’s proposals. Adjusting that effect downward would further increase the size of the tax cut for households above $200,000 and thus imply even higher required tax increases on others. (See the Appendix for further discussion.)
V. Financing the tax cuts
Recently, Governor Romney mentioned some ways to finance at least some of the proposed tax cuts. He floated the idea of putting a cap on itemized deductions.[44] He suggested that possible levels of the cap could be $17,000, $25,000 or $50,000 and that the cap could phase out to zero at higher income levels.[45] An analysis by the Tax Policy Center shows that a $17,000 cap would raise $1.7 trillion over the next decade, a $25,000 cap would raise $1.3 trillion, and a $50,000 cap would raise $760 billion, if income tax rates were cut by 20 percent from current levels and the AMT were repealed.[46] Romney campaign staff also floated the idea of imposing a tax on health insurance or pulling back on personal exemptions but specifics do not appear to be available.[47]
Thinking about how to finance the tax cuts is a step in the right direction. However, capping itemized deductions falls far short of financing his proposed tax cuts. It is also interesting to note that, consistent with TPC’s assumptions, Romney did not propose new taxes on any form of saving.
VI. Conclusion
By now, there is overwhelming evidence and widespread understanding that Governor Romney overpromised on the tax side. Alan Viard, an economist at the American Enterprise noted in the New York Times that Romney is “going to need to cut rates significantly less than 20 percent if he wants to honor his other goals.”[48] Dan Shaviro, a lawyer and tax expert at New York University has said of the Romney proposals: “There really is no serious dispute that the parameters of their plan can’t be met… There’s just no way to make the numbers add up.”[49] Josh Barro – a Bloomberg columnist and former senior fellow at the Manhattan Institute – has said “There you have the six “studies” on which the Romney campaign has based its defense of Romney’s tax plan. Individually and collectively they fail the task.” [50] The Economist magazine writes that “The same calculations the Tax Policy Center made in August still hold” and that “[Romney’s] response is an acknowledgement that he can’t make his numbers add up.”[51] Martin Sullivan, an economist and journalist for Tax Notes said that “I like tax reform. I want to broaden the base. It’s something I’ve devoted my life to. And I welcome Governor Romney and the Republicans’ strong push, but the plan doesn’t work out. It’s not mathematically possible.”[52]
Tax reform is a difficult task, but not impossible. The parameters that Governor Romney offered are significantly different from previous tax reform proposals and efforts. For example, the Tax Reform Act of 1986 was able to reduce rates and remain revenue- and distributionally-neutral by taxing capital gains as ordinary income, eliminating many then-existing tax shelters for non-corporate investors, and increasing corporate taxes substantially. Similarly, the plan of the co-chairs of the National Commission on Fiscal Responsibility and Reform (Erskine Bowles and Alan Simpson) and the proposals submitted by Bipartisan Policy Center’s Debt Reduction Task Force (under the leadership of Pete Domenici and Alice Rivlin) helped to finance their proposed rate reductions by including among their base-broadening measures the taxation of capital gains and dividends as ordinary income.[53] But these are precisely the proposals that Romney has sworn off.
Romney is not the first politician to overpromise on the tax side and won’t be the last. As discussions about tax reform move from the campaign trail to (we hope) the halls of Congress, realistic recognition of the trade-offs would be a huge step in the right direction.
Appendix: Discussion of Rosen (2012)
(1) Use of 2009 data will understate the revenue losses from tax cuts, relative to the revenue gained from closing itemized deductions. Due to the Great Recession and other factors, 2009 was an unusual year in tax terms, with particularly low taxable income and low tax revenue. (If there is little revenue to begin with, cutting taxes doesn’t cost very much). For example, a key measure in thinking about Rosen’s (and Feldstein’s) analysis is the ratio of taxes paid to the size of itemized deductions (since he reduces tax rates and then eliminates itemized deductions). For different measures of itemized deductions employed (all, or just the ones that Rosen eliminates) and the income group used (over $100,000 or over $200,000), that ratio was about 15 percent higher in 2006, a normal tax and economic year that predates the Great Recession than it was in 2009.[54] The result is that Rosen’s analysis significantly understates the revenue lost from tax cuts and/or overstates the revenue gained from eliminating itemized deductions in a year that is more normal than 2009.
(2) Rosen understates revenue losses by ignoring the cost of repeal of the estate tax. The estate tax is the single most progressive tax in the entire federal system and because it raised $21 billion in 2009. JCT, CBO, and Treasury consistently estimate that repeal would not only lose revenue but could actually lose more revenue than the estate tax collects because it would create opportunities for tax avoidance.
(3) Rosen understates revenue losses by ignoring the repeal of the AMT. This cost is partly mitigated by the fact that Rosen only reduces the deductions for state and local taxes by half.
(4) Rosen’s analysis removes itemized deductions for high-income households, but does not offer those households the option to use the standard deduction. Normally, taxpayers have the choice of itemized or standard deductions, and the standard deduction is not considered a tax expenditure. Under the proposal examined by Rosen, taxpayers with income above $100,000 who had previously taken the standard deduction would continue to take the standard deduction, but taxpayers with income above $100,000 who had taken itemized deductions would be granted neither the itemized deduction or a standard deduction.
(5) Rosen raises revenue from taxing the return to saving – in particular, by taxing the interest income on municipal bonds and taxing inside build-up in life-insurance vehicles.
A Recalculation
What do these assumptions and features imply? It is beyond the scope of this short piece to fully estimate the various changes involved. But here are some rough calculations that suggest how the analysis would change, for some of the issues raised above.
Rosen argues that households with income above $200,000 would receive a $81 billion tax cut from Romney’s various tax cut proposals, that broadening the base would raise $95 billion in taxes from these households, and that supply responses would generate another $15 billion, for a total tax increase of $29 billion (-81+95+15).
- Including estate tax repeal would provide an additional tax cut of about $21 billion. Since about 94 percent of the elimination of the estate tax would benefit households in the top 5%, eliminating it would provide a tax cut of around $20 billion to those making more than $200,000.[55]
- Including AMT repeal would reduce revenues by $20 billion among those with income above $200,000. Eliminating the remaining state and local tax deductions that Rosen did not repeal would raise about $15 billion in the same income group, so the net reduction in revenue would be $5 billion.
- Allowing for a more normal revenue year would raise pre-tax-cut revenues by 15 percent relative to itemized deductions and thus raise the cost of tax cuts relative to itemized deductions by 15 percent. This would increase the revenue loss among high-income taxpayers by about $12 billion.
Thus, the tax cut for households with income above $200,000 would be more like $118 billion ( = 81 + 20 + 5 + 12)
- The tax cut for high-income households would be $10 billion larger if we allowed for standard deductions for households that lose itemized deductions (assuming a 24 percent effective rate under Romney’s proposals).
- Not eliminating the tax preferences on saving (municipal bonds and inside-build up on life insurance) would reduce revenue from base broadening by about $22 billion (assuming a 24 percent tax rate under Romney’s proposals — $14 billion for inside build up and $8 billion for municipal bonds).
As a result, the base broadening measures for households with income above $200,000 would raise about $63 billion ( = 95 – 22 – 10). This implies that the net tax cut for households with income above $200,000 would be $40 billion (118 – 63 – 15), even if we grant the growth effects that Rosen assumes.
Additional Issues
Several other issues are hard to quantify precisely but worth noting. First, Rosen overstates the revenue gain by ignoring the micro-behavioral responses to base-broadening. Rosen discusses and includes the effects of how taxpayers adjust their activities in response to lower tax rates (“micro behavioral” responses to tax rate cuts, which tend to reduce the revenue loss) but he neglects to include similar effects for how taxpayers respond to base-broadening measures. For example, he does not allow for the possibility that taxpayers with mortgages would likely choose to pay down their mortgages with taxable assets (and thus reduce taxable investment income) if the mortgage interest deduction were removed. Accurate scoring that includes such effects suggests that the revenue available from base-broadening is significantly smaller than Rosen’s static estimates (or base-broadening) would suggest. The tax cut for high-income households would rise further if one adjusted for individual taxpayer micro-behavioral responses to base- broadening (like reducing mortgage interest payments).[56]
Second, Rosen overstates the revenue gain by ignoring the macro-behavioral responses to base-broadening. If tax reform is truly going to be revenue-neutral and distributionally-neutral then effective marginal tax rates that take into account both the sources and uses of funds would not change very much if at all and certainly the reduction in marginal income tax rates alone — ignoring the base-broadening — would overstate the decline in effective marginal tax rates.[57] Brill and Viard (2011) provide further discussion of this point.
Third. Rosen does not incorporate the effects of the increase in the effective marginal tax rate that his proposal would create by eliminating itemized deductions and the exclusion of health insurance. If these tax expenditures were completely removed for all households, there would a large increase in low- and middle-class taxes even under Romney’s tax cut proposals. If the tax expenditure cuts are phased in as income rises (or introduced as a spike at $200,000), then they will increase effective marginal tax rates. Rosen’s analysis ignores these issues.
Finally, even ignoring the issues noted above, Rosen’s growth effects seem too large relative to the literature. He acknowledges that 3 percent growth (based on comparisons to current policy) is an educated guess, not the result of a rigorous proof. But 3 percent growth generates a 17.3 percent revenue feedback (24.9/143.9) for households with income above $100,000 and an 18.2 percent feedback for households with income above $200,000. Estimates by Mankiw and Weinzierl generate only a 15 percent feedback and that is in a model that cuts all capital and labor income taxes and where the response to capital income taxes is larger than labor income taxes.[58] In contrast, Governor Romney’s stated proposals do not cut capital gains and dividends tax rates for households above $200,000 (and these households receive a large share of aggregate capital gains and dividends). To be clear, we believe that JCT and CBO estimates support lower feedback mechanisms than Mankiw and Weinzierl. Our point is just that Rosen’s feedbacks are even higher than those presented by Mankiw and Weinzierl but the tax cuts proposed by Romney are less expansive, especially with respect to capital income, than the ones evaluated in Mankiw and Weinzierl.
References
Auerbach, Alan and Joel Slemrod. June 1997. “The Economic Effects of the Tax Reform Act of 1986.” Journal of Economic Literature, pp. 589-632.
Barro, Josh. October 12, 2012. “The Final Word on Mitt Romney’s Tax Plan.” Bloomberg. Available: http://www.bloomberg.com/news/2012-10-12/the-final-word-on-mitt-romney-s-tax-plan.html.
Barthold, Thomas A. October 11, 2012. Letter to Chairman Max Baucus and Senator Hatch on Repealing Tax Expenditures to Lower Statutory Rates. Joint Committee on Taxation. Available: http://democrats.waysandmeans.house.gov/sites/democrats.waysandmeans.house.gov/files/112-1671.pdf.
Brill, Alex. October 7, 2012. “The Romney Tax Plan: Not a Tax Hike on the Middle Class.” The American Enterprise Institute. Available: http://www.american.com/archive/2012/october/the-romney-tax-plan-not-a-tax-hike-on-the-middle-class/.
Brill, Alex M. and Alan D. Viard. September 2011. “The Benefits and Limitations of Income Tax Reform.” American Enterprise Institute, Available: http://www.aei.org/files/2011/09/27/TPO-Sept-2011.pdf.
Brown, Samuel, William G. Gale, and Adam Looney. August 1, 2012. “On the Distributional Effects of Base Broadening Income Tax Reform.” Tax Policy Center. Available: http://www.taxpolicycenter.org/publications/url.cfm?ID=1001628.
Brown, Samuel, William G. Gale, and Adam Looney. August 16, 2012. “Implications of Governor Romney’s Tax Proposals: FAQs and Responses.” Tax Policy Center. Available: http://www.taxpolicycenter.org/publications/url.cfm?ID=1001631.
Brown, Samuel, William G. Gale, and Adam Looney. August 30, 2012. “Feldstein’s Analysis Doesn’t Refute TPC Findings, It Confirms Them.” Tax Policy Center. Available: http://taxvox.taxpolicycenter.org/2012/08/30/feldsteins-analysis-doesnt-refute-tpc-findings-it-confirms-them/.
CBO. July 2003. “How CBO Analyzed the Macroeconomic Effects of the President’s Budget.” Congressional Budget Office. Available: http://www.cbo.gov/sites/default/files/cbofiles/ftpdocs/44xx/doc4454/07-28-presidentsbudget.pdf.
CBO. December 1, 2005. “Analyzing the Economic and Budgetary Effects of a 10 Percent Cut in Income Tax Rates.” Congressional Budget Office. Available: http://www.cbo.gov/sites/default/files/cbofiles/ftpdocs/69xx/doc6908/12-01-10percenttaxcut.pdf.
CNN Political Unit. October 4, 2012. “Transcript of Wednesday’s Presidential Debate.” CNN. Available: http://www.cnn.com/2012/10/03/politics/debate-transcript/index.html.
Debt Reduction Task Force. November 2010. “Restoring America’s Future.” Available: http://bipartisanpolicy.org/sites/default/files/BPC%20FINAL%20REPORT%20FOR%20PRINTER%2002%2028%2011.pdf.
Democracy in America. October 11, 2012. “Mitt Romney on Taxes: Fudging the Numbers.” Economist.com. Available: http://www.economist.com/blogs/democracyinamerica/2012/10/mitt-romney-taxes.
Diamond, John W. August 3, 2012. “The Economic Effects of the Romney Tax Plan.” James A. Baker Institute for Public Policy, Rice University. Available: http://www.bakerinstitute.org/publications/Diamond-RomneyTaxReformPlan-080312.pdf.
Dubay, Curtis S. September 25, 2012. “Tax Policy Center’s Skewed Analysis of Governor Romney’s Tax Plan.” The Heritage Foundation. Available: http://www.heritage.org/research/reports/2012/09/tax-policy-centers-skewed-analysis-of-governor-romneys-tax-plan.
Entin, Stephen and William McBride. October 3, 2012. “Simulating the Economic Effects of Romney’s Tax Plan.” Fiscal Fact No. 330. The Tax Foundation. Available: http://taxfoundation.org/article/simulating-economic-effects-romneys-tax-plan.
Feldstein, Martin. May 1986. “Supply Side Economics: Old Truths and New Claims.” American Economic Review: 76(2), pp.26-30.
Feldstein, Martin. August 28, 2012. “Martin Feldstein: Romney’s Tax Plan Can Raise Revenue.” Wall Street Journal. Available: http://www.nber.org/feldstein/wsj08282012.html.
Feldstein, Martin. September 2, 2012. “A Reply from Martin Feldstein.” Greg Mankiw’s Blog: Random Observations for Students of Economics. Available: http://gregmankiw.blogspot.com/2012/09/a-reply-from-martin-feldstein.html.
Feldstein, Martin and Douglas Elmendorf. 1989. “Budget Deficits, Tax Incentives and Inflation: A Surprising Lesson from the 1983-84 Recovery.” in Tax Policy and the Economy, vol. 3, (ed.) Larry Summers, pp 1-24, MIT Press.
Gabriel, Trip and Helene Cooper. October 9, 2012. “Romney Refines Message on Taxes and Abortion.” The New York Times. Available: http://www.nytimes.com/2012/10/10/us/politics/romney-pledges-to-keep-tax-deductions-for-mortgages.html.
Gale, William G. and Samara Potter. March 2002. “An Economic Evaluation of the Economic Growth and Tax Relief Reconciliation Act.” National Tax Journal, 55(1), pp. 133-186.
Gravelle, Jane G. and Donald J. Marples. December 5, 2011. “Tax Rates and Economic Growth.” CRS Report for Congress. Congressional Research Service. R42111.
Greenberg, Jon. October 11, 2012. “Ryan Says Six Studies Say the Math Works in Romney Tax Plan.” Politifact. Available: http://www.politifact.com/truth-o-meter/statements/2012/oct/15/paul-ryan/ryan-says-six-studies-say-math-works-romney-tax-pl/.
Hungerford, Thomas L. September 14, 2012. “Taxes and the Economy: An Economic Analysis of the Top Tax Rates Since 1945.” Congressional Research Service. Available: http://www.fas.org/sgp/crs/misc/R42729.pdf
IRS. August 10, 2012. “SOI Tax Stats – Individual Statistical Tables by Size of Adjusted Gross Income.” Internal Revenue Service. Available: http://www.irs.gov/uac/SOI-Tax-Stats—Individual-Statistical-Tables-by-Size-of-Adjusted-Gross-Income.
JCT. March 1, 2005. “Macroeconomic Analysis of Various Proposals to Provide $500 billion in Tax Relief.” Joint Committee on Taxation. Available: https://www.jct.gov/publications.html?func=startdown&id=1189.
Jensen, Matt. August 9, 2012. “How the Tax Policy Center Could Improve Its Romney Tax Plan Study.” The American Enterprise Institute. Available: http://www.aei-ideas.org/2012/08/how-the-tax-policy-center-could-improve-their-romney-tax-study/.
Khimm, Suzy. October 16, 2012. “The Truth about Romney’s ‘Six Studies.’” Washington Post. Available: http://www.washingtonpost.com/blogs/ezra-klein/wp/2012/10/16/the-truth-about-romneys-six-studies/.
Krieg, Gregory J. October 2, 2012. “Romney Suggests Tax Break for Most, Possibly $17,000.” ABCNews. Available: http://abcnews.go.com/Politics/OTUS/romney-suggests-uniform-tax-break-possibly-17000/story?id=17374494.
Lowrey, Annie. October 24, 2012. “Tax Policy Center in Spotlight for Its Romney Study.” The New York Times. Available: http://www.nytimes.com/2012/10/25/business/tax-policy-center-in-spotlight-for-its-white-paper.html.
Lowrey, Annie and David Kocieniewski. September 9, 2012. “Romney’s Tax Plan Leaves Key Variables Blank.” The New York Times. Available: http://www.nytimes.com/2012/09/10/us/politics/romneys-tax-plan-leaves-key-variables-blank.html.
Mankiw, N. Gregory and Matthew Weinzierl. September 2006. “Dynamic Scoring: A Back-of-the-Envelope Guide.” Journal of Public Economics: 90(8-9), pp. 1415-1433. Also available: http://scholar.harvard.edu/mankiw/files/dynamicscoring_05-1212.pdf.
Marron, Donald. August 8, 2012a. “Understanding TPC’s Analysis of Governor Romney’s Tax Plan.” Tax Policy Center. Available: http://taxvox.taxpolicycenter.org/2012/08/08/understanding-tpcs-analysis-of-governor-romneys-tax-plan/.
Marron, Donald. October 12, 2012b. “Five Things You Should Know about Mitt Romney’s “$5 Trillion Tax Cut.” Tax Policy Center. Available: http://taxvox.taxpolicycenter.org/2012/10/12/five-things-you-should-know-about-mitt-romneys-5-trillion-tax-cut/.
Matthews, Dylan. September 27, 2012. “Wonkblog’s Comprehensive Guide to the Debate over Romney’s Tax Plan.” Washington Post. Available: http://www.washingtonpost.com/blogs/ezra-klein/wp/2012/09/27/wonkblogs-comprehensive-guide-to-the-debate-over-romneys-tax-plan/.
National Commission on Fiscal Responsibility and Reform. December 2010. “The Moment of Truth.” Available: http://momentoftruthproject.org/report.
Nguyen, Hang, Jim Nunns, Eric Toder, and Roberton Williams. July 10, 2012. “How Hard Is It to Cut Tax Preferences to Pay for Lower Tax Rates.” Tax Policy Center. Available: http://www.taxpolicycenter.org/publications/url.cfm?ID=412608.
OMB. 2012. “17. Tax Expenditures” in Analytical Perspectives: Fiscal 2013, Budget of the U.S. Government. Office of Management and Budget. Available: http://www.whitehouse.gov/sites/default/files/omb/budget/fy2013/assets/receipts.pdf.
Poterba, James M. and Todd M. Sinai. 2008. “Income Tax Provisions Affecting Owner-Occupied Housing: Revenue Costs and Incentive Effects.” NBER, Working Paper 14253.
Romney, Mitt. 2011. Believe in America: Mitt Romney’s Plan for Jobs and Economic Growth. Available: http://www.mittromney.com/sites/default/files/shared/BelieveInAmerica-PlanForJobsAndEconomicGrowth-Full.pdf.
Romney, Mitt. February 22, 2012. “Restore America’s Promise: More Jobs, Less Debt, Smaller Government.” Romney for President, Inc. Available: http://www.mittromney.com/blogs/mitts-view/2012/02/restore-americas-promise-more-jobs-less-debt-smaller-government.
Romney, Mitt. February 23, 2012. “A Tax Reform to Restore America’s Prosperity.” Wall Street Journal. Available: http://online.wsj.com/article/SB10001424052970203960804577239672484987172.html.
Rosen, Harvey S. September 2012. “Growth, Distribution, and Tax Reform: Thoughts on the Romney Proposal.” Griswold Center for Economic Policy Studies, Working Paper No. 228. Available: https://www.princeton.edu/ceps/workingpapers/228rosen.pdf.
Rubin, Richard. October 4, 2012. “Romney $17,000 Deduction Limit Part of Three-Cap Concept.” Bloomberg. Available: http://www.bloomberg.com/news/2012-10-03/romney-17-000-deduction-cap-first-of-three-part-proposal.html.
Rubin, Richard and Heidi Przybyla. October 13, 2012. “Repealing Deductions Pays for 4% Tax Cuts, Study Says.” Bloomberg BusinessWeek. Available: http://www.businessweek.com/news/2012-10-12/repealing-deductions-pays-for-4-percent-tax-cuts-study-says.
Sammartino, Frank. April 25, 2012. “Testimony: Federal Support for State and Local Governments Through the Tax Code.” Congressional Budget Office. Available: http://www.cbo.gov/sites/default/files/cbofiles/attachments/04-25-TaxCodeTestimony.pdf.
Situation Room with Wolf Blitzer. October 9, 2012. “Romney on Taxes: I want High Income People to Continue to Pay the Same Share They Do Today.” CNN. Available: http://cnnpressroom.blogs.cnn.com/2012/10/09/romney-gets-specific-on-tax-plan/.
Stephanopoulos, George. September 14, 2012. “Full Transcript: George Stephanopoulos and Mitt Romney.” ABCNews. Available: http://abcnews.go.com/blogs/politics/2012/09/full-transcript-george-stephanopoulos-and-mitt-romney/.
Stokey, Nancy L. and Sergio Rebelo. June 1995. “Growth Effects of Flat Rate Taxes.” Journal of Political Economy: 103(3), pp. 519-550.
Tax Policy Center. March 1, 2012. “The Romney Plan (Updated).” Tax Policy Center. Available: http://www.taxpolicycenter.org/taxtopics/Romney-plan.cfm.
Tax Policy Center. September 13, 2012. “T12-0204: Share of Federal Taxes – All Units, By Cash Income Percentile, 2012.” Tax Policy Center. Available: http://www.taxpolicycenter.org/numbers/displayatab.cfm?DocID=3509.
Tax Policy Center. October 17, 2012. “Table T12-0273: Options to Repeal or Limit Itemized Deductions, Impact on Tax Revenue (billions of current dollars), 2013-2022.” Tax Policy Center. Available: http://taxpolicycenter.org/numbers/displayatab.cfm?Docid=3590&DocTypeID=5.
Footnotes
[1] Romney (2012a) and Romney (2012b).
[2] The $5 trillion figure is not a formal estimate. For a discussion of its derivation, see Marron (2012b).
[3] Brown, Gale, and Looney (2012a).
[4] Romney (2012b), Situation Room with Wolf Blitzer (2012), and CNN Political Unit (2012).
[5] For other reviews of the various critiques and issues see: Barro (2012), Greenberg (2012), Khimm (2012), and Matthews (2012).
[6] Our second paper is Brown, Gale, and Looney (2012b). For one example of the incorrect claim that we ”downgraded” our estimate, see Brill (2012). Brill and others appear to have confused our providing an estimate of two policies that they advocated (taxing municipal bond interest and taxing inside build-up in life insurance plans) with our endorsing those policies as consistent with Romney’s stated goals.
[7] Romney (2012b).
[8] Tax Policy Center (2012a).
[9] For related discussion, see Marron (2012a) and Nguyen et al. (2012).
[10] A detailed description of TPC’s microsimulation model is available at http://taxpolicycenter.org/taxtopics/TPC-Model-Overview-2012.cfm.
[11] Tax Policy Center (2012a).
[12] Marron (2012b).
[13] Nguyen et al. (2012).
[14] We are using the more familiar term “household,” instead of the technically accurate “tax unit.” A tax unit is an individual who files a tax return, or a married couple who file a tax return jointly, along with all dependents of that individual or married couple. A tax unit is technically different than a family or a household in certain situations: two persons cohabiting would be considered one household but if they were not legally married, they would file separate tax returns and thus be considered two tax units.
[15] Mankiw and Weinzierl (2006).
[16] Although there is no Romney tax plan, only a set of proposals for tax cuts coupled with unspecified base-broadening, some authors have nevertheless attempted to estimate the effects of what they see as a plan. Diamond (2012) estimates that “the Romney tax plan” would have favorable economic effects. He assumes that the tax cuts are paid for on a static basis, but he does not specify how the base-broadening occurs. Entin and McBride (2012) also estimate favorable economic effects of “Romney’s tax plan” but they do not specify offsets at all and they include revenue feedbacks that are about four times as large as those in Mankiw and Weinzierl (2006).
[17] Romney (2011), page 40.
[18] Romney (2012b).
[19] Mankiw and Weinzierl (2006).
[20] CBO (2003), CBO (2005), and JCT (2005).
[21] Hungerford (2012), Gravelle and Marples (2011).
[22] Stokey and Rebelo (1995).
[23] Feldstein (1986).
[24] Feldstein and Elmendorf (1989).
[25] Auerbach and Slemrod (1997).
[26] Gale and Potter (2002).
[27] Jensen (2012).
[28] Brown, Gale, and Looney (2012b).
[29] It is also worth noting that the estimates above refer to removing the tax exemption on all state and local bonds and taxing the inside build-up on all existing life insurance contracts. Changing the tax treatment only of new bond issues or new insurance contracts would raise far less revenue. Barthold (2012).
[30] Dubay (2012).
[31] OMB (2012).
[32] OMB (2012), page 273.
[33] Brill (2012).
[34] Romney (2011), page 59.
[35] Feldstein (2012b).
[36] IRS (2012).
[37] In 2009, itemized deductions for tax filers making more than $200,000 AGI were 6 percent lower than 2006, a normal economic and tax year. Taxable income for these filers, however, was almost 25 percent lower.
[38] Feldstein (2012a).
[39] Brown, Gale, and Looney (2012c). The income measures that we and Feldstein use differ somewhat. Feldstein uses adjusted gross income, whereas we use cash income, a more comprehensive measure (for a description of the cash income measure, see http://www.taxpolicycenter.org/numbers/displayatab.cfm?DocID=574). In 2009, 2.8 percent of households had AGI above $200,000 (in 2009 dollars), compared to 5.2 percent with cash income above $200,000 (in 2011 dollars) for our estimates for 2015.
[40] Stephanopolous (2012).
[41] Feldstein (2012b).
[42] Rosen (2012).
[43] Rosen also ignores the capital income tax cuts for households with income below $200,000. Since we focus on his results for households above $200,000, we do not address that issue here.
[44] Krieg (2012).
[45] Gabriel and Cooper (2012).
[46] Tax Policy Center (2012c).
[47] Rubin (2012).
[48] Lowrey and Kocieniewski (2012).
[49] Rubin and Przybyla (2012).
[50] Barro (2012).
[51] Democracy in America. (2012).
[52] Quoted in Lowrey (2012).
[53] National Commission on Fiscal Responsibility and Reform (2010) and Debt Reduction Task Force (2010).
[54] For taxable returns with AGI greater than $200,000, the ratio of income tax before credits to itemized deductions was 1.73 in 2006. By 2009, the ratio had decreased to 1.50. SOI (2012).
[55] Tax Policy Center (2012b).
[56] For example, see Poterba and Sinai (2008).
[57] For example, someone who faces a 35 percent statutory tax rate but exempts 20 percent of their income from tax using itemized deductions and other tax preferences actually faces an effective marginal tax rate of 28 percent (80 percent of 35 percent). If the statutory rate were reduced to 28 percent and the itemized deductions and other tax preferences were removed, the taxpayer would continue to face an effective marginal tax rate of 28 percent, so no change would be expected in their labor supply from the “20 percent marginal tax rate cut.”
[58] Mankiw and Weinzierl (2006).
Related Content


Related Books


Authors