The following is the second section of “Political polarization and congressional candidates in the 2018 primaries,” a report from The Primaries Project at Brookings.
When it comes to basic demographic information on the candidates, we are hampered by the fact that the candidates don’t always include much biographical information on their websites. For instance, 30 percent of those running provided no information on their educational backgrounds. But it is not surprising that, as in 2016, most candidates who provided educational information had either a college degree or a post graduate degree, mostly law degrees. In addition, the vast majority of candidates who list their marital status are married, but many candidates make no reference to their marital status. (See the Appendix for more details.)
As for military service, 19 percent of those who ran had served in the military. However, similar to our findings from the previous two election cycles, veterans are more likely to run as Republicans. Despite the attention drawn this cycle to Democratic veterans running for Congress, one-in-four Republicans noted their military service while fewer than 15 percent of all Democrats running listed military service on their website.
Table 3: Primary candidate veteran status by party, 2018
| Discusses military service | No military service listed | |
| Democrats |
164 (14%) |
1008 (86%) |
| Republicans |
253 (24.6%) |
775 (75.4%) |
But one demographic variable stands out in the 2018 cycle. The cycle has made history for the large surge of women running in congressional primaries. As Figure 3 indicates, the overall number of women increased from the two previous cycles, with the most dramatic upsurge occurring in the number of women running in the Democratic Party.
Not only did many more women run in 2018 than in previous years, many of these women won their races. As Table 4 indicates, women non-incumbents won their primaries much more often than men non-incumbents. This is even more remarkable given that in some races there were multiple women running in primaries.
Table 4: Primary win/loss rates for House non-incumbents by gender, 2018
| Win | Lose | |
| Female candidates |
164 (39.9%) |
247 (60.1%) |
| Male candidates |
294 (24.0%) |
932 (76.0%) |
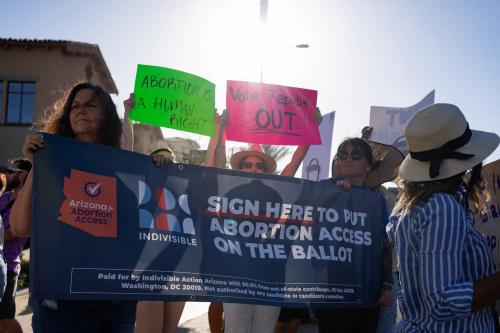
Win/loss rates aren’t the only difference between the female and male candidates. Since 2014, we have coded congressional candidate websites to learn more about the issues they are discussing on the campaign trail. The following table identifies the top five issues congressional candidates discussed in the 2018 primary elections. While male and female candidates are largely positioning themselves on the same political issues, differences occur in the frequency that they discuss certain issues. For instance, male candidates appear to talk about tax policy more often than female candidates. Female candidates, however, are more likely to campaign on PreK-12 education policy and abortion views. This difference is largely related to the fact that a heavy majority of female candidates are running in Democratic primaries, while slightly more than half of the male candidates are running in GOP primaries. Nevertheless, these are all issues that have salience across the partisan divide.
Table 5: Top issues mentioned by male and female major-party House candidates, 2018 primaries
| Female candidates | Male candidates |
|
Health care/Affordable Care Act (75.8%) |
Health care/Affordable Care Act (69.3%) |
|
Immigration (64.9%) |
Immigration (62.3%) |
|
Gun control/Second Amendment (63.8%) |
Federal tax policy (61.1%) |
|
Abortion (62.6%) |
Gun control/Second Amendment (59.6%) |
|
Federal education PreK-12 (62.3%) |
Abortion (51.8%) |
We also found that male and female primary candidates this cycle mentioned a number of other issues at different rates. In the chart below, we display candidate mentions of the issues that we coded in this election cycle, separated by gender. It’s clear that the women candidates are focused on domestic issues, while the men are focused on international and business issues. Writing over a decade ago, political scientists Jennifer L. Lawless and Richard L. Fox found that Democratic “policy preferences and priorities consistent with the Democratic party may shed light on why the majority of women officeholders are Democrats.”1 In this regard, little seems to have changed. Women candidates so far are mostly Democrats and their policy concerns are the policy concerns of Democrats and not Republicans. Hence, if more women are elected this November, it could mean some changes in the congressional agenda.
Continue to the next section, “What are the internal divisions within each party?“
Authors


-
Footnotes
- See: https://www.brookings.edu/blog/fixgov/2018/06/01/the-pink-wave-makes-herstory-women-candidates-in-the-2018-midterm-elections/.