
This paper shows how the rapid growth of Hispanic and Asian origin groups and new internal shifts of African Americans are transforming the racial and ethnic demographic profiles of America’s largest metropolitan areas ahead of other parts of the country.
William Frey: Growing Hispanic populations are driving demographic shifts in major American cities, and changes in Asian and African-American populations mean greater diversity among young people – creating a cultural generation gap.
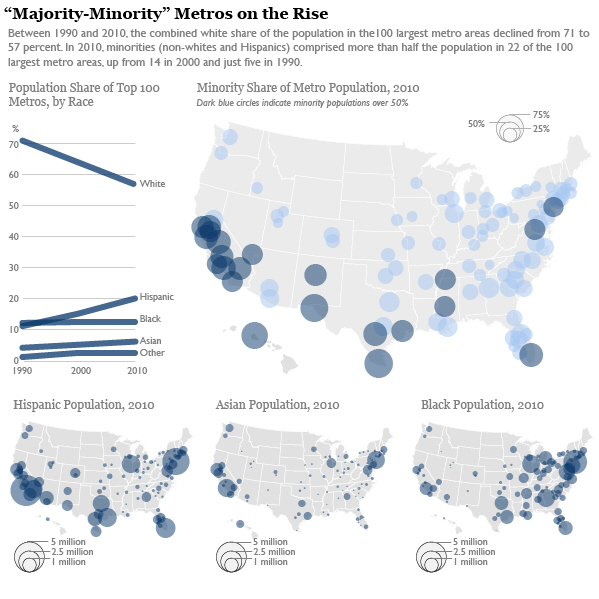
This analysis of 1990, 2000, and 2010 decennial census data for the 100 largest U.S. metropolitan areas indicates that:
- Non-whites and Hispanics accounted for 98 percent of population growth in large metro areas from 2000 to 2010. Forty-two of the 100 largest metro areas lost white population, and 22 now have “majority minority” populations. Smaller metro areas and areas outside of metropolitan regions, by contrast, remain overwhelmingly white.
- Nearly half of Hispanics live in just 10 large metro areas, but those metro areas accounted for only 36 percent of Hispanic growth over the past decade. Meanwhile, 29 of the 100 largest metro areas more than doubled their Hispanic populations; in two-thirds of these, Mexican Americans contributed most to Hispanic growth.
- Asians are even more concentrated than Hispanics, with one-third living in just three metro areas: Los Angeles, New York, and San Francisco. While Chinese Americans remain the largest origin group among Asians, Asian Indians are dispersing more rapidly and accounted for more growth than other Asian groups in 63 of the 100 largest metro areas.
- Three-quarters of black population gains from 2000 to 2010 occurred in the South. Atlanta, Dallas, and Houston led all metropolitan areas in black population gains at the same time that black population dropped in metropolitan New York, Chicago, and Detroit for the first time.
- Average neighborhood segregation levels held steady for Hispanics and Asians but declined for blacks from 2000 to 2010. Older and northern metropolitan areas continue to register the highest segregation levels for minority groups. Despite recent declines, blacks remain more residentially segregated than either Hispanics or Asians.