

The Hutchins Center on Fiscal and Monetary Policy’s Fiscal Impact Measure (FIM) is a gauge of the contribution of federal, state, and local fiscal policy to near-term changes in the gross domestic product, the tally of all the goods and services produced in the economy. It includes both the direct effects of government purchases as well as the more indirect effects of government taxes and government transfers. When FIM is positive, the government is contributing to real GDP growth, and when it is negative, it is subtracting from it.
The Fiscal Impact Measure is similar to the Fiscal Impetus measure created by the staff of the Federal Reserve Board (see Follette, Kusko, and Lutz, 2008). The Fed’s measure is limited to the effects of government policy changes on GDP, whereas the Hutchins Center’s measure captures all the channels through which the federal government affects near-term GDP growth. In addition to policy changes, the FIM captures the effects on the economy of trend growth in spending and the automatic stabilizers.
Trend Growth in Spending: When Medicare or Medicaid spending increases because health costs increase, this does not entail any legislative changes, but does represent a larger infusion of government spending into the economy.
Automatic stabilizers: These are changes in government taxes and spending that happen automatically when economic conditions change. When economic growth slows, spending on unemployment benefits and Medicaid increase because more people are eligible. Similarly, a slowdown in GDP leads to a reduction in tax rates that help to boost personal consumption spending.
The Hutchins Center FIM doesn’t include any government spending multipliers. It measures the first order effects of government policy on GDP, but not any second round effects whereby higher GDP in one year stimulates hiring which then boosts GDP further in later years. Nor does it include potential offsets from monetary policy. For example, a surge in government spending when unemployment rates are low could induce the Federal Reserve to raise interest rates, a response that might undo the effects captured by the FIM.
Interpreting the Hutchins Center FIM
As noted above, when FIM is positive, the government is contributing to real GDP growth, and when it is negative, it is subtracting from it. But government purchases account for about 20 percent of GDP, so, on average, we would expect FIM to be positive. We calculate a “neutral” FIM that shows what fiscal policy’s contribution to growth would be if fiscal policy were consistent with real GDP growth rising at its potential rate.[1] It is calculated as the share of government purchases in GDP multiplied by the rate of potential GDP growth. As shown in the following chart, neutral FIM averages about 0.4 percentage points. When FIM is above this level, fiscal policy is boosting real GDP growth above its potential rate, and when it is below this amount, it is holding down growth below its potential rate.
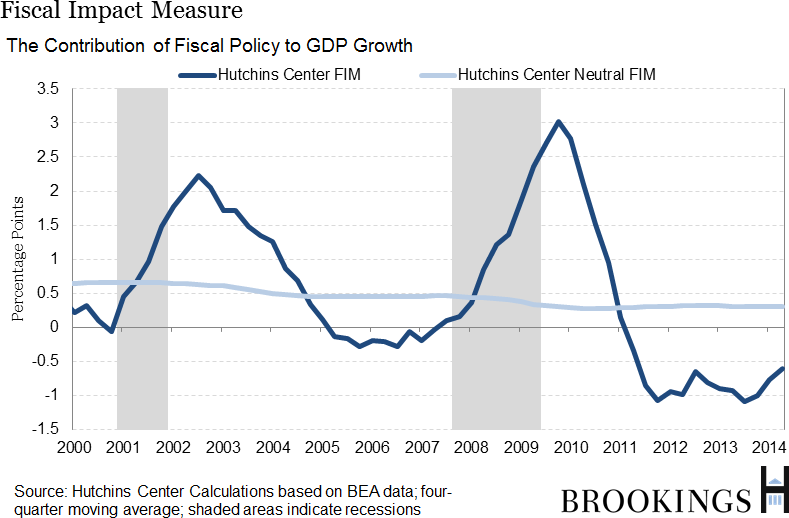
There are many combinations of spending, taxes, and transfers that could make fiscal policy neutral. For example, policy would be neutral if the growth rate of government purchases were equal to the growth rate of potential GDP and taxes and transfers were a constant share of GDP. Alternatively, purchases could fall while transfers increase or tax revenues decrease. All that matters is the net effect of purchases, taxes, and transfers on GDP.
Detailed Construction of FIM
The Hutchins Center FIM uses quarterly data from the U.S. Commerce Department’s Bureau of Economic Analysis (BEA) to measure the contribution of fiscal policy to GDP growth. It includes both the direct effect of government purchases on GDP (which the Bureau of Economic Analysis calculates and can be found in Table 1.1.2 here) as well as an estimate of the indirect effects of fiscal policy on GDP growth through its effect on private consumption.
Calculating the effects of fiscal policy on consumption requires a number of assumptions. In particular, we make an assumption about the magnitude of the effect of a change in taxes and transfers on consumption (the MPC, or the marginal propensity to consume) and the timing of the effects (consumers may not respond instantaneously to changes in taxes or benefits). We then calculate what consumption growth would have been in the hypothetical scenario of taxes and transfers both equal to zero. The difference between that growth rate and the actual growth rates represents the share of consumption growth attributable to fiscal policy. To get an estimate of the contribution to GDP growth, we multiply the contribution to consumption growth by the nominal ratio of consumption to GDP.
Our assumptions for the MPC of each component of taxes and transfers are similar to those used by Follette, Kusko, and Lutz (2008).[2]
- Personal taxes, contributions to social insurance, and production and import taxes:
- MPC = .6.
- 60 percent of the effect occurs in the first year, and 40 percent in the second.[3]
- Corporate taxes:
- MPC = .4.
- Effect occurs smoothly over 3 years.
- Transfer payments:
- MPC = .9.
- Effect occurs smoothly in the first year.
[1] Potential GDP growth is the growth rate that would prevail were the economy at full-employment. We use CBO’s latest estimates of potential GDP growth, found here.
[2] In each case, our MPCs are a bit lower than the Fed’s, because it is likely that changes in taxes and benefits that are not derived from changes in tax policy will have smaller effects on consumption.
[3] So the effects of taxes on consumption in a particular quarter will be equal to 0.6 times the weighted average of taxes over the past year (with this quarter’s taxes getting a larger weight than taxes four quarters ago) +0.4 times the average of taxes in the previous year, all deflated by the PCE deflator.