Updated with an expanded edition on August 16, 2022
A popular narrative holds that social programs that are targeted by income almost invariably fare poorly politically and tend to be cut or eliminated over time, while programs that are universal—available to people at all income levels—do much better. The experience of recent decades, however, casts strong doubt on this narrative. Over the 1979-2019 period, mandatory programs (i.e., entitlements and other programs funded outside the appropriations process) that are targeted—which includes programs like Medicaid, SNAP, and the EITC—grew at an average annual rate more than 40 percent faster than the three main universal mandatory programs (Social Security, Medicare, and Unemployment Insurance, or UI) did. The targeted programs increased markedly as a share of all mandatory spending; the universal programs’ share, while still considerably larger, remained unchanged. In both categories, some programs were expanded while others were cut. The variation in how programs within each of these two categories fared exceeds the variation between the two program categories.
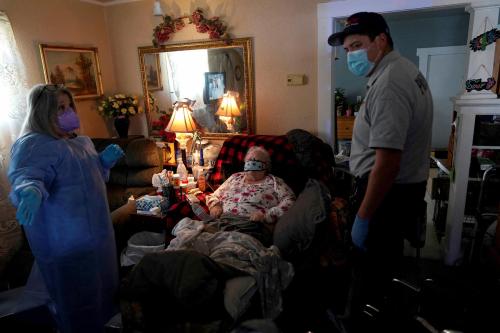
Annual expenditures for Medicaid and the Children’s Health Insurance Program (also targeted) grew sevenfold between 1979 and 2019, after adjusting for inflation and population growth. Growth in the EITC and SNAP was dramatic as well. To be sure, Medicaid and SNAP were cut in the early 1980s and by the 1996 welfare law. Yet policymakers subsequently expanded both programs substantially, more than compensating for the cuts in terms of the overall amount of benefits provided and program enrollment. But targeted programs that provide cash assistance to people who aren’t elderly or disabled and often aren’t employed—programs often labeled “welfare”—were cut sharply.

Similarly, among universal programs, Social Security and Medicare grew, mainly due to the aging of the population, but UI was cut—both at the federal level, especially in the 1980s, and in a number of states, especially in recent years. From 2011 through 2019, fewer than 30 percent of the unemployed received UI benefits in an average month, significantly lower than in earlier decades. In addition, in the early 1980s, policymakers reduced Social Security retirement benefits, especially for people who would retire in future decades, and those cuts remain in effect today.
As these data suggest, multiple factors beyond whether a program is targeted or universal affect a program’s political strength. Of particular note is the spread in recent decades of what might be termed a new model of targeted program under which a program serves not only the poor but also people significantly above the poverty line and often a sizable share of the middle class. Nearly all targeted programs that expanded robustly now reflect this approach, which, among other things, may have lessened the racial imagery of these programs. Other factors that appear to have large effects on programs’ political fortunes include whether a program is tied to work; whether a program provides straight cash aid to people who aren’t employed and aren’t elderly or disabled or whether it provides benefits in-kind or through the tax code; whether a program is fully federally financed; and whether it has strong federal eligibility, benefit, and access standards or those matters are largely left to the states. (See the box.) Another relevant factor is cost: targeted-program expansions generally cost less than universal-program expansions, which likely is one reason that targeted programs have expanded more in recent decades.

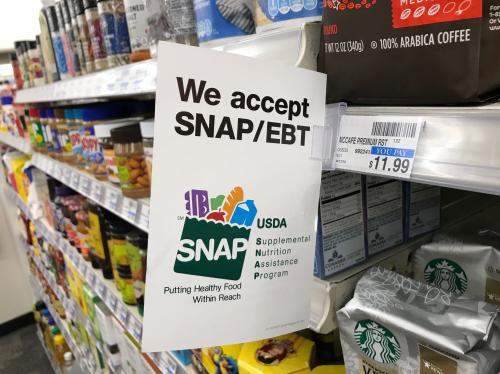
The differences among programs in “take-up rates”—the share of people eligible for a program who actually receive its benefits—also are greater among programs within the targeted category and within the universal category than between the two categories. In 2019, Medicaid and the Children’s Health Insurance Program served 92 percent of the eligible children who weren’t otherwise insured. SNAP reached 83 percent of eligible households in 2018, and because people eligible for large benefits enroll at much higher rates than those eligible for small benefits, SNAP delivers an estimated 95 percent of the benefits it would provide if everyone eligible participated. The EITC delivers nearly 90 percent of the benefits that families with children would receive if all such eligible families participated. But take-up is only about 25 percent for cash aid through the Temporary Assistance for Needy Families program. Among universal programs, take-up is close to 100 percent for Social Security, but much lower—well below the levels for various key targeted programs—for UI.
The growth over recent decades in both targeted and universal programs has lowered poverty rates. In 1970, under the Supplemental Poverty Measure, government benefits and taxes kept out of poverty only 9 percent of those who would otherwise be poor. By 2017, they kept out of poverty 47 percent of those who would otherwise be poor. Social Security keeps out of poverty far more people 65 and over than all other programs combined. Targeted programs keep out of poverty twice as many people under 65, including children, as Social Security and UI combined. Targeted programs also significantly reduce racial disparities in poverty (see the graph), although those disparities remain very wide.
Related Content


The Brookings Institution is financed through the support of a diverse array of foundations, corporations, governments, individuals, as well as an endowment. A list of donors can be found in our annual reports published online here. The findings, interpretations, and conclusions in this report are solely those of its author(s) and are not influenced by any donation.
Authors