This report is part of the Series on Regulatory Process and Perspective and was produced by the Brookings Center on Regulation and Markets.
Agency leaders make critical decisions in our modern bureaucracy. Top officials issue significant binding regulations and influential guidance documents. They make the final calls in major adjudications among private parties (including between employers and workers as well as between competing corporations). Officials regulate the rates for mail, natural gas distribution, and other key items. Some run embassies or independent investigations, while others keep the books. In the last administration, agency officials, not the White House, released regulations on open internet access and carbon pollution, deferred deportation for many individuals without documentation whose parents had brought them to this country as children, and launched investigations connected to each major presidential candidate.
Given the importance of these offices, you might think that keeping them filled at all times would be a top priority for both the president and Congress, but in fact there are vast gaps in agency leadership up and down their organization charts. In an earlier study of top jobs at cabinet departments and free-standing executive agencies from 1977 to 2005, I found between 15 and 25 percent of positions were either vacant or filled by acting officials. Averaging across another study’s examination of individual jobs, the highest positions at the Departments of Commerce and Health and Human Services lacked confirmed or recess appointees more than 20 percent of the time in the 1989-2009 period. The situation has likely only deteriorated during the last decade.
Given the importance of these offices, you might think that keeping them filled at all times would be a top priority for both the president and Congress, but in fact there are vast gaps in agency leadership up and down their organization charts.
Instead of examining vacancies across the board, which requires data on individual appointees’ tenure, I evaluate here all nominations requiring Senate confirmation for all federal agencies, from the start of President Reagan’s administration to the end of President Obama’s. In brief, over one-fifth of submitted nominations failed to get confirmed in that period, with President Obama’s nominations failing close to one-third of the time. It took the Senate almost three months, on average, to confirm nominations, with President Reagan’s nominations requiring about a month less and President Obama’s requiring about a month more. The change in voting rules for agency nominations by Senate Democrats in November 2013 did not help much. Even for the one year Democrats retained control of the Senate, confirmation delays increased significantly. Though nomination failures overall decreased in that year, many agencies close to the president saw higher failure rates. Moreover, during the final two years of the last administration, when Republicans controlled the Senate, there were higher failure rates and longer confirmation delays than in any other congress in the period.
According to the 2016 “Plum Book”, there are over 1,200 agency positions requiring both presidential nomination and Senate confirmation. There are key policy jobs in cabinet departments, including the secretaries, a slew of under, deputy, and assistant secretaries, and other key officials (such as inspectors general). The decision-makers in independent regulatory commissions and boards (such as the Federal Communications Commission and the National Labor Relations Board) also require Senate approval, as do policymakers in free standing executive agencies (such as the Environmental Protection Agency). There are also important Senate-confirmed players in quasi agencies such as the United States Postal Service.
Although the 1998 Federal Vacancies Act allows certain temporary officials to fill in for limited periods, mostly in cabinet departments and executive agencies, the absence of Senate-confirmed leaders has been linked to inaction, attacks on the accountability of the modern administration state, and confusion and low morale among lower-level workers. It is no surprise that we see both delays in getting a new team in place and decreases in proposed regulations in the first year of a new administration.
This report uses all non-routine civilian nominations (13,961) to agency positions from congress.gov to examine the fate of agency nominations in the Senate from the past five administrations, and to make some predictions for President Trump’s administration.1 The observations in the database are individual nominations submitted to the Senate that succeeded or failed.2 Success is defined as confirmation of a particular nomination. Failure includes rejection by the Senate, but almost always instead reflects the nomination’s return to the president under the Senate’s rules or its withdrawal by the White House. Sometimes, a returned nomination leads to a subsequent successful nomination of the same individual for the same position; this analysis treats such instances as two separate observations. Unless noted explicitly, I exclude 168 nominations that were made by outgoing presidents in their final few weeks in January.
I first analyze nomination failures – by year, president, timing within all administrations, agency category, and position type. I then turn to confirmation delays for successful nominations, considering the same dimensions. I next consider the Democrats’ decision to change the rules for processing agency nominations in November 2013, so that only a majority of the Senate is required to set time limits on voting (and thus end any potential filibuster). Finally, I make some suggestions for considering the current administration’s nomination track record.
Nomination Failures
Over one in five agency nominations (22 percent) failed to get confirmed. Nominations in 1981 were the most likely to get confirmed: only 4 percent did not yield positive votes. Nominations in 2016 were the least likely to get confirmed, with a whopping 72 percent failing.
The graph below charts failure rates by congress. Although there were variations over time, some corresponding to party control and some to timing within an administration, the appointments process was more difficult for the most recent administrations. While both President Reagan’s and President George H.W. Bush’s agency nominations had 16 percent failure rates, that figure jumped to 21 percent for President Clinton. President George W. Bush saw 25 percent of his nominations fail to get confirmed, and President Obama’s failure rate climbed to 30 percent. Interestingly, President Obama submitted fewer nominations (2828) than any of the other two-term presidents. President George W. Bush submitted the highest (3459); Presidents Reagan and Clinton each submitted around 3000 (2929 and 3014, respectively).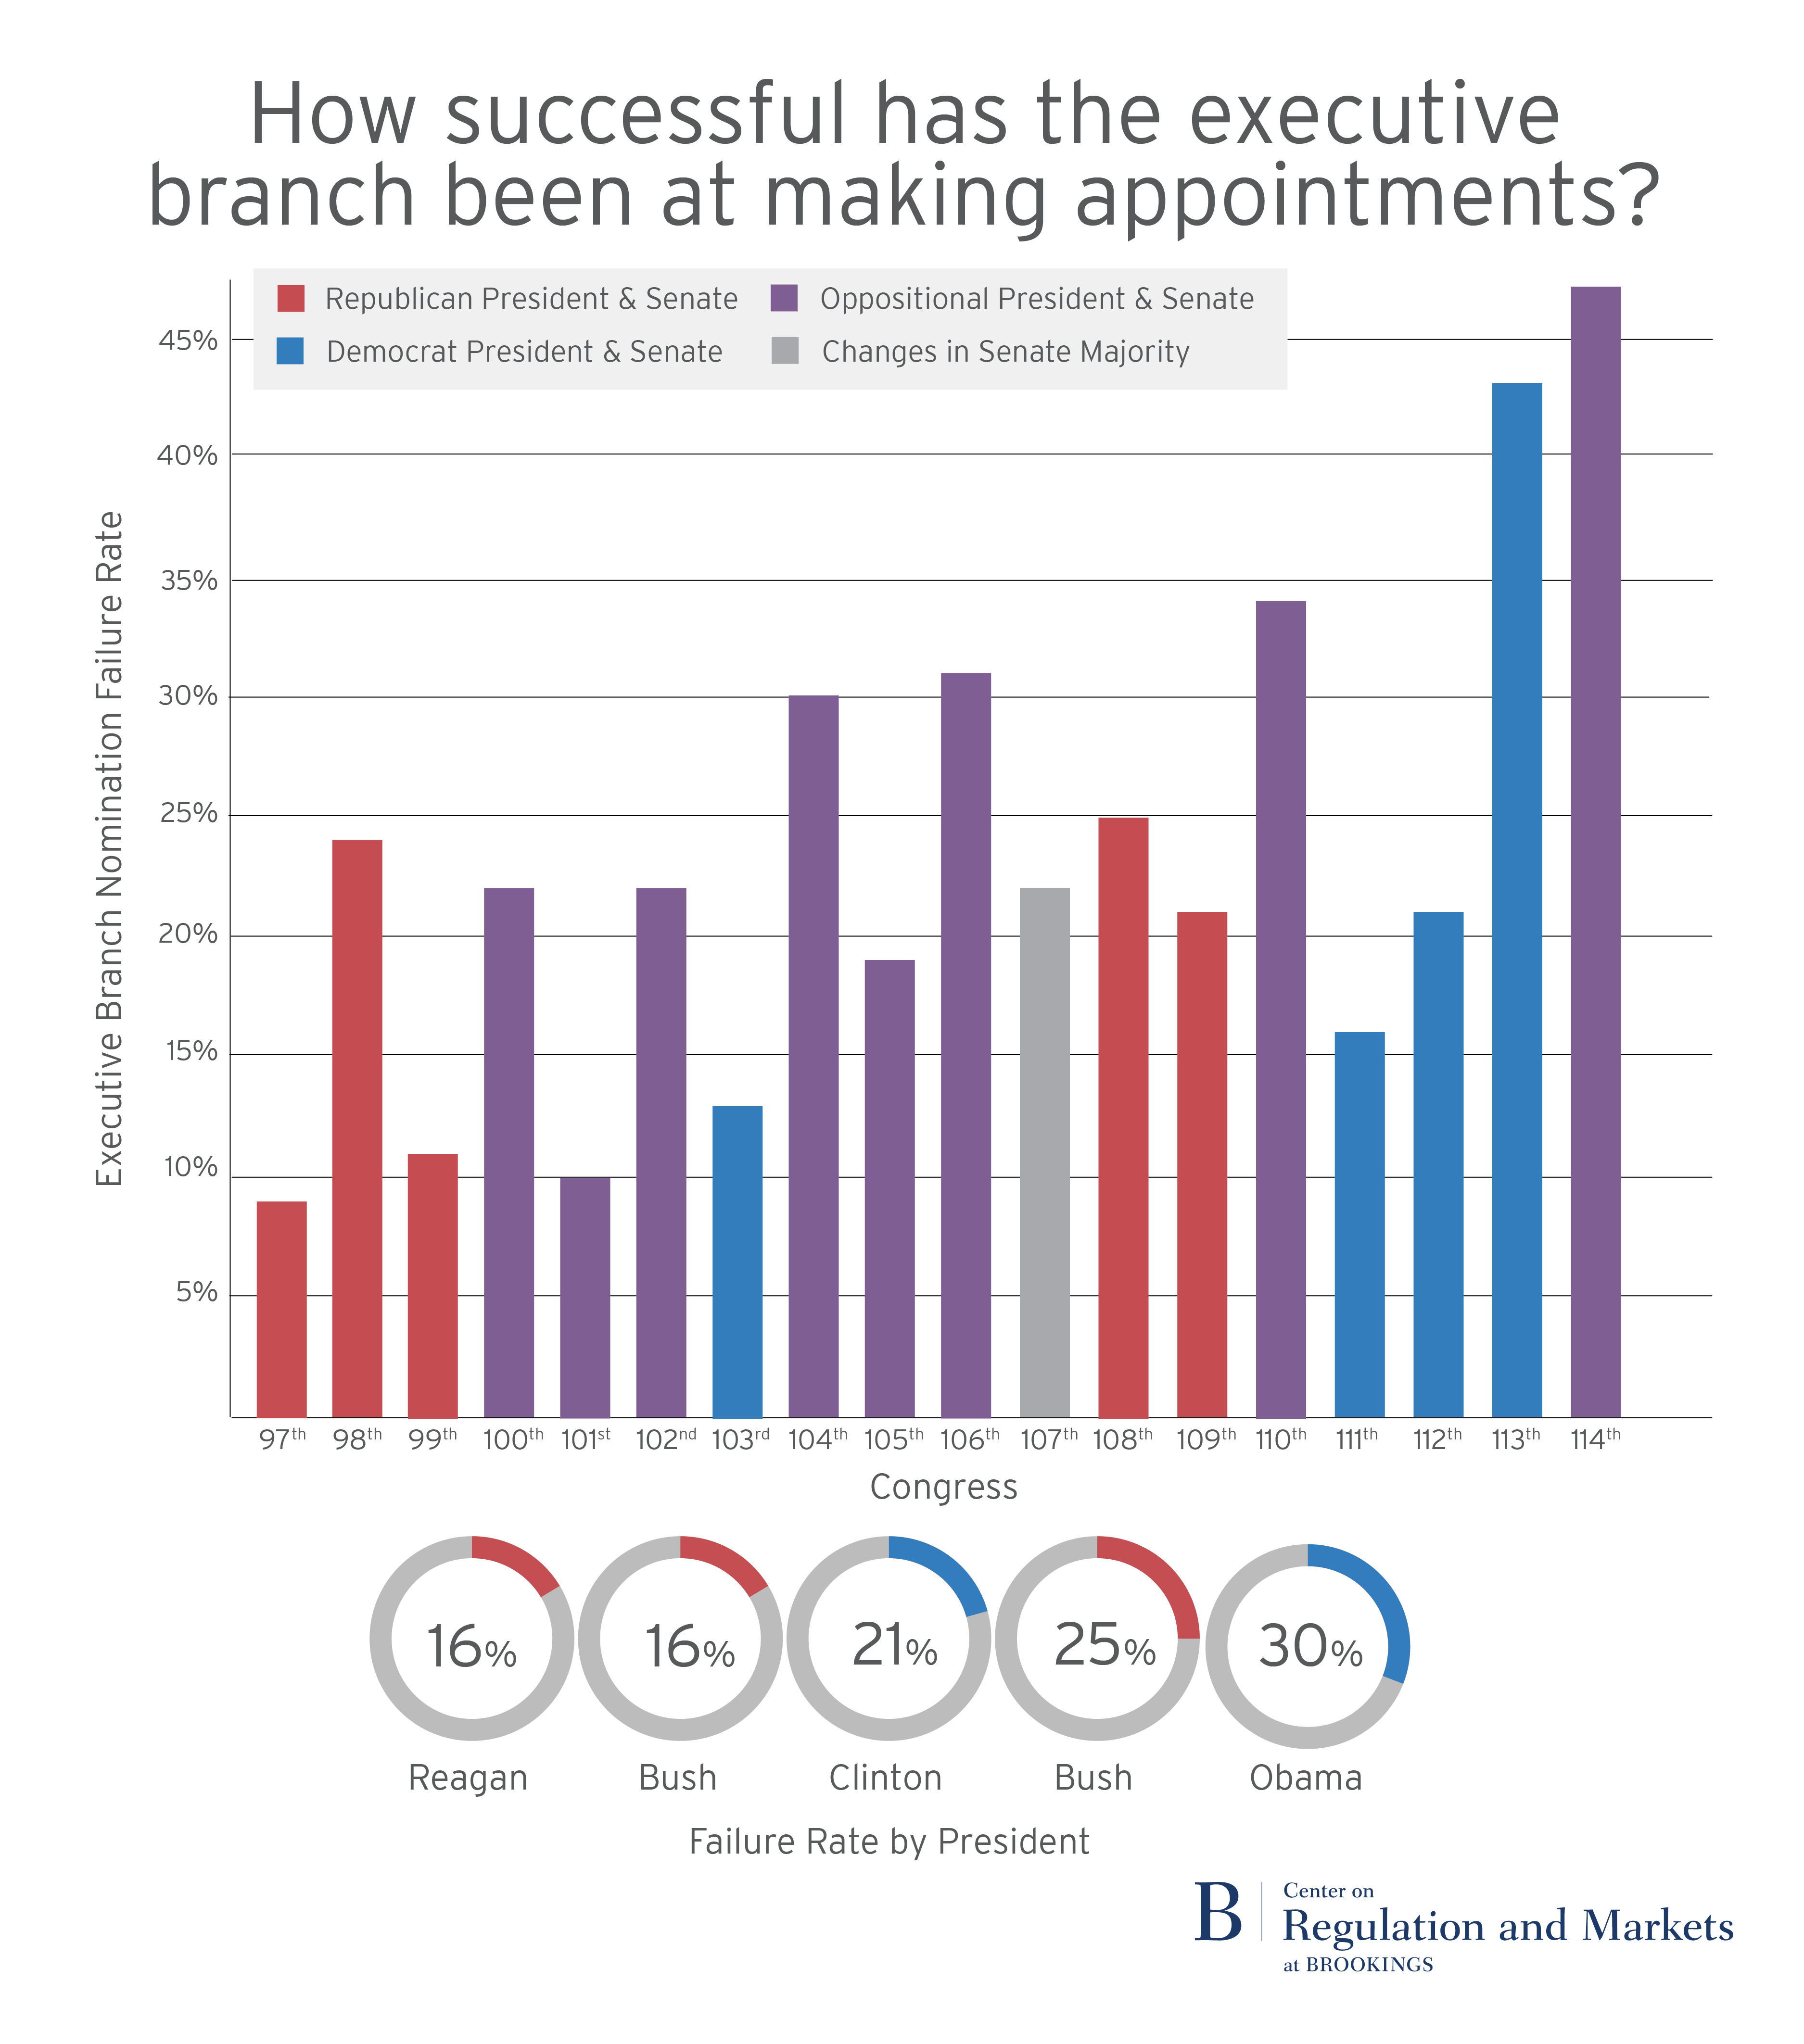 Presidents did benefit at the start of their administrations, in part because of deference to the new president’s first picks and in part because the Senate was often controlled by the president’s party early on. Over the past five administrations, 92 percent of first-year nominations were confirmed. President George W. Bush’s unusually high failure rate in his first year was due to nearly 100 nominations being submitted in July and early August, which were returned in August due to Senate rules (on recess schedules).3 By contrast, lame duck presidents’ final picks in the early weeks of January before the next president’s inauguration overwhelmingly failed (only 5 percent were confirmed under the next president); these nominations are excluded from the chart above. In their final calendar year, overall, a bare majority of the president’s selections (56 percent) succeeded. In the middle, the failure rates for the second through seventh years were: 24, 16, 37 (final year of a term), 22, 26, and 24 percent, respectively.
Senate-confirmed positions exist in a wide range of entities, from classic cabinet departments to government corporations. Table 1 displays failure rates by the major categories of agencies.4 Nominations to independent regulatory commissions and boards like the FCC and NLRB were more likely to fail than nominations to cabinet departments, executive agencies, or White House entities. Among less classic forms of agencies, nominations to quasi agencies (banks, government corporations, funds and other public-private organizations) had the hardest path, with more than one-third failing to get confirmed. Across all types of organizations, even though they wield the least authority, advisory entities had the least success with nominations, perhaps because the Senate does not see them as important to fill.
Another way to slice the nominations is by the type of job. Table 2 shows failure rates for major positions in the data.5 Cabinet secretary nominations were the most likely to succeed, with a 6 percent failure rate. Picks for boards of trustees and directors were most likely to fail. Heads of independent commissions and quasi agencies, non-board directors, general counsels, and inspectors general also had above-average failure rates.
Confirmation Delays
For nominations that get confirmed, success is not instantaneous. The average period between the Senate’s receipt of the nomination and confirmation varied, from a low of 31 days in 1981 to a high of 166 days in 2011.
The figure below, which charts confirmation delays by congress, again shows variation, sometimes attributable to party control and sometimes to timing within an administration. And, as with nomination failures, confirmation delays were worse for the most recent administrations. Both Presidents Reagan and George H.W. Bush faced about two-month delays, on average (60 and 62 days, respectively). Successful nominations by Presidents Clinton and George W. Bush took almost an additional month (86 and 90 total days, respectively). President Obama’s confirmed nominations required slightly more than an additional month beyond that (122 days). Not only were nominations more likely to get confirmed in the first year, successful nominations were confirmed more quickly at the start of an administration. Over the past five administrations, first-year nominations took 60 days to confirm, on average. The next best year was the second year, at 71 days. The next to last year of a presidential term generated the longest waits. Confirmation delays averaged 103 days in the third year and 122 days in the seventh year. The remaining years fell in between. Confirmation delays for the fourth, fifth, sixth, and eighth years were, on average, 86, 92, 88, and 86 days, respectively.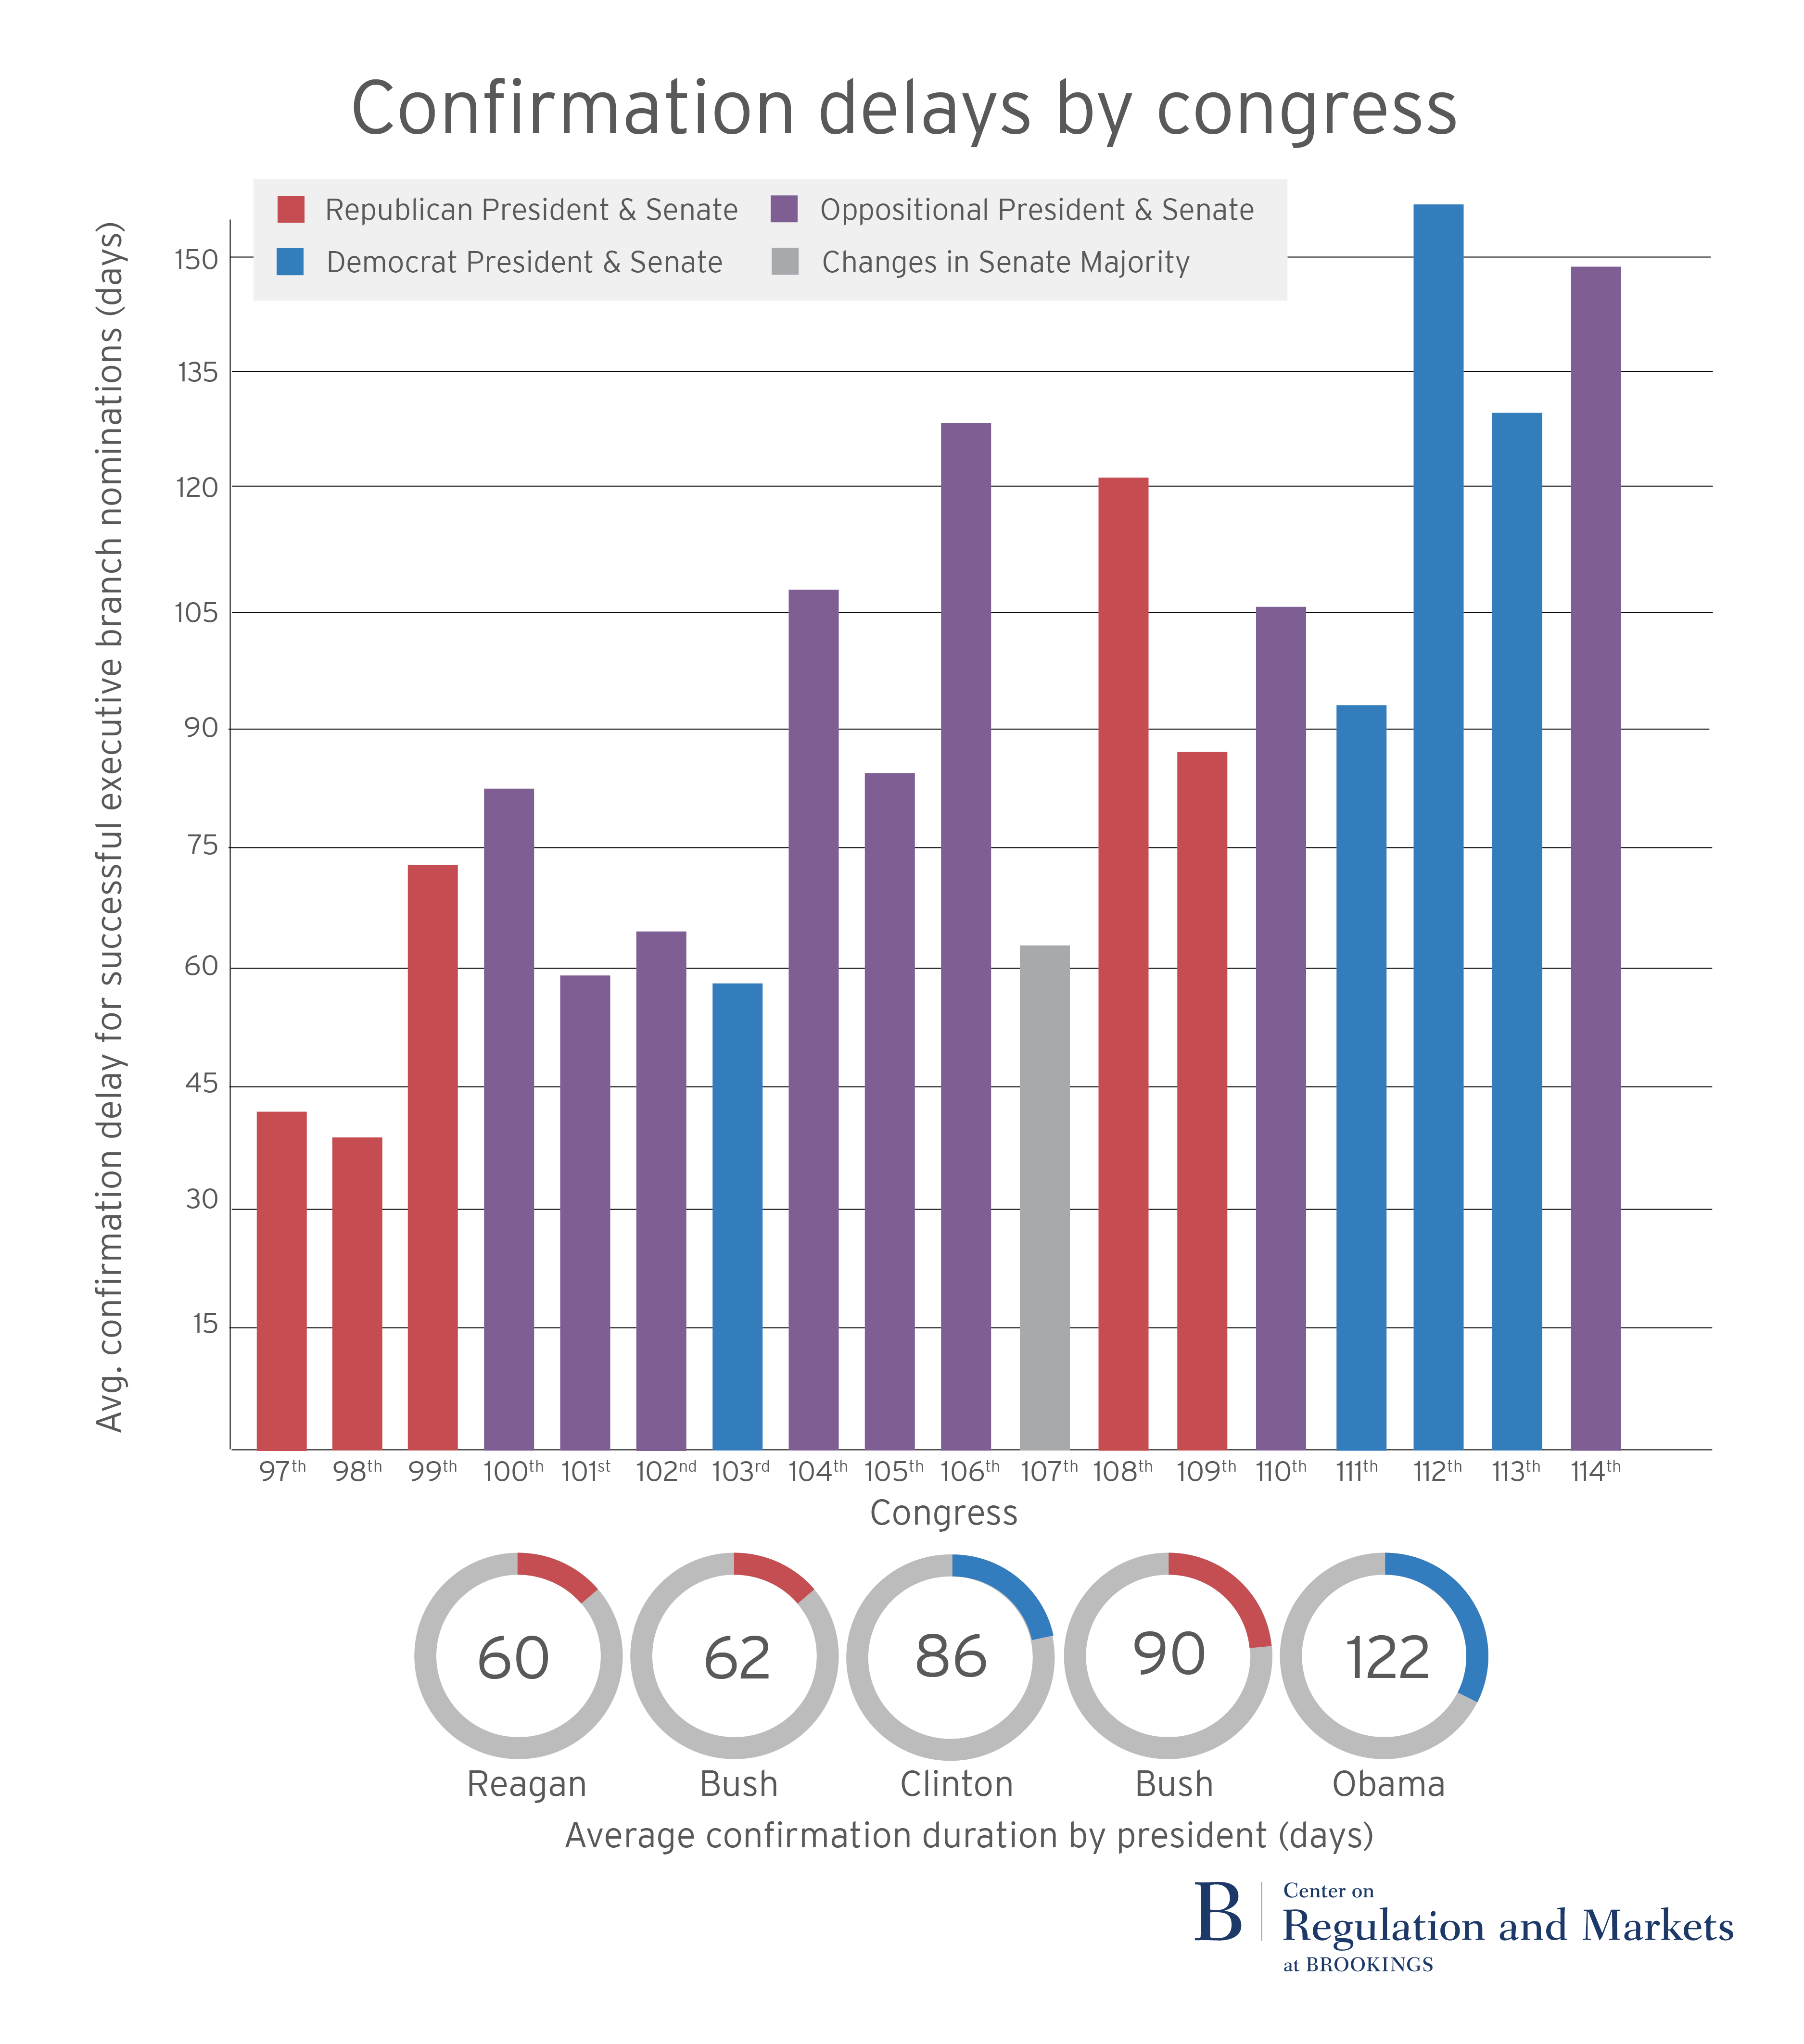 Table 3 shows confirmation delays by agency type. The confirmation process was shortest for agencies closest to the president, including cabinet departments, free standing executive agencies outside the Executive Office of the President, and White House agencies, taking between two and three months, on average. Successful nominations to national councils and quasi agencies typically required three to fourth months. Not only did advisory councils see a higher percentage of their nominations fail, the ones that succeeded also took the longest of any type of entity.
Table 4 displays confirmation delays by position. On this dimension, too, worse confirmation delays are paired with greater nomination failure rates. Delays for cabinet secretaries were shortest, by a significant margin. Successful nominations to boards of directors and trustees took the most time. Heads of independent commissions and quasi agencies, non-board directors, inspectors general, and chief financial officers also had above-average confirmation delays.
Filibuster Reform
In November 2013, Senate Democrats changed the voting rules for agency (and lower court) nominations to permit a majority of the Senate to move a nomination to a vote, thereby excluding the possibility of filibusters. Democrats sensibly expected more nominations to get confirmed and for those confirmations to take less time under the new system, all else being equal.
That expectation played out for the lower courts while Democrats retained control of the Senate. By contrast, the picture was much more mixed for agencies. A bare majority (52 percent) of agency nominations submitted in 2013 before the change failed to get confirmed. By contrast, 35 percent of nominations submitted in 2014 failed. Failure rates, however, increased for free-standing executive agencies, within and outside the Executive Office of the President, and for national councils.
More surprisingly, confirmation delays for agency nominations increased across the board. For those successful 2013 nominations (a few of which were actually confirmed in December after the change), they took 95 days, on average. In 2014, delays ballooned to 150 days. Indeed, it was the biggest jump in any given year in an administration between any two presidents.
Looking Forward
From this look back at the past five administrations, we can draw several lessons as we evaluate the new administration’s progress on staffing federal agencies in upcoming months. President Trump’s first year should prove the easiest, both because it is early on and because his party controls the Senate. But it will not be without its challenges.
First, not all nominations will get confirmed. Even in the first year, I expect around five percent of President Trump’s initial nominations will be withdrawn or returned to the White House. We have already seen two formal withdrawals, those of Andrew Puzder and Vincent Viola. Returns will come later. The failure rate should increase after the first year, to over ten percent. To be sure, some of those returned nominations will ultimately produce confirmations, but at some delay.
Related Content
Second, we should expect confirmation delays for successful nominations. While few nominations should fail in the first year, I expect the others to take several months to get confirmed. After the change to the Senate’s voting rules for agency nominations in late 2013, confirmation delays significantly worsened the following year, when Democrats still controlled the Senate. The minority can (and probably will) drag out the process, most notably by demanding nominees answer written questions and by requiring a recorded vote instead of unanimous consent.
Third, President Trump may simply not submit as many nominations. He has already declared that “in many cases, we don’t want to fill those jobs.” He prefers a smaller government ideologically and presumably likes smaller organizations to manage from his private sector experience. He may also soon realize that the process is hard and long, and will be even more so if Democrats regain control of the Senate. President Obama submitted fewer nominations than his predecessors, allowing acting officials to fill in for many important positions. President Trump could follow suit. I will analyze the Trump administration’s early record in an upcoming post.
Appendix
| Table 1: Failure Rates by Agency Categories (percentage) | |
|---|---|
| Cabinet Department (all) | 15 |
| Cabinet Department (main) | 19 |
| Executive Agency | 20 |
| White House Agency | 20 |
| Independent Regulatory Commission/Board | 32 |
| Quasi Agency | 35 |
| National Council | 24 |
| Advisory Entity | 37 |
| Table 2: Failure Rates by Position Types (percentage) | |
|---|---|
| Secretaries | 6 |
| Deputy Secretaries | 16 |
| Under Secretaries | 18 |
| Assistant Secretaries | 18 |
| U.S. Marshals | 10 |
| U.S. Attorneys | 12 |
| Ambassadors | 11 |
| General Counsels | 22 |
| Inspectors General | 26 |
| Chief Financial Officers | 20 |
| Administrators | 21 |
| Deputy Administrators | 21 |
| Assistant Administrators | 20 |
| Directors | 23 |
| Deputy Directors | 25 |
| Executive Directors | 24 |
| Board Directors | 35 |
| Board Trustees | 37 |
| Heads of Independent Entity | 32 |
| Table 3: Confirmation Delays by Agency Categories (days) | |
|---|---|
| Cabinet Department (all) | 71 |
| Cabinet Department (main) | 77 |
| Executive Agency | 75 |
| White House Agency | 80 |
| Independent Regulatory Commission/Board | 98 |
| Quasi Agency | 117 |
| National Council | 106 |
| Advisory Entity | 138 |
| Table 4: Confirmation Delays by Position Types (days) | |
|---|---|
| Secretaries | 23 |
| Deputy Secretaries | 62 |
| Under Secretaries | 74 |
| Assistant Secretaries | 79 |
| U.S. Marshals | 71 |
| U.S. Attorneys | 62 |
| Ambassadors | 68 |
| General Counsels | 84 |
| Inspectors General | 104 |
| Chief Financial Officers | 111 |
| Administrators | 72 |
| Deputy Administrators | 83 |
| Assistant Administrators | 77 |
| Directors | 87 |
| Deputy Directors | 92 |
| Executive Directors | 98 |
| Board Directors | 125 |
| Board Trustees | 140 |
| Heads of Independent Entity | 97 |
O’Connell is a public member of the Administrative Conference of the United States, appointed by the Chairman. This report has been written independently of her affiliation with ACUS and does not necessarily reflect ACUS’s views.
Authors

-
Footnotes
- The database thus excludes judicial nominations (including to non-Article III courts, such as the United States Court of Appeals for Veterans Claims), military nominations, and routine nominations to the Foreign Service (but includes career and political ambassadors), the National Oceanic and Atmospheric Administration, and the Public Health Service (but includes the Surgeon General). For more information on the database, see the Data Appendix to Anne Joseph O’Connell, Shortening Agency and Judicial Vacancies through Filibuster Reform? An Examination of Confirmation Rates and Delays from 1981 to 2014, Duke Law Journal 64: 1645-1713 (2015). I revised the database in that article for this report in several important ways: (1) included nominations from January 1, 2015 to January 19, 2017; (2) added pre-2015 nomination records that did not show confirmation or failure in the last action field (but through an examination by hand had actually been confirmed or returned to the president); (3) corrected agency and position coding through by hand examination of the data; and (4) corrected error in the coding of the seventh year of President Clinton’s administration. The database is missing at least 100 nominations submitted by President Reagan in the 1981-1986 period due to the records being miscoded as military or bulk nominations on congress.gov. I am working to find and code these nominations but do not expect any substantive results here to change in any meaningful way. Because congress.gov does not distribute its data in an easy to use format, I am indebted to Michael Lindsey in the Berkeley Law Library for scraping the data into a usable form.
- Sometimes, a single individual has multiple nomination records – either because she was named at the same time to multiple positions requiring Senate confirmation (for example, the same person is named to Secretary of the Treasury and U.S. Governor of the International Monetary Fund, or the same person is named to fill the end of a term position on a commission and to a new full term position) or because her first nomination failed and she was renominated to the same position soon after. Other observers of the nominations process, such as the Partnership for Public Service, sometimes combine multiple observations (of the former kind) into one nomination record. On the second kind, although some of these subsequent nominations were successful, most nomination failures in the data did not eventually result in a subsequent nomination getting confirmed.
- When you exclude nominations that failed in 30 or fewer days (almost always because they were submitted close to a congressional recess that produced their return to the White House), failure rates drop slightly – about 4 percentage points – for all but President Obama, whose rate drops only one percentage point.
- “All” Cabinet refers to any non-advisory position in a cabinet department. “Main” Cabinet excludes ambassadors, U.S. representatives of any kind, U.S. marshals, and U.S. attorneys. “Executive Agencies” include non-advisory jobs in any free-standing executive agency not considered to be part of the Executive Office of the President, such as the Environmental Protection Agency. White House Agencies cover non-advisory positions in the EOP entities, such as the Office of Management and Budget and the Office of the U.S. Trade Representative, among others. “Independent Regulatory Commissions or Boards” include non-advisory jobs in any non-quasi agency with some formal independence from the president (such as the Federal Communications Commission). “Quasi Agencies” cover non-advisory positions in any fund, bank, corporation, or other partly private entity. “National Councils” include national commissions and councils, which do not contain the word “advisory” in their title. “Advisory Entities” encompass any advisory position in all forms of organizations.
- The position categories are largely self-explanatory, except for several items. First, “Secretaries” include all Cabinet Secretaries and Secretaries of the Army, Navy and Air Force. Second, all positions in the Department of Justice were coded to their equivalent jobs in other departments (for example, an Assistant Attorney General is marked as an Assistant Secretary). Third, “Heads of Independent Entity” include top (non-advisory) officials in independent regulatory commissions and boards as well as in quasi agencies.